Atomistic modeling of energetics and dynamics of diffusive and frictional phenomena in c60 graphene based systems
Bạn đang xem bản rút gọn của tài liệu. Xem và tải ngay bản đầy đủ của tài liệu tại đây (3.68 MB, 143 trang )
ATOMISTIC MODELING OF ENERGETICS AND
DYNAMICS OF DIFFUSIVE AND FRICTIONAL
PHENOMENA IN C
60
/GRAPHENE-BASED SYSTEMS
MEHDI JAFARY ZADEH
M.Sc. (Hons.), Materials Science and Engineering,
Sharif University of Technology, Iran
A THESIS SUBMITTED FOR THE DEGREE OF
DOCTOR OF PHILOSOPHY
DEPARTMENT OF MATERIALS SCIENCE AND ENGINEERING
NATIONAL UNIVERSITY OF SINGAPORE
2013
DECLARATION
I hereby declare that the thesis is my original work
and it has been written by me. I have duly
acknowledged all the sources of information which
have been used for the thesis.
This thesis has also not been submitted for any
degree in any university previously.
MEHDI JAFARY ZADEH
2013
i
Acknowledgments
My Ph.D. research would not be completed without the guidance and support of many
people. Firstly, I would like to express my sincerest gratitude to my Ph. D. supervisor
Prof. Zhang Yong-Wei and my co-supervisor Dr. Chilla Damodara Reddy for their
guidance, inspiration and encouragement during my Ph.D. study. Their strong support
and valuable comments helped me overcome lots of difficulties during my research. I
would like to thank Dr. Viacheslav Sorkin from Institute of High Performance
Computing (IHPC), for all his help and valuable discussions and comments.
I would like to give my thanks to the staffs in IHPC (especially Dr. Palla Murali, Dr.
Liu Ping, Dr. Bharathi M. Srinivasan and, Dr. R. Hariharaputran, and Dr. Mark Jhon) and
Department of Materials Science and Engineering (MSE, NUS) for their helpful
discussions, support and friendship. The computational facilities provided by IHPC, and
MSE Department for my research works are greatly acknowledged.
I would like to thank my friends Dr. M. Khazaei and Dr. R. Tavakoli for their kind
support and scientific discussions. I have to thank my friend Dr. J. R. Jennings for all his
help. I also would like to thank my other friends, especially Lisen, for their friendship and
encouragement during my life and study in Singapore.
Last but not least, I would like to thank all my family members, especially my parents,
for their concerns, passionate support and encouragement.
ii
0BTable of Contents
Acknowledgments i
Table of Contents ii
Summary Error! Bookmark not defined.
List of Tables vii
List of Figures viii
List of Symbols xiii
List of Abbreviations xvi
1 Introduction 1
1.1 Surface diffusion controls the self-assembly and growth mechanism 3
1.2 Surface diffusion and friction of nanoscale objects 6
1.2.1 Nanofriction 6
1.2.2 Surface diffusion and nanofriction 7
1.3 Motivations of the thesis 7
1.3.1 Structured graphene-based substrate for mass transport 7
1.3.2 Physisorption of fullerenes on graphene and the importance of van der
Waals interactions 8
1.3.3 Applications of the C
60
/graphene system in nanotechnology 9
1.4 Open questions and objectives of the thesis 10
1.4.1 Diffusive regimes beyond the conventional picture of surface diffusion . 11
1.4.2 Effect of rotational degrees of freedom of admolecules on their surface
diffusion 11
1.4.3 Temperature effects on the kinetic friction of nanoscale building blocks 12
1.4.4 Controlling molecular mobility by altering the substrate chemistry 13
1.5 Outline of the thesis 14
2 Surface diffusion phenomena: an overview 15
iii
2.1 Basic concepts on the interactions between adsorbate and substrate 15
2.1.1 Adiabatic coupling of adsorbate to surface 17
2.1.2 Non-adiabatic coupling of adsorbate to surface 17
2.2 A microscopic description of surface diffusion 18
2.2.1 Single particle (tracer) diffusion 18
2.2.2 Thermally activated jumps 18
2.2.3 Collective surface diffusion 28
2.3 Experimental techniques to study surface diffusion 30
2.4 Theoretical and computational techniques to study surface diffusion 32
2.4.1 Transition state theory: conventional model of surface diffusion 33
2.4.2 Langevin and Fokker-Planck equations 34
2.4.3 Monte Carlo simulations 36
2.4.4 First-principles (ab initio) methods 36
2.4.5 Molecular dynamics simulations 37
3 Computational techniques 39
3.1 Why was MD technique chosen for the current study? 39
3.1.1 Molecular surface diffusion 39
3.1.2 Application of MD simulations to study molecular surface diffusion 39
3.2 An overview of MD simulations 40
3.3 MD Software (LAMMPS) 42
3.4 Atomic potential 43
3.5 Calculation details 43
4 Transition from quasi-continuous to ballistic-like Brownian regime 46
4.1 Introduction 46
4.2 Model and methodology 49
iv
4.3 Results and discussions 49
4.4 Summary 57
5 Effect of rotational degrees of freedom on molecular mobility 58
5.1 Introduction 58
5.2 Model and methodology 60
5.3 Results and discussion 61
5.4 Summary 72
6 Effect of temperature on kinetic nanofriction of a Brownian adparticle 73
6.1 Introduction 73
6.2 Model and Methodology 76
6.3 Results and discussion 76
6.4 Summary 84
7 A chemical route to control molecular mobility on graphene 85
7.1 Introduction 85
7.2 Model and methodology 87
7.3 Results and discussion 89
7.3.1 Random trap and barrier model 97
7.4 Summary 101
8 Conclusions and future work 102
8.1 Conclusions 102
8.2 Future work 104
Bibliography 109
Appendix: List of Publications 124
v
Summary
Understanding the diffusive and frictional mechanisms of adsorbates on periodic or
random surfaces is a ubiquitous interest. Surface diffusion is a key to control the rate of
self-assembly and growth in bottom-up approaches. Moreover, friction of nanoscale
moving objects (nanofriction) is important in development of nanoelectromechanical
systems (NEMS), surface probing and tribological devices. Interestingly, surface
diffusion and nanofriction are closely related.
Despite numerous experimental and theoretical studies having been performed to
illuminate surface diffusion and nanofriction, a comprehensive atomic-scale
understanding of these phenomena remains elusive. For example, continuous surface
Brownian motion (BM), which is beyond the traditional picture of surface diffusion
based on the thermally activated jumps, is largely unexplored. Moreover, conventional
tip-based techniques, such as Atomic Force Microscopy which are widely used in
nanotribology, can only evaluate the static friction between the adsorbates and their
substrates. These techniques are not suitable to determine the kinetic nanofriction of
mobile adsorbates. The relation between diffusion and friction of adsorbates may help to
address this problem. Additionally, the effect of chemical modification or contamination
of the substrate on the mobility of an adsorbate is another intriguing problem.
Computational techniques are powerful tools to address the challenging issues
discussed above with the atomic-scale resolution. In this thesis, we employ molecular
dynamics simulations to study the surface diffusion of a single C
60
admolecule on
graphene substrate, which is considered as a prototypical physisorbed system. We show
that the C
60
admolecule exhibits two distinct regimes of surface Brownian motion (a
vi
quasi-continuous and a ballistic-like) on graphene. A crossover occurs between these two
regimes by merely changing the temperature which alters the mechanism of exchanging
the energy between the admolecule and the substrate.
We evaluate the effect of rotational degrees of freedom (DOFs) of the C
60
admolecule
on its surface diffusion. We show that there is an intermediate temperature range in
which the rotational DOFs provide alternative routes for the admolecule to overcome the
energy barriers and performing a quasi-Brownian motion, which enhances the
admolecule mobility. Beyond this intermediate temperature range, the contribution of
rotational DOFs to the overall mobility of the admolecule is negligible.
We develop a theoretical framework to study the temperature dependence of kinetic
nanofriction. We use the Einstein’s theory of Brownian motion to analyze the surface
diffusion of the C
60
admolecule on graphene, and show that the decrease of kinetic
nanofriction coefficient with temperature in this system follows an Arrhenius form.
By comparing the diffusion of C
60
admolecule on both pristine and hydrogenated
graphene, we introduce a chemical route to control the molecular mobility. Our results
demonstrate that a minute hydrogenation (dehydrogenation) of the graphene (graphane)
drastically reduces the mobility of admolecule. We suggest a theoretical model, which
takes the effects of both random traps and barriers into account, to predict the diffusion
coefficient as a function of temperature and hydrogen coverage. Our findings provide
insights into the understanding of the diffusive and frictional phenomena at the nanoscale,
and may help to develop future NEMS.
vii
List of Tables
Table 2.1 Experimental techniques applied to study surface diffusion (for details, refer to
[91, 128] and references therein). 31
Table 5.1 Arrhenius parameters of different diffusive regimes and their corresponding
temperature ranges in the presence and absence of admolecule rotational DOFs
(R-C
60
and NR-C
60
, respectively). 68
viii
List of Figures
Figure 1.1 Two main approaches of controlling matter and fabricating structures at the
nanoscale. In top-down techniques, several methods like lithography, writing,
or stamping are employed to form the desirable features from the bulk.
Bottom-up approaches rely on self-processes to order atoms and molecules to
form the structures. The insets from top left in the clockwise order show a
Scanning Electron Microscopy (SEM) of a nanomechanical device
fabricated by electron beam lithography (EBL), structured thin film of CNTs,
a single CNT connecting two electrodes, a nanoporous metal-organic
network consisting of functional molecules and iron atoms, and the letter ―C‖
obtained by manipulating and positioning 7 carbon monoxide (CO)
molecules using STM tip [27]. 3
Figure 1.2 Growth processes on a surface at the atomic-scale. The atoms or molecules
(building-blocks) are deposited (with flux F) on the surface from a vapor
phase or an incident beam. The adsorbed building-blocks (adsorbates) diffuse
on the surface (with rate D) until they meet other adsorbates and form new
aggregation nuclei, or attach to other pre-formed islands. The type of growth
is strongly dependent on the D/F ratio. Metallic islands (micrographs on the
left-hand side) are controlled by growth kinetics (small D/F values). The
super-molecular self-assembly (the micrograph on the right) is based on
molecular recognition at equilibrium conditions (large D/F values).
Semiconductor nanostructures (the micrographs in the centre) are usually
grown at intermediate D/F, and hence the complex interplay between kinetics
and thermodynamics determines their morphology [27]. 5
Figure 2.1 (a) Schematic of a substrate (open circles) and two adsorbed atoms (full circles
in (1) an equilibrium and (2) a saddle-point configuration. z, distance normal
to the surface, x along the surface. (b) Potential energy diagram for the
adsorbate moving perpendicular to the surface in x positions 1 and 2 as in (a).
(c) Potential energy diagram for the adsorbate moving laterally (parallel to
the surface). The activation energy of diffusion E
a
, is equal to the energy
difference of the minima of curves 1 and 2 in (b). 16
Figure 2.2 (a) One-dimensional and (b) two-dimensional random walks [103]. 19
Figure 2.3 Periodic one dimensional potential V
A
(x). The particle starts at the saddle point
(transition state) with the potential energy of E
A
and the kinetic energy of k
B
T.
It crosses the cell, dissipating energy to the surface due to the friction [91]. 22
Figure 2.4 Trajectory of an adatom in MD simulations of Cu/Cu system. Open circles
indicate the adsorption sites. The arrows indicate a long jump (with length of
two unit cells), followed by a single jump (back and forth between two
adjacent adsorption sites) [110]. 24
ix
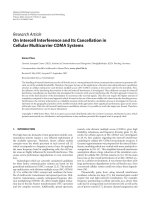
Figure 3.1 Schematics of atomistic model of C
60
/graphene system, which is used for the
present MD simulations of surface diffusion (inset shows the top view of the
model). 44
Figure 4.1 Trajectories of C
60
molecule on graphene surface at (a) ultra-low temperature
regime. Single jump motion at 5 K turns to multiple (long) jump motion with
increasing the temperature. (b) Low temperature regime, which shows quasi-
continuous Brownian motion (Regime III). (c) High temperature regime,
which exhibits ballistic-like Brownian motion (Regime IV). 50
Figure 4.2 Effect of temperature on the diffusion coefficient and kinetic friction of the
C
60
/graphene system. (a) The Arrhenius analysis of the surface diffusion
coefficient D of the C
60
indicates the existence of two diffusive regimes with
a crossover around 75 K. The inset of (a) illustrates that the friction
coefficient decreases from 1.3 ps-1 to a value of an order of 0.01 ps-1 when
the temperature is increased from 25 K to 200 K. (b) Mean square
displacement (MSD) of C
60
motion as a function of time at 50 K and 125 K.
Note that at 50 K, the MSD grows linearly with time, consistent with quasi-
continuous Brownian motion. At 150 K, the MSD is initially parabolic for
time shorter than 1/ η, consistent with ballistic-like Brownian motion. 51
Figure 4.3 Conversion between the translational and rotational kinetic energies of C
60
during surface diffusion on the graphene at two different temperatures. The
temperatures are (a) T=50 K, and (b) T=200 K. The inset in (a) shows the
interplay between the translational and rotational energies as a function of
time at T=50 K with a higher resolution. 53
Figure 4.4 The effect of rotational degrees of freedom of C
60
on the potential energy
surface (PES). (a-e) Various configurations are used to examine the PES
profiles. These configurations are named as: (a) Hex In Phase; (b) Hex Out
Phase; (c) Pentagon; (d) Line-In Phase; and (e) Line-Out Phase; (f) Three-
dimensional PES for the Hex In configuration. (g) The contour plot of the
PES in (f). The white arrow in (g) indicates the diffusion path with the lowest
energy barrier. The arrangement of graphene atoms and their bonds is
illustrated in the insets. (h) and (i) show the PES profiles for the C
60
with
different facets as shown in (a-e) during translation along the [100] and [120]
crystallographic directions of graphene, respectively. 55
Figure 5.1 Different regimes of surface diffusion in C
60
/graphene system according to the
effect of temperature and rotational degrees of freedom (DOFs) of the
admolecule. In the case of rotational C
60
(the set of arrows in red), the single
jump (SJ) regime dominates below 25 K. Between 25 K and 75 K, there is a
quasi-continuous Brownian motion (QCBM) regime, which turns into the
ballistic-like Brownian motion above 75 K. On the other hand, in the case of
non-rotational C
60
(the set of arrows in blue), the single jump regime (SJ)
extends up to 50 K, and then turns into Long Jump (LJ) regime above 50 K.
x
The LJ regime extends up to 175 K and finally there is a BLBM regime at
elevated temperature similar to the case of rotational C
60
. 61
Figure 5.2 Typical trajectories of C
60
admolecule on graphene illustrate various surface
diffusion regimes in the system at different conditions: (a) in the present of
rotational DOFs (a1: SJ, a2: QCBM, a3: BLBM), and (b) in the absence of
rotational DOFs (b1: SJ, b2: LJ, b3: BLBM). 63
Figure 5.3 Temporal evolution of the position of C
60
COM, R, in the presence (red curves)
and absence (blue curves) of rotational DOFs at different temperatures: (a)
15 K, (b) 40 K, (c) 100 K, (d) 200 K. (a) At very low temperature of 15 K,
the C
60
molecule exhibits a stick-slip (hopping) pattern of motion (the
sticking intervals separated by jump events) even in the presence of
rotational DOFs. (b) At 40 K, in the absence of rotational DOFs, the C
60
admolecule still moves by hopping mechanism (dominated by single jumps).
However, in the case of rotational admolecule, there are no sticking intervals
and the molecule performs Brownian motion (QCBM regime). (c) At 100 K,
the rotational C
60
clearly performs a Brownian motion, where in the absence
of rotational DOFs, it still exhibits stick-slip motion during which very long
jumps (flights) are observable. (d) At 200 K, in the presence and absence of
rotational DOFs, the C
60
molecule does not stick to a certain absorption site
on the surface, and in both cases it performs a free Brownian motion. 65
Figure 5.4 Effects of temperature and rotational DOFs on the diffusivity of the C
60
admolecule on graphene surface. The Arrhenius analysis of surface diffusion
coefficient, D, indicates that in the temperature range of 10 K to 200 K, and
in the presence or absence of rotational DOFs, the system undergoes distinct
regimes of surface diffusion. 67
Figure 5.5 Three dimensional potential energy surface (PES) of the C
60
/graphene system
for the Hex In Phase configuration. (b) The corresponding contour plot of
the PES. The potential energy profile of the path in the [100] crystallographic
direction of graphene (the horizontal red arrow), is plotted on the top inset;
while the potential energy profile of the path in the [120] crystallographic
direction of graphene (the vertical blue arrow), is plotted on the right inset. 69
Figure 6.1 Trajectories of C
60
molecule on graphene surface. (a) Single jump motion at 5
K turns to multiple (long) jump motion with increasing the temperature. (b)
Brownian motion of the admolecule resembles high friction (high viscosity)
BM below 75 K (QCBM regime), and (c) low friction (low viscosity) BM
above 75 K (BLBM regime). 77
Figure 6.2 Brownian and hopping (stick-slip) surface diffusion. Temporal evolution of
positional distance of the C
60
center of mass from the origin, R, illustrates
that at very low temperature of 15 K, the C
60
molecule exhibits a stick-slip
(hopping) pattern of motion (inset: higher spatial resolution of R at 15 K).
xi
In contrast, at elevated temperatures, the particle is highly mobile and
exhibits a continuous BM. 78
Figure 6.3 Evaluating the temperature effect on the dynamics of surface diffusion and
kinetic nanofriction in C
60
/graphene system. (a) The Arrhenius analysis of
surface diffusion coefficient, D, indicates that in the temperature range of 25
K to 200 K, the C
60
admolecule exhibits two distinct regimes of Brownian
motion with a crossover at about 75 K. The inset of (a) shows the kinetic
nanofriction coefficient, η, calculated from D and velocity autocorrelation
function (VACF), Φ, at different temperatures. (b) Normalized Φ
Norm
exponentially decays with time. The characteristic time τ
p
= 1/ η (according
to the Equation (6.8)) is extracted at different temperatures. 79
Figure 7.1 Diagram of diffusive behaviors of a C
60
admolecule on hydrogenated graphene.
Temperature and hydrogenation coverage alter the diffusive behavior of the
C
60
admolecule, leading to normal diffusion, subdiffusion and superdiffusion.
These regimes are defined based on the MSD behavior of the C
60
admolecule
in a one-nanosecond time window. 89
Figure 7.2 The trajectories (a) and MSD curves (b) of the C
60
admolecule on three
different substrates at the same temperature of 200 K. (1) superdiffusion on
graphene, (2) normal diffusion on graphane, and (3) subdiffusion on partially
hydrogenated graphene (50%). The logarithmic analysis of MSDs (according
to Eq. (7.2)) yields the value of α, which is 1.6 in (b1), 1 in (b2) and 0.3 in
(b3), corresponding to the superdiffusion, normal diffusion and subdiffusion,
respectively. 92
Figure 7.3 Atomic configuration of the substrates (a) and potential energy surfaces (b) of
three different systems: C
60
molecule on (1) graphene, (2) graphane, and (3)
partially (15%) functionalized graphene. 93
Figure 7.4 (a) Effect of hydrogenation coverage on the diffusion coefficient of C
60
admolecule at three different temperatures. The drastic change in C
60
mobility with the change of hydrogen coverage signifies the ultrasensitive
behavior of the C
60
motion. (b) and (c) show the comparison of the
normalized diffusivities obtained from the MD simulations (scattered points),
and those from our proposed model (continuous lines) at very low (< 5%)
and very high (> 95%) hydrogen coverages, respectively. The normalizations
of diffusion coefficients in (b) and (c) are based on the diffusivities of C
60
on
pure graphene and graphane, respectively, at the corresponding temperatures.
97
Figure 8.1 Confined Brownian motion of C
60
on a GNR at 100 K. The width of the GNR
is 50 Å. The edges confine the admolecule motion. 105
Figure 8.2 (a) Schematic illustration of fabricating the graphane/graphene composite
sheet and subsequent fluorescence quenching microscopy (FQM) imaging
xii
[244].(b) Our MD simulation at 100 K reveals the confined Brownian motion
of a C
60
admolecule (red trajectory) on the 20 Å width graphene ―nanoroad‖
confined between graphane domains in a graphane-graphene-graphane
composite sheet (green and white circles represent carbon and hydrogen
atoms, respectively). The PBC is applied on the simulation box. It can be
seen that the edges of the ―nanoroad‖ adsorb the C
60
admolecule. 106
Figure 8.3 Distance between the centers of masses of two C
60
molecules, which form a
stable C
60
-dimer, at different temperatures during their surface diffusion on
graphene. Even at room temperature (300 K) the C
60
-dimer is stable and the
average distance between molecules is 9.6 Å. Higher temperatures lead to
dissociation of the dimer. 107
xiii
List of Symbols
α Diffusion exponent
Γ Effective jump frequency
Γ
0
Effective jump frequency prefactor
γ Stokes coefficient
Δ Dissipation parameter
(δN)
2
Square fluctuation of the number of adsorbed particles
η Kinetic nanofriction coefficient
θ Coverage of adsorbates on the surface
μ Chemical potential
ν
osc
Vibrational frequency of the adsorbate
ξ Stochastic force
ρ Adsorbate concentration
τ
p
Momentum relaxation time of the Brownian particle
<
>
hom
Average dwelling time at the bottom of the energy well of a homogeneous
system
<
>
het
Average dwelling time at the bottom of the energy well of a heterogeneous
system
Φ Velocity autocorrelation function
Φ
Norm
Normalized velocity autocorrelation function
A Surface area
a Lattice parameter
c
t
, c
b
, c
H
Concentration of energy traps, energy barriers and hydrogen atoms,
respectively
xiv
D
*
, D
Tracer surface diffusion coefficient
D
c
Collective surface diffusion coefficient
D
hom
Tracer Diffusion coefficient of a homogeneous system
D
hett
Tracer Diffusion coefficient of a heterogeneous system containing traps
D
hetb
Tracer Diffusion coefficient of a heterogeneous system containing barriers
D
Norm
Normalized tracer diffusion coefficient of a heterogeneous system
d Spatial dimensionality of the system
E
0
Initial total energy of the adsorbate
E
a
Diffusion activation energy
F Deposition flux
F
fric
Friction force
F
i
Force vector acting on the ith particle
f jump correlation factor
J Flux of the adsorbates
k
B
Boltzmann constant
2
l
Mean square jump length
m Mass
N Number of particles
n(t) Number of jumps at a given time
P(r, v, t) Phase-space probability distribution
p
b
Distribution density of the barriers
p
t
Distribution density of the traps
r Position vector
r
i
(t) Position vector of the ith particle at time t
xv
<R(t)> Mean displacement at a time t
<R
2
(t)> Mean square displacement at time t
t Time
T Temperature
v Velocity
v Velocity vector
U(r
1
,…, r
N
) Potential energy function
V(x), V(r) One and two dimensional potential energy surface, respectively
xvi
List of Abbreviations
1D, 2D, 3D One, two and three dimensional, respectively
AFM Atomic force microscopy
AIREBO Adaptive Intermolecular Reactive Empirical Bond Order
BLBM Ballistic-like Brownian motion
BM Brownian motion
CG Conjugate gradient
CNT Carbon nanotube
COM Center of mass
DFT Density functional theory
DOFs Degrees of freedom
EBL Electron beam lithography
FDT Fluctuation dissipation theorem
FEM Field emission microscopy
FFM Friction force microscopy
FIM Field ion microscopy
FPE Fokker-Planck equation
FQM Fluorescence quenching microscopy
GNR Graphene nanoribbon
HAS Helium atom scattering
LAMMPS Large−scale Atomic/Molecular Massively Parallel Simulator
LE Langevin equation
LITD Laser induced thermal desorption
LJ Long jump
xvii
LOD Linear optical diffraction
MC Monte Carlo
MD Molecular dynamics
MSD Mean square displacement
NEMS Nanoelectromechanical systems
NR-C
60
Non-Rotational C
60
PEEM Photoemission electron microscopy
PSE Potential energy surface
QCBM Quasi continuous Brownian motion
QCM Quartz crystal microbalance
QHAS Quasi-elastic helium atom scattering
R-C
60
Rotational C
60
SE Stokes-Einstein (relation)
SCPM Scanning contact potential microscopy
SJ Single jump
STM Scanning tunneling microscopy
TST Transition state theory
vdW van der Waals
Chapter 1: Introduction
1
1 1BIntroduction
The idea of manipulating matter at the atomic scale was inspired by Richard Feynman’s
1959 visionary lecture ―There’s plenty of room at the bottom‖ [1, 2]. He predicted the
rise of a new era of science and technology that can change people’s lives by molecular
machinery, denser computer circuits, compact data and energy storage, and nanoscale
medical technology. Over the several decades since then, scientists have been trying to
miniaturize devices at the atomic and molecular scales (0.1-100 nm). Invention of
scanning tunneling microscopy (STM) [3] and atomic force microscopy (AFM) [4, 5]
made it possible to observe and manipulate single atoms. Discovery and synthesis of
buckyballs [6-8], carbon nanotubes (CNTs) [9-11], graphene [12-17], and quantum dots
[18, 19] have provided opportunities to design nanodevices with diverse and
extraordinary functionalities. Moreover, the quest for nanoscale devices which can
resemble macroscale machinery has stimulated development of a variety of
nanoelectromechanical systems (NEMS) [20, 21], such as nanobearings [22, 23],
nanogears [24], and nanomotors [25, 26].
Currently, the most popular fabrication method in microelectronics is ―top-down‖ in
which the process is basically started with a bulk substance, and then the bulk is
modified into smaller structures using chemical, mechanical, optical, or other forms of
energy [27]. In nanotechnology, the top-down approach is realized by using electron
beam lithography (EBL), writing and stamping [28]. However, the top-down techniques
are close to their limits of scaling, and extensive effort and investment are needed to
upgrade existing equipment. Moreover, as device features become smaller than 100 nm,
Chapter 1: Introduction
2
application of conventional techniques and materials, e.g. silicon, faces fundamental
problems such as a large spread in device characteristics owing to device size fluctuations
[29, 30]. Therefore, development of alternative fabrication methods based on a ―bottom-
up‖ approach is crucial to address ever-increasing demands for miniaturization of devices
[29, 31, 32]. In contrast to the top-down approach, in which the structure is imposed, in
the bottom-up approach, a complex structure is synthesized on the surface from atoms or
molecules (building-blocks) which assemble themselves by covalent bonds, or by
molecular recognition, i.e. bonding through non-covalent interactions such as van der
Waals forces [33-35] (see Figure 1.1). As an important advantage of the bottom-up
approach, at least one critical dimension of the device can be defined and controlled
during the synthesis process with near-atomic-scale precision [29]. This precise control
goes beyond that is achievable in the top-down approach, and represents a key feature
motivating these efforts.
In the bottom-up approach, the building-blocks are deposited on a surface (substrate)
at finite temperatures, and the self-assembled nanostructures evolve as a result of
spontaneous growth processes [36]. This approach provides an efficient and versatile tool
for mass production of nanostructures [37, 38]. In research-scale production, building-
blocks can be manipulated to synthesize nanostructures by pushing and pulling them
using external driving forces (by employing an AFM or STM tip) [39]. Consequently, a
comprehensive understanding of elementary phenomena governing self-assembly and
mobility of nanoscale building-blocks on surfaces is necessary to design efficient bottom-
up techniques.
Chapter 1: Introduction
3
Figure 1.1 Two main approaches of controlling matter and fabricating structures at the
nanoscale. In top-down techniques, several methods like lithography, writing, or
stamping are employed to form the desirable features from the bulk. Bottom-up
approaches rely on self-processes to order atoms and molecules to form the structures.
The insets from top left in the clockwise order show a Scanning Electron Microscopy
(SEM) of a nanomechanical device fabricated by electron beam lithography (EBL),
structured thin film of CNTs, a single CNT connecting two electrodes, a nanoporous
metal-organic network consisting of functional molecules and iron atoms, and the letter
―C‖ obtained by manipulating and positioning 7 carbon monoxide (CO) molecules using
STM tip [27].
1.1 10BSurface diffusion controls the self-assembly and growth mechanism
As it is described in the previous section, in the bottom-up approach, the building-blocks
are deposited on a surface (substrate) at finite temperatures, and the self-assembled
nanostructures evolve as a result of spontaneous growth processes [36]. During self-
assembly and growth, adsorbed building-blocks (adsorbates) move randomly on the
surface, due to thermal fluctuations of the substrate atoms. They may be frequently either
trapped on the sites (potential wells, or adsorption sites) which offer them strong binding,
Chapter 1: Introduction
4
or may acquire enough thermal energy and escape from these sites. This process is called
surface diffusion, which is conventionally known as a thermally activated mechanism: the
adsorbate overcomes the energy barriers by the means of thermal energy [37]. The
diffusion rate is the measure of mobility of the adsorbate, and is commonly quantified by
the surface diffusion coefficient, D, defined as the mean square distance travelled by the
adsorbate per unit of time [40]. The temperature dependence of D is conventionally
described by an Arrhenius law.
The growth mechanism is governed by the energetics and dynamics of the system
where the competition between thermodynamics and kinetics may lead to formation of
equilibrium or non-equilibrium structures, respectively [41]. If the adsorbates are
deposited on the substrate with a given flux, F, then D/F (the ratio of surface diffusion
coefficient to deposition rate) is a measure of the average distance that an individual
adsorbate can travel on the surface before it meets another adsorbate, either to form a new
nucleus or to attach to an existing aggregate [27]. Therefore, the growth mechanism and
the final self-assembled structure can be predicted based on the ratio D/F [42, 43]. If
surface diffusion of adsorbates is fast compared to their incident flux (large values of
D/F), the adsorbates have sufficient time to explore the surface and find the most
energetically favorable (equilibrium) configuration. Hence, many aspects of the system
can be explained and predicted by employing energetic principles and equilibrium laws
of thermodynamics (i.e. the process is thermodynamically controlled [41, 44, 45]). In
contrast, if the diffusion rate (adsorbate mobility) is limited (D/F is small), the adsorbates
do not have the much chance to assemble in an equilibrium manner. This process is
controlled by kinetic effects and results in a non-equilibrium structure. To explore and
Chapter 1: Introduction
5
describe such a process, analysis of only the energetics is not sufficient, and dynamical
models such as Monte Carlo (MC) or kinetic MC simulations are required [41, 46-48].
Figure 1.2 illustrates the thermodynamically and kinetically controlled growth scenarios
determined by the D/F ratio. Therefore, a solid understanding of surface diffusion process
is important in all bottom-up approaches since it is a key to control the self-assembly of
nanostructures.
Figure 1.2 Growth processes on a surface at the atomic-scale. The atoms or molecules
(building-blocks) are deposited (with flux F) on the surface from a vapor phase or an
incident beam. The adsorbed building-blocks (adsorbates) diffuse on the surface (with
rate D) until they meet other adsorbates and form new aggregation nuclei, or attach to
other pre-formed islands. The type of growth is strongly dependent on the D/F ratio.
Metallic islands (micrographs on the left-hand side) are controlled by growth kinetics
(small D/F values). The super-molecular self-assembly (the micrograph on the right) is
based on molecular recognition at equilibrium conditions (large D/F values).
Semiconductor nanostructures (the micrographs in the centre) are usually grown at
intermediate D/F, and hence the complex interplay between kinetics and thermodynamics
determines their morphology [27].
Chapter 1: Introduction
6
1.2 11BSurface diffusion and friction of nanoscale objects
1.2.1 42BNanofriction
As it was described above, the basic building-blocks in bottom-up approaches can be
manipulated by driving forces to pull, push or slide them on a substrate [49]. The applied
driving force must be adjusted to overcome the friction between the adsorbate and the
substrate. However, quantification of friction between the building blocks and the
substrate at the atomic scale is a challenging issue for both experimentalists and
theoreticians [50].
It is common at all length scales that friction dissipates the kinetic energy of moving
objects into the surrounding/contact media in the form of thermal energy [51]. At the
macroscopic level, friction and lubrication are well-explored phenomena, and various
empirical laws have been proposed to describe the frictional behavior of surfaces with
different characteristics and chemistries [52]. However, the macroscopic rules of friction
such as Amonton’s law are not generally applicable to nanosystems [53] due to the
significant role of atomic interactions and thermal fluctuations at the nanoscale contacts
[51]. Experimental studies of tribological properties of a variety of materials support that
adhesion and friction at the nanoscale are strongly system- and size-dependent [54].
A widely used experiment to measure nanofriction is performed by sliding a conical
AFM tip on the top of a surface, and measuring the bending torsion of the cantilever
induced by the surface frictional forces [55]. Such experiment is known as Friction Force
Microscopy (FFM), in which the contact is between the tip apex (with a nominal size of a
few nanometers) and the surface. However, the measurements may be significantly
affected by the material, size, and shape of the tip [54, 56-58]. Moreover, during the