In vitro and in vivo studies into the antidiabetic and antilipidemic effects of chlorogenic acid
Bạn đang xem bản rút gọn của tài liệu. Xem và tải ngay bản đầy đủ của tài liệu tại đây (4.78 MB, 190 trang )
I
IN VITRO AND IN VIVO STUDIES ON THE ANTIDIABETIC AND
ANTILIPIDEMIC EFFECTS OF CHLOROGENIC ACID
ONG KHANG WEI
NATIONAL UNIVERSITY OF SINGAPORE
2013
II
IN VITRO AND IN VIVO STUDIES ON THE ANTIDIABETIC AND
ANTILIPIDEMIC EFFECTS OF CHLOROGENIC ACID
ONG KHANG WEI
[BSc. Biomedical Science (Hons.)]
A THESIS SUBMITTED FOR THE DEGREE OF DOCTOR OF
PHILOSOPHY OF MEDICAL SCIENCE
DEPARTMENT OF PHARMACOLOGY
NATIONAL UNIVERSITY OF SINGAPORE
2013
III
DECLARATION
I hereby declare that this thesis is my original work and it has been written by me in its
entirety. I have duly acknowledged all the sources of information which have been used in the
thesis.
This thesis has also not been submitted for any degree in any university previously.
(ONG KHANG WEI)
07 Jan 2013
IV
ACKNOWLEDGEMENTS
I would like to express my sincere and greatest gratitude to Associate Professor
Benny Tan Kwong Huat. He has been a great and fantastic mentor who has always
guided me throughout my whole study. Without his guidance, I would not be able to
come out with this wonderful topic of study and complete the journey of research for
my PhD degree. I am greatly inspired by his dedication to academic and research
works. He has always been extraordinarily good in managing both academic and
research tasks which has in turn motivated me in equally handling my academic and
research assignments. As a supervisor, he shared his experiences and interesting
stories in his previous and current research lives. I would also like to take this
opportunity to thank him for his patience and words of encouragement when I was
once at the bottleneck of my study.
Next, I would like to thank Ms. Annie Hsu, our outstanding laboratory technician, for
her guidance and assistance throughout my study. As a mentor, her invaluable
experience in conducting experiments has tremendously facilitated the whole process
of my study. As a friend, she shared with me her life experience and gave me advices
when I was puzzled and stranded in predicament. Her positive attitude has helped me
sailed through every single unpleasant and undesirable moment.
I am greatly indebted to Associate Professor Huang DeJian and Ms. Song LiXia from
Department of Chemistry for their enormous assistance and support in aiding me to
identify and characterize the chemical composition of our herbal extract. Likewise, I
would like to express my very great appreciation to Mr. K.F. Leong and Mr. Chua
Keng Soon for their help in identifying the herb and specimen deposition in NUS
herbarium.
V
My grateful thanks are also extended to my fellow lab mates who make the life in the
laboratory more interesting and lively. I would like to offer my special thanks to one
of my lab mates, Ms. Chew Xin Yi for her assistance and guidance in performing the
immunoprecipitation experiments.
I also would like to express sincere appreciation to National University of Singapore
for supporting my full-time PhD research with scholarship.
Finally, I wish to thank my parents and family for their support and encouragement
throughout my study.
I
Contents
LIST OF PUBLICATIONS……………………………………………………………i
LIST OF ABBREVIATIONS……………………………………………………… ii
LIST OF FIGURES………………………………………………………………… iv
LIST OF TABLES……………………………………………………………………vi
LIST OF APPENDICES……………………………………………………… vii
SUMMARY…………………………………………………………………………viii
1 Chapter 1: Introduction 1
1.1 Diabetes Mellitus 1
1.2 Classification of Diabetes Mellitus 2
1.3 Normal Glucose Homeostasis 4
1.4 Insulin signaling vs AMPK-dependent pathway 7
1.5 Pathogenesis of T2DM 8
1.5.1 β-cell Dysfunction 8
1.5.2 Insulin Resistance 9
1.5.3 Fasting Hyperglycemia vs Postprandial Hyperglycemia 10
1.6 Management of T2DM 11
1.7 Vernonia amygdalina and diabetes 12
1.8 Coffee and diabetes 18
1.9 CGA and diabetes 18
1.10 Objectives and Design of Study 23
1.10.1 Objectives of study 23
1.10.2 Research design 24
2 Chapter 2: Materials and Methods 26
II
2.1 Materials 26
2.2 Studies of antidiabetic effects of VA in STZ-induced diabetic rats 27
2.2.1 Plant materials 27
2.2.2 Preparation of plant extract 27
2.2.3 Experimental animals 28
2.2.4 Ethics statement 28
2.2.5 Induction of diabetes with STZ 28
2.2.6 Dose-response study in STZ-diabetic rats with VA 28
2.2.7 Chronic (28-day) study in STZ-diabetic rats 29
2.2.8 Biochemical analyses 29
2.2.9 Determination of G6Pase activity 30
2.2.10 Determination of muscle glycogen content 30
2.2.11 Fractionation of rat skeletal muscle 30
2.2.12 Immunoblotting to detect GLUT 1 and GLUT 4 31
2.2.13 HPLC analysis 31
2.2.14 LC-ESI-MS analysis 32
2.3 Studies of antidiabetic and antilipidemic effects of CGA 32
2.3.1 Experimental animals 32
2.3.2 Ethic statement 33
2.3.3 Oral glucose tolerance test 33
2.3.4 2-week CGA treatment in Lepr
db/db
mice 33
2.3.5 2DG transport in skeletal muscle isolated from Lepr
db/db
mice 34
2.3.6 Cell culture and differentiation of L6 skeletal muscle 34
2.3.7 Cell culture of HepG2 human hepatoma 35
2.3.8 2DG transport in L6 skeletal muscle cells 35
2.3.9 Myotube subcellular fractionation 36
III
2.3.10 siRNA transfection of myotubes and HepG2 36
2.3.11 Immunoprecipitation and detection of association between IRS-1 and
p85 subunit of PI3K 37
2.3.12 Glucose production assay 38
2.3.13 AMPK activity assay 38
2.3.14 ACC activity assay 39
2.3.15 Fatty acid synthesis assay 39
2.3.16 Fluo-4 direct calcium assay 40
2.3.17 Oil Red O staining 40
2.3.18 Glucose and lipid profiles 40
2.3.19 Hepatic G6Pase activity 41
2.3.20 Fractionation of skeletal muscle 41
2.3.21 2DG transport in skeletal muscles 41
2.3.22 Liver histology or skeletal muscle immunohistochemistry 41
2.3.23 Western blot analysis 42
2.4 Statistical analysis 42
3 Results 43
3.1 Studies of antidiabetic effects of VA in STZ-induced diabetic rats 43
3.1.1 Acute effect of VA extract on fasting blood glucose in STZ-induced
diabetic rats 43
3.1.2 Long-term effects of VA extract on body weight, food and water intakes
of STZ-induced diabetic rats 44
3.1.3 Long-term effects of VA extract on fasting blood glucose, triglyceride
and total cholesterol levels 45
3.1.4 Long-term effects of VA extract on pancreatic and serum insulin levels
48
3.1.5 Long-term effects of VA extract on hepatic G6Pase activity 48
3.1.6 Long-term effects of VA extract on hepatic GSH and antioxidant
enzymes 48
IV
3.1.7 Long-term effects of VA extract on expression of GLUT 1/ GLUT 4 and
cellular distribution of GLUT 4 53
3.1.8 Long-term effects of VA extract on muscle glycogen synthesis 57
3.1.9 Determination of main active constituents in VA extract 58
3.2 Studies of antidiabetic and antilipidemic effects of CGA 59
3.2.1 CGA lowers blood glucose levels in an OGTT on Lepr
db/db
mice 59
3.2.2 2-week treatment with CGA reduces body weight, water intake and
improves glucose and lipid profiles 63
3.2.3 2-week treatment with CGA improves glucose tolerance and insulin
sensitivity in Lepr
db/db
mice 69
3.2.4 CGA inhibits gluconeogenesis in Lepr
db/db
mice through downregulation
of gluconeogenic G6Pase 74
3.2.5 Suppression of glucose production and G6Pase expression in HepG2
hepatoma by CGA 78
3.2.6 CGA ameliorates hepatic lipid accumulation, triglyceride and total
cholesterol levels in Lepr
db/db
mice 78
3.2.7 CGA decreases oil droplets formation in HepG2 Cells 84
3.2.8 Amelioration of hepatic lipid accumulation by CGA is mediated through
inhibition of fatty acid synthesis 84
3.2.9 Acute stimulation of glucose uptake by CGA in skeletal muscle isolated
from Lepr
db/db
mice 87
3.2.10 Chronic treatment with CGA increases glucose uptake in skeletal
muscles by increasing GLUT 4 expression and translocation to plasma membrane
88
3.2.11 Dose- and time-dependent stimulation of glucose transport by CGA in
L6 myotubes 96
3.2.12 CGA stimulates GLUT 4 translocation to plasma membrane in L6
myotubes 98
3.3 Studies of molecular pathways that mediate beneficial metabolic effects of
CGA 101
3.3.1 CGA increases AMPK and ACC phosphorylations in response to Ca
2+
influx in HepG2 hepatoma cells 101
V
3.3.2 Chronic treatment with CGA increases phosphorylations of AMPK and
ACC and expression of CAMKKβ in liver and skeletal muscles of Lepr
db/db
mice
107
3.3.3 Inhibition and knockdown of AMPK abolished CGA-inhibited
gluconeogenesis and fatty acid synthesis in HepG2 cells 110
3.3.4 CGA stimulates phosphorylations of AMPK and ACC in L6 myotubes
110
3.3.5 Compound c diminishes glucose transport stimulated by CGA in L6
myotubes 116
3.3.6 AMPK is necessary for the glucose transport stimulation by CGA in L6
myotubes 119
3.3.7 CGA does not induce association of p85 subunit of PI3K to IRS-1 in L6
myotubes 121
3.3.8 Effect of CGA on L6 myotubes viability and proliferation 121
4 Discussion 125
4.1 Studies on the antidiabetic effects of VA 126
4.2 Studies on the antidiabetic effects of CGA 130
4.3 Studies of antilipidemic effects of CGA 133
4.4 Studies of molecular targets that mediate beneficial metabolic changes by
CGA 134
4.5 Possible cytotoxic effect of CGA 137
4.6 VA vs CGA vs Met 138
5 Conclusions and Future Perspectives 140
6 References 142
7 List of Appendices 168
i
LIST OF PUBLICATIONS
Journals
Ong KW, Hsu A, Tan BKH (2012) Chlorogenic acid stimulates glucose transport in
skeletal muscle via AMPK activation: A contributor to the beneficial effects of coffee
on diabetes. PLoS ONE 7.
Ong KW, Hsu A, Song L, Huang D, Tan BKH (2011) Polyphenols-rich Vernonia
amygdalina shows anti-diabetic effects in streptozotocin-induced diabetic rats.
Journal of Ethnopharmacology 133: 598-607.
Ong KW, Hsu A, Tan BKH (2013) Antidiabetic and antilipidemic effects of
chlorogenic acid are mediated by AMPK activation. Biochemical Pharmocology 85:
1341-1351.
Book Chapter
Tan BKH, Ong KW (2013) Influence of dietary polyphenols on carbohydrate
metabolism; Watson RR, Preedy VR, Zibadi S, editors. US: Elsevier.
ii
LIST OF ABBREVIATIONS
2DG 2-deoxyglucose
A1C Glycated hemoglobin
ACC Acetyl-CoA carboxylase
AICAR 5-amino-1-β-D-ribofuranosyl-imidazole-4-carboxamide
AMPK AMP-activated protein kinase
AS160 Akt substrate of 160 kDa
AUC Area under the curve
CAMKK Calcium/calmodulin-dependent protein kinase kinase
CAP Cbl-associated protein
CGA Chlorogenic acid
CGI Complete glucose intolerance
CQA Caffeoylquinic acid
DC Diabetic control
di-CQA Dicaffeoylquinic acid
DM Diabetes mellitus
DPP-4 Dipeptidyl peptidase-4
FBS Fasting blood sugar
FFA Free fatty acids
G6P Glucose-6-phosphate
G6Pase Glucose-6-phosphatase
GIP Gastric inhibitory polypeptide
GLP Glucagon-like peptide-1
GLUT 1 Glucose transporter 1
GLUT 4 Glucose transporter 4
GOT Glutamic oxaloacetic transaminase
GPT Glutamic pyruvic transaminase
iii
GPx Glutathione peroxidase
GSH Glutathione
HOMA
IR
Homeostatic model assessment index of insulin resistance
HRP Horse radish peroxidase
IAAs Insulin autoantibodies
IAPP Human islet amyloid polypeptide
ICAs Islet cell autoantibodies
IFG Impaired fasting glucose
IGT Impaired glucose tolerance
IKK IκB kinase
IRS Insulin receptor substrate
ITT Insulin tolerance test
KRBB Krebs-Ringer bicarbonate buffer
KRPH HEPES-buffered Krebs-Ringer phosphate
LKB-1 Liver kinase B1
NC Normal control
NF-κB Nuclear factor kappa-light-chain-enhancer of activated B cells
OGTT Oral glucose tolerance test
PEPCK Phosphoenolpyruvate carboxykinase
PI3K Phosphatidylinositol-3-kinase
PKC Protein kinase C
PM Plasma membrane
PPG Postprandial glucose
PTT Pyruvate tolerance test
SDS-PAGE Sodium dodecyl sulfate polyacrylamide gel electrophoresis
SOD Superoxide dismutase
STZ Streptozotocin
T1DM Type 1 diabetes mellitus
T2DM Type 2 diabetes mellitus
iv
TC Total cholesterol
TG Triglyceride
VA Vernonia amygdalina
v
LIST OF FIGURES
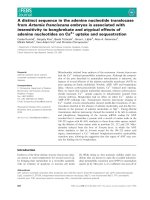
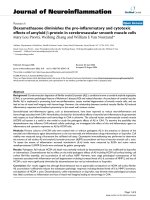
Figure 1.1 Fate of glucose……………………………………………………… 4
Figure 1.2 Vernonia amygdalina……………………………………………… 15
Figure 3.1.1 Acute effects of VA on glucose tolerance in STZ-induced diabetic
rats……………………………………………………………………44
Figure 3.1.2 Chronic effects of VA on fasting blood glucose of STZ-induced
diabetic rats………………………………………………………… 46
Figure 3.1.3 Chronic effects of VA on lipid profile of STZ-induced diabetic
rats……………………………………………………………………47
Figure 3.1.4 Chronic effects of VA on insulin levels of STZ-induced diabetic
rats……………………………………………………………………49
Figure 3.1.5 Chronic effects of VA on hepatic G6Pase levels of STZ-induced
diabetic rats………………………………………………………….50
Figure 3.16 Chronic effects of VA on hepatic antioxidant enzymes and GSH
activities of STZ-induced diabetic rats…… 51
Figure 3.1.7 Chronic effects of VA on skeletal muscle GLUT 4 expression and
translocation of STZ-induced diabetic rats…… 54
Figure 3.1.8 Chronic effects VA on skeletal muscle glycogen levels in STZ-induced
diabetic rats…………………………… 57
Figure 3.1.9 Chemical profile of ethanolic VA extract………………………… 58
Figure 3.2.1 Acute effects of CGA on glucose tolerance in Lepr
db/db
mice……….61
Figure 3.2.2 Decreased inhibitory effect of compound c in suppressing CGA-
mediated glucose lowering after 2-week treatment with CGA………62
Figure 3.2.3 Chronic effects of CGA on glucose and lipid profiles and insulin
sensitivity in Lepr
db/db
mice………………………………………… 64
Figure 3.2.4 Chronic effects of CGA on glucose tolerance and insulin levels in
Lepr
db/db
mice…………………………………………………………71
Figure 3.2.5 CGA decreases glucose production from gluconeogenic pyruvate in a
pyruvate tolerance test on Lepr
db/db
mice…………………………….75
Figure 3.2.6 CGA inhibits expression and activity of hepatic G6Pase in Lepr
db/db
mice………………………………………………………………….76
Figure 3.2.7 CGA suppresses glucose production and expression of G6Pase in
HepG2 hepatoma cells………………………………………… 79
vi
Figure 3.2.8 CGA ameliorates hepatic lipid accumulation in Lepr
db/db
mice…… 82
Figure 3.2.9 CGA lowers hepatic triglyceride and total cholesterol levels……… 83
Figure 3.2.10 CGA decreases oil droplets formation in HepG2 cells………………85
Figure 3.2.11 CGA inhibits fatty acid synthesis in HepG2 cells……………………86
Figure 3.2.12 Acute stimulation of glucose uptake by in skeletal muscles isolated
from Lepr
db/db
mice…………………………………………… 88
Figure 3.2.13 Chronic treatment with CGA increases glucose uptake in skeletal
muscles………………………………………………………… 90
Figure 3.2.14 Chronic CGA treatment increases GLUT 4 expression and
translocation to plasma membrane………………………………… 91
Figure 3.2.15 Dose- and time-dependent stimulation of glucose transport in L6
myotubes by CGA……………………………………………………97
Figure 3.2.16 CGA stimulates GLUT 4 translocation to plasma membrane in
myotubes…………………………………………………………….99
Figure 3.3.1 CGA increases AMPK and ACC phosphorylations in response to Ca
2+
influx in HepG2 hepatocytes…………………………… 102
Figure 3.3.2 Chronic CGA administration phosphorylates AMPK and ACC in liver
and skeletal muscles of Lepr
db/db
mice…………………………… 108
Figure 3.3.3 Inhibition and knockdown of AMPK abolished CGA-inhibited
gluconeogenesis and fatty acid synthesis………………………… 111
Figure 3.3.4 Dose- and time- dependent phosphorylation of AMPK in L6 myotubes
by CGA…………………………………………………………… 113
Figure 3.3.5 CGA increases AMPK activity in L6 myotubes……………………115
Figure 3.3.6 Effects of compound c on CGA-stimulated glucose transport in L6
myotubes……………………………………………………………117
Figure 3.3.7 Effects of gene silencing of AMPK on CGA-stimulated glucose
transport in L6 myotubes……………………………………………120
Figure 3.3.8 CGA phosphorylates Akt in the absence of PI3K in L6
myotubes……………………………………………………………122
Figure 3.3.9 Effect of CGA on cell viability and cell proliferation of L6
myotubes……………………………………………………………123
Figure 4.4 Cross-talk between insulin signalling & insulin-independent pathways
and schematic illustration of possible mechanism(s) of action of CGA
to cause beneficial metabolic outcomes……………………… 138
vii
LIST OF TABLES
Table 1.1 Summary of studies on antidiabetic effects of Vernonia
amygdalina………………… ………………………………………16
Table 1.2 Summary of studies on antidiabetic effects of CGA…………………21
Table 3.1.1 Effect s of 28-day treatment with VA on body weight, food intake and
water intake in STZ-induced diabetic rat…………………………….45
Table 3.1.2 Chemical profile of ethanolic extract of VA…………………………59
Table 3.2.1 Body weights, food and water intakes in Lepr
db/db
mice following 2-
week treatment with CGA or metformin…………………………… 69
viii
SUMMARY
Vernonia amygdalina (VA) is well-known for its medicinal importance and it is used
in Nigeria, Ghana, and South Africa for the treatment of diabetes. A dose-response
study was conducted to determine the optimum dose for the hypoglycemic effect of
VA in streptozotocin (STZ)-induced diabetic rats. The optimum dose (400 mg/kg)
was used throughout the 28-day chronic study. Body weight, food and water intakes
of the rats were monitored daily. Fasting blood serum, pancreas, liver and soleus
muscle were collected for biochemical analyses. Chemical composition of VA was
analysed using high-performance liquid chromatography (HPLC) and liquid
chromatography-electrospray ionization-mass spectrometry (LC-ESI-MS). In an oral
glucose tolerance test, 400 mg/kg VA exhibited a significant improvement in glucose
tolerance of the STZ-induced diabetic rats. 28-day treatment with 400 mg/kg VA
resulted in decrease in fasting blood glucose compared to diabetic control. VA also
caused significant decrease in triglyceride and total cholesterol levels. Furthermore,
VA was found to increase expression of GLUT 4 in rat skeletal muscle. Further tissue
fractionation revealed that it can increase the GLUT 4 translocation to plasma
membrane as well, suggesting that VA may stimulate skeletal muscle’s glucose
uptake. This observation is in line with the restoration in skeletal muscle glycogenesis
of VA-treated group. In addition, VA also suppressed glucose-6-phosphatase
(G6Pase). Hence, VA possesses antihyperglycemic effect, most probably through
increasing GLUT 4 translocation and inhibiting hepatic G6Pase. 1,5-dicaffeoyl-quinic
acid, dicaffeoyl quinic acid, chlorogenic acid and luteolin-7-O-glucoside in the extract
may be the candidates that are responsible for the above-mentioned biological
activities.
ix
Besides VA, coffee also contains high levels of chlorogenic acid (CGA). Regular
consumption of coffee has been associated with a lower risk of Type 2 diabetes
mellitus (T2DM) but these beneficial effects cannot be explained by caffeine.
Moreover, CGA has been shown to delay intestinal glucose absorption and thus
suppressing postprandial glucose levels. On the other hand, improvement in fasting
glucose and insulin cannot be explained by the delay in intestinal glucose absorption.
Therefore, the present author next studied its effect on other metabolic pathways and
likewise its effects after long-term consumption. He investigated the effects of CGA
on glucose tolerance, insulin sensitivity, hepatic gluconeogenesis, lipid metabolism
and skeletal muscle glucose uptake in Lepr
db/db
mice. Hepatoma HepG2 was used to
investigate CGA’s effect on hepatic glucose production and fatty acid synthesis while
L6 myotubes was used to further strengthen our findings in animal skeletal muscles.
Subsequently, he attempted to evaluate whether these effects of CGA are associated
with the activation of AMPK. In Lepr
db/db
mice, acute treatment with CGA lowered
AUC
glucose
in an OGTT.
Chronic administration of CGA inhibited hepatic G6Pase
expression and activity, attenuated hepatic steatosis, improved lipid profiles and
skeletal muscle glucose uptake, which in turn improved fasting glucose level, glucose
tolerance, insulin sensitivity and dyslipidemia in Lepr
db/db
mice. CGA activated
CAMKK and AMPK, leading to subsequent beneficial metabolic outcomes, such as
suppression of hepatic glucose production, fatty acid synthesis and glucose uptake in
skeletal muscles. Inhibition and knockdown of AMPK and CAMKK abrogated these
metabolic alterations. In conclusion, CGA improved glucose and lipid metabolism,
via the CAMKK-dependent activation of AMPK. All these suggest that CGA could
be the main component that contributes to the beneficial effects of VA and coffee and
also the paradoxical effect of coffee in T2DM.
1
1 Chapter 1: Introduction
1.1 Diabetes Mellitus
Diabetes mellitus is a metabolic disorder characterized by hyperglycemia resulting
from defects in insulin secretion, tissues sensitivity to insulin or both. Hyperglycemia
is usually accompanied by symptoms which include polyuria, polydypsia, polyphagia
and at times blurred vision. Chronic hyperglycemia results in complications such as
retinopathy with potential loss of vision, nephropathy which leads to renal failure,
neuropathy and other cardiovascular disorders. There are three criteria to make a
diagnosis of diabetes, which are elevated fasting blood glucose, abnormal oral glucose
tolerance test and symptoms of diabetes with hyperglycemia (Appendix 1).
Previously, the use of glycated-hemoglobin (A1C) for the diagnosis of diabetes was
not recommended due the lack of uniformity in the assays worldwide [1]. However,
A1C assays are now highly standardized so their results now can be uniformly applied
both temporally and across populations [2]. The A1C value of ≥6.5% is used as a
diagnostic threshold. However, the diagnostic test should be performed using a
method that is certified by the National Glycohemoglobin Standardization Program
(NGSP) and standardized or traceable to the Diabetes Control and Complications
Trial reference assay.
In 2000, the estimated prevalence of diabetes among adults was 2.8% or 171 million
people and it is expected to increase to 4.4% or 366 million people by the year of
2030 [3] (Appendix 2). This growing burden of diabetes will lead to global financial
2
burden and also indirect cost to society, which is the health status of human
population.
1.2 Classification of Diabetes Mellitus
Diabetes can be categorized into two major categories known as Type 1 diabetes
mellitus (T1DM) and T2DM. T1DM is often genetically-associated and immune-
mediated. Individuals with T1DM have an absolute deficiency in insulin secretion and
can be identified by serological evidence of autoimmune-mediated destruction of
pancreatic islets or by genetic markers. However, this form of diabetes only accounts
for 5-10% of those with diabetes. Also known as juvenile-onset diabetes, the rate of
β-cells destruction in this form of diabetes is usually rapid in infants and children.
However, it can occur at any age, even as late as eighties or nineties in life. Markers
responsible for this destruction include islet cell autoantibodies (ICAs), insulin
autoantibodies (IAAs), glutamic acid decarboxylase autoantibodies (GAD
65
), and
autoantibodies to tyrosine phosphatase IA-2 and IA-2α [4-7]. One and more of these
autoantibodies are present in 85-90% of individuals when fasting hyperglycemia is
initially detected. There is another form of T1DM where the pathogenicity is less well
understood and hence known as idiopathic diabetes. Individuals in this category
usually have permanent insulinopenia but lack signs of autoimmunity. This form of
diabetes is strongly inherited. Hormone replacement therapy is not absolutely
necessary for survival in this case as the degree of β-cell dysfunction varies among
individuals [8].
The most common type of diabetes, T2DM, accounts for 90-95% of those with
diabetes. Individuals in this category can either have predominant insulin resistance
with relative insulin deficiency or predominant insulin secretory defect with insulin
3
resistance. The etiology of this form of diabetes is wide and complicated, ranging
from abnormalities in lipoprotein metabolism, central or visceral obesity, to
cardiovascular risk factors such as hypertension. However, pancreatic islets
destruction does not occur in T2DM. On the contrary, insulin resistance may cause
patient to have normal or even higher level of insulin. This form of diabetes is always
associated with obesity. It’s becoming more common in developed and developing
countries, afflicting younger generations victimized by a global epidemic of
overweight and obesity [9].
There is another type of diabetes diagnosed during pregnancy named gestational
diabetes. Most of the cases resolve with delivery, but the condition may persist in
some cases as unrecognized glucose intolerance may have begun before the
pregnancy. Evaluation of gestational diabetes should be done early in the pregnancy
except for those in low risk group, who
Are less than 25 years old
Have a normal BMI
Have no family history of diabetes
Have no history of abnormal glucose metabolism
Have no history of poor obstetric outcome
Are not members of an ethnic/racial group with a high prevalence of diabetes
such as Hispanic Americanw, Native Americans, African-Americans, and
Pacific Islanders
4
Study has shown that gestational diabetes was associated with poor maternal and fetal
outcomes [10].
1.3 Normal Glucose Homeostasis
Plasma glucose is maintained at a rather consistent value of approximately 90 mg/dl
(5 mmol/l), with a maximal increase of not exceeding 165 mg/dl (9.2 mmol/l) after a
meal [11] or a decrease down to not lower than 55 mg/dl (3.1 mmol/l) after exercise
[12] or a moderate 60-hour fast [13]. Glucose can be from dietary source or is either
from the gluconeogenesis in liver and kidney or the breakdown of glycogen
(glycogenolysis) in liver. This glucose may be stored directly as glycogen through the
process of glycogenesis in liver or may undergo glycolysis, which can be non-
oxidative, producing pyruvate or oxidative, through oxidization of acetyl CoA to
carbon dioxide and water in the tricarboxylic acid cycle or commonly known as Krebs
cycle (Figure 1.1).
Figure 1.1 Fate of Glucose
5
They are several key regulators that regulate glucose homeostasis:
I. Insulin
This major regulator affects glucose metabolism both directly and indirectly.
Its receptors are available in insulin-sensitive organs such as liver, kidney,
muscle and adipose tissue. Activation of insulin signaling upon binding of
insulin to insulin receptors causes suppression of gluconeogenesis in liver and
kidney [14], translocation of glucose transporter-4 (GLUT 4) from inner
membranes to plasma membrane in liver, muscles and adipose tissue to
increase glucose uptake [15], and inhibition of free fatty acid release into
circulation [16]. As free fatty acid stimulates gluconeogenesis and reduce
glucose transport into cells, release of insulin also indirectly regulates
gluconeogenesis and glucose transport through free fatty acids. Besides,
insulin promotes glycogen synthesis by inhibiting glucose-6-phosphatase
(G6Pase) and glycogen phosphorylase while stimulating glycogen synthase
[17]. Increased plasma glucose results in increase in plasma insulin while
decrease in plasma glucose causes reduction in plasma insulin level as well.
II. Glucagon
Unlike insulin secreted from pancreatic β cells, glucagon is secreted from α-
cells of the pancreas. Glucagon secretion is stimulated by hypoglycemia
whereas hyperglycemia will inhibit its secretion. Glucagon acts exclusively on
liver by activating glycogen phosphorylase and results in immediate glucose
release [18]. Further action of glucagon will be through stimulation of
gluconeogenesis [19].
6
III. Catecholamines
Catecholamines are molecules that act as both hormone, in blood circulation
and neuromodulator, in central nervous system. During stress and
hypoglycemia catechoamines are released and they inhibit insulin secretion
and action. In the liver, through β2-adrenergic receptors, they activate
glycogen phosphorylase and augment gluconegenesis [20]. In the kidney, they
are potent stimulators of gluconegenesis. In skeletal muscle, they reduce
glucose uptake and stimulate glycogenolysis. They also activate lipase and
result in lypolysis in adipose tissue to increase release of free fatty acid [21].
IV. Growth Hormone and Cortisol
Both metabolic actions of growth hormone and cortisol are antagonistic to
those of insulin. These include increase secretion of gluconeogenic enzymes,
reduce glucose transport and inhibit lipolysis [22, 23]. In addition, cortisol also
impairs insulin secretion and therefore further debilitating insulin signaling.
V. Free Fatty Acids
As mentioned before, increased plasma free fatty acids will result in
stimulation of renal and hepatic gluconeogenesis, inhibition of glucose
transport in muscles and adipose tissue and competition with glucose as
metabolic fuel [24].
VI. Incretins
Incretins are hormones secreted by intestine in response to nutrients ingestion.
Their main effect is to stimulate pancreas to release insulin after meals intake.