Simulation hierarchical structure of human visual cortex for image classification
Bạn đang xem bản rút gọn của tài liệu. Xem và tải ngay bản đầy đủ của tài liệu tại đây (8.59 MB, 200 trang )
SIMULATING HIERARCHICAL STRUCTURE
OF HUMAN VISUAL CORTEX FOR
IMAGE CLASSIFICATION
SEPEHR JALALI
A THESIS SUBMITTED FOR THE DEGREE OF
DOCTOR OF PHILOSOPHY
DEPARTMENT OF ELECTRICAL AND
COMPUTER ENGINEERING
NATIONAL UNIVERSITY OF SINGAPORE
2013
Declaration
I hereby declare that this thesis is my original work and it
has been written by me in its entirety. I have duly acknowl-
edged all the sources of information which have been used in
this thesis. This thesis has also not been submitted for any
degree in any university previously.
Sepehr Jalali
31 May 2013
2
Acknowledgement
I would like to express my deepest gratitudes to my supervisors: Dr Lim
Joo Hwee, Prof. Ong Sim Heng and Dr Tham Jo Yew who have led me
into this wonderful field. Without their guidance, inspirations, support and
encouragement, this research project would not have been possible. I also
express my appreciation to Dr Cheston Tan for great guidance, discussions
and collaborations.
Gratitudes are also due to Prof. Daniel Raccoceanu, Dr Paul Seekings
and Dr Elizabeth Taylor for their support. I would also like to express my
gratitude to Prof. Cheong Loong Fah, Dr. Yeo Chuo Hao, Prof. Chong
Tow Chong, Dr Shi Lu Ping and Dr Kiruthika Ramanathan, Prof. Tomaso
Poggio, Prof. Thomas Serre, Jim Mutch, Dr Christian Theriault and Jun
Zhang for discussions and collaborations. I would also like to convey thanks
to the A*STAR Graduate Academy (A*GA) for providing the scholarship,
tuition fees and conference trip expenses; A*STAR’s Institute for Info-
comm Research (I
2
R) for computational resources and support; and Image
and Pervasive Access Lab (IPAL) for providing the financial support, and
special thanks also to all my friends who have always been there.
Last but not least, I express my love and gratitude to my beloved family
for their support, understanding and endless love, throughout the duration
of my studies. I dedicate this thesis to my beloved family for their endless
and unwavering love throughout my life.
3
Contents
List of Tables II
List of Figures VII
1 Introduction 1
1.1 Background and Motivations . . . . . . . . . . . . . . . . . . 1
1.2 Human Visual Cortex . . . . . . . . . . . . . . . . . . . . . . 2
1.3 HMAX Biologically Inspired Model . . . . . . . . . . . . . . 6
1.4 Scope, Contributions and Organization of Thesis . . . . . . . 7
2 A Review of Related Models in Image Classification 12
2.1 Overview . . . . . . . . . . . . . . . . . . . . . . . . . . . . . 14
2.2 Related Models . . . . . . . . . . . . . . . . . . . . . . . . . 14
2.2.1 Dynamic Routing Model . . . . . . . . . . . . . . . 15
2.2.2 Top Down Hierarchy of Features . . . . . . . . . . . . 15
2.2.3 Interactive Activation and Competition Network . . . 17
2.2.4 Deep Belief Networks . . . . . . . . . . . . . . . . . . 18
2.2.5 Bag of Features . . . . . . . . . . . . . . . . . . . . . 20
2.3 Simple-Complex Cells Hierarchical Models . . . . . . . . . . 21
i
2.3.1 Hierarchical Temporal Memory . . . . . . . . . . . . 22
2.3.2 LeNet . . . . . . . . . . . . . . . . . . . . . . . . . . 24
2.3.3 Neocognitron . . . . . . . . . . . . . . . . . . . . . . 24
2.3.4 Hierarchical Statistical Learning . . . . . . . . . . . . 25
2.3.5 HMAX Model . . . . . . . . . . . . . . . . . . . . . . 26
2.4 Comparisons and Discussions . . . . . . . . . . . . . . . . . 27
3 The HMAX Model and its Extensions 30
3.1 HMAX Model . . . . . . . . . . . . . . . . . . . . . . . . . . 30
3.2 Extensions to the Standard HMAX Model . . . . . . . . . . 37
3.3 Discussions and Proposed Modifications . . . . . . . . . . . 46
3.3.1 Visual Dictionary of Features in HMAX Model . . . . 47
3.3.2 Encoding Occurrences and Co-Occurrences of Fea-
tures in HMAX Model . . . . . . . . . . . . . . . . . 47
3.3.3 Color Processing in HMAX Model . . . . . . . . . . . 48
3.3.4 Applications of HMAX Model . . . . . . . . . . . . . 48
4 Enhancements to the Visual Dictionary in HMAX Model 49
4.1 Introduction . . . . . . . . . . . . . . . . . . . . . . . . . . . 49
4.2 Proposed Methods for Creation of the Visual Dictionary . . 51
4.2.1 SOM and Clustering over Images from All Classes . . 53
4.2.2 SOM and Clustering over Images Individually . . . . 54
4.2.3 SOM and Clustering over Images in Each Class . . . 56
4.2.4 Sampling over Center of Images . . . . . . . . . . . . 57
4.2.5 Sampling over Saliency Points . . . . . . . . . . . . . 59
ii
4.2.6 Spatially Localized Dictionary of Features . . . . . . 60
4.3 Discussions . . . . . . . . . . . . . . . . . . . . . . . . . . . 63
5 Encoding Occurrences and Co-occurrences of Features in
HMAX Model 67
5.1 Introduction . . . . . . . . . . . . . . . . . . . . . . . . . . . 67
5.2 Background on Biological Inspirations . . . . . . . . . . . . . 68
5.2.1 Biological Inspirations for Mean Pooling . . . . . . . 69
5.2.2 Biological Inspirations for Co-occurrence . . . . . . . 72
5.3 HMean . . . . . . . . . . . . . . . . . . . . . . . . . . . . . . 77
5.4 Encoding Co-occurrence of Features . . . . . . . . . . . . . . 83
5.5 Experimental Results . . . . . . . . . . . . . . . . . . . . . . 91
5.5.1 HMean . . . . . . . . . . . . . . . . . . . . . . . . . . 91
5.5.2 Co-occurrence . . . . . . . . . . . . . . . . . . . . . . 94
5.6 Discussions . . . . . . . . . . . . . . . . . . . . . . . . . . . 98
6 CQ-HMAX: A New Biologically Inspired Color Approach
to Image Classification 102
6.1 Introduction . . . . . . . . . . . . . . . . . . . . . . . . . . . 103
6.2 CQ-HMAX . . . . . . . . . . . . . . . . . . . . . . . . . . . 109
6.3 Experimental Results . . . . . . . . . . . . . . . . . . . . . . 116
6.4 Discussions . . . . . . . . . . . . . . . . . . . . . . . . . . . 122
7 Applications of Proposed HMAX and CQ-HMAX Models126
7.1 Automated Mitosis Detection Using Texture, SIFT Features
and HMAX Biologically Inspired Approach . . . . . . . . . . 127
iii
7.1.1 Introduction . . . . . . . . . . . . . . . . . . . . . . . 127
7.1.2 Framework . . . . . . . . . . . . . . . . . . . . . . . 129
7.1.3 Experimental Results . . . . . . . . . . . . . . . . . . 130
7.1.4 Discussion . . . . . . . . . . . . . . . . . . . . . . . . 131
7.2 Classification of Marine Organisms in Underwater Images
using CQ-HMAX . . . . . . . . . . . . . . . . . . . . . . . . 133
7.2.1 SIFT Features . . . . . . . . . . . . . . . . . . . . . . 135
7.2.2 Marine Organisms Dataset and Experimental Results 135
7.2.3 Discussion . . . . . . . . . . . . . . . . . . . . . . . . 139
7.3 The Use of Optical and Sonar Images in the Human and
Dolphin Brain for Image Classification . . . . . . . . . . . . 143
7.3.1 Similarities between Auditory and Visual System in
Mammals . . . . . . . . . . . . . . . . . . . . . . . . 143
7.3.2 Combination of Optical and Sonar Images . . . . . . 145
7.3.3 Experimental Model and Dataset . . . . . . . . . . . 146
7.3.4 Diver Sonar and Optical Images . . . . . . . . . . . . 146
7.3.5 Dataset . . . . . . . . . . . . . . . . . . . . . . . . . 150
7.3.6 Experimental Results . . . . . . . . . . . . . . . . . . 151
7.3.7 Discussion . . . . . . . . . . . . . . . . . . . . . . . . 153
8 Conclusion 156
8.1 Contributions . . . . . . . . . . . . . . . . . . . . . . . . . . 157
8.2 Future Works . . . . . . . . . . . . . . . . . . . . . . . . . . 161
Bibliography 163
iv
Summary
Image recognition is one of the most challenging problems in computer
science due to different illumination, viewpoints, occlusions, scale and shift
transforms in the images. Hence no computer vision approach has been
capable of dealing with all these issues to provide a complete solution. On
the other hand, the human visual system is considered a superior model for
various visual recognition tasks such as image segmentation and classifica-
tion as well as face and motion recognition. Exceptional fast performance
of human visual system on image recognition tasks under different resolu-
tions (scales), translations, rotations and lighting conditions has motivated
researchers to study the mechanisms performed in the human and other
mammals’ visual system and to simulate them. Recent achievements in
biologically inspired models have motivated us to further analyze these
hierarchical structure models and investigate possible extensions to them.
In this thesis, we study several hierarchical models for image classifica-
tion that are biologically inspired and simulate some known characteristics
of visual cortex.
We base our investigation on the HMAX model, which is a well-known
biologically inspired model (Riesenhuber and Poggio, 1999), and extend this
model in several aspects such as adding clustering of features, evaluating
different pooling methods, using mean pooling (HMean) and max pooling
in the model as well as coding occurrences and co-occurrences of features
1
with the goal of improving the image classification accuracy on benchmark
datasets such as Caltech101 and a subset of Caltech256 (classes with a
higher number of training images) and an underwater image dataset. We
introduce several self organizing maps and clustering methods in order to
build mid-level dictionary of features. We also investigate the use of differ-
ent pooling methods and show that concatenation of biologically inspired
mean pooling with max pooling as well as enhanced models for encoding
occurrences and co-occurrences of features on a biological feasibility basis
improves the image classification results.
We further propose a new high-level biologically inspired color model,
CQ-HMAX, which can achieve better performances than the state-of-the-
art using the bottom-up approaches when combined with other low-level
biologically inspired color models and HMean on several datasets such as
Caltech101, Soccer, Flowers and Scenes. We introduce a new dataset of
benthic marine organisms and compare different proposed methods.
We also propose an HMAX like structure for simulating auditory cortex
and create sonar images and combine them with visual images for under-
water image classification in poor visibility conditions. We also show the
use of HMAX and CQ-HMAX models on other tasks such as detection of
mitosis in histopatholgy images and propose several future directions on
this field of study.
2
List of Tables
4.1 Comparison between random and non-random sampling meth-
ods for creation of the dictionary of features in Caltech101
dataset classification task using 30 training images per cat-
egory. . . . . . . . . . . . . . . . . . . . . . . . . . . . . . . 64
5.1 Classification performance on four datasets by use of frequency
of features in different modes.
+
and
.
stand for concatena-
tion and inner product of two vectors respectively. FC2AV is for
Actual Value FC2, FC2HM+C2 is for concatenation of HMAX
C2 features with hard max FC2, FC2T+C2 is for threshold,
FC2SM+C2 is for soft max and FC2AV+C2 is for actual val-
ues of C2 vectors described in Section 5.3. . . . . . . . . . . . . 94
5.2 Classification performance on the Caltech101, Caltech256 (sub-
set – see text for details), and TMSI Underwater Images datasets. 98
6.1 Na¨ıve use of various color channels and color spaces. . . . . . 117
6.2 Experimental results of the use of CQ-HMAX color model
in concatentation with HMAX and HMean on Caltech101,
8 Scenes, 17 Flowers and Soccer datasets. . . . . . . . . . . . 119
I
6.3 Classification accuracy on the Soccer and Flowers datasets
using different color channels and Single Opponent and Dou-
ble Opponent features of (Zhang et al., 2012). . . . . . . . . 124
7.1 Results of different Classifiers (Ground Truth = 226). . . . . 131
7.2 Classification accuracy on the marine benthic organisms dataset
using different methods. . . . . . . . . . . . . . . . . . . . . 139
7.3 Classification accuracy using different ranges of images and
sonar. Short range is between 1 - 2.5m. Medium range is
2.5 - 3.5m and long range is between 3.5 - 5m. . . . . . . . . 152
8.1 Comparison of HMAX performance vs. the best perfor-
mance achieved by a modified HMAX model on each dataset.
The best performance is either CQ-HMAX, Co-Occurrence
HMAX, HMean or a combination of them. . . . . . . . . . . 159
II
List of Figures
1.1 Different roles proposed for different layers of human visual
system hierarchy in Goldstein (2009). . . . . . . . . . . . . . 2
1.2 Hubel and Wiesel’s model of simple and complex cells in
visual cortex (right) and HMAX simulation (left). . . . . . . 5
1.3 A summary of main contributions on the HMAX model. . . 9
2.1 Dynamic Routing Model (Olshausen et al., 1993). . . . . . . 16
2.2 Top-Down Hierarchy of Features (Bart et al., 2004) . . . . . 16
2.3 Interactive Activation and Competition Model. . . . . . . . . 18
2.4 Deep Belief Networks (Hinton et al., 2006). . . . . . . . . . . 19
2.5 Bag of Features (Li and Perona, 2005). . . . . . . . . . . . . 21
2.6 Operation of nodes in a hierarchy: this illustrates how nodes
operate in a hierarchy. The bottom-level nodes have finished
learning and are in inference mode (George and Hawkins,
2009). . . . . . . . . . . . . . . . . . . . . . . . . . . . . . . 22
2.7 LeNet (LeCun and Bengio, 1995). . . . . . . . . . . . . . . . 24
2.8 Neocognitron (Fukushima, 1980). . . . . . . . . . . . . . . . 25
2.9 Left: Hierarchical Statistical Learning. Right: Learning
statistics in images Fidler et al. (2008). . . . . . . . . . . . . 26
III
2.10 A comparison on the main models introduced above. . . . . 28
3.1 Invariance to scale and position in C1 layer (Serre and Riesen-
huber, 2004). . . . . . . . . . . . . . . . . . . . . . . . . . . 31
3.2 The standard HMAX model (Riesenhuber and Poggio, 1999) . 32
3.3 Extensions to HMAX in Serre et al. (2007a) . . . . . . . . . 38
3.4 (left) Gabor and (right) Gaussian derivatives (Serre and
Riesenhuber, 2004). . . . . . . . . . . . . . . . . . . . . . . 39
3.5 Receptive filed organization of the S1 units (only units at
one phase are shown (left: Gabor, right: Guassian) (Serre
and Riesenhuber, 2004). . . . . . . . . . . . . . . . . . . . . 40
3.6 Modified HMAX model in (Mutch and Lowe, 2008). . . . . . 41
3.7 Dense and sparse features (Theriault et al., 2011). . . . . . . 43
3.8 Unsupervised learning of S2 prototypes (Masquelier and Thorpe,
2007). . . . . . . . . . . . . . . . . . . . . . . . . . . . . . . 45
3.9 Multiple-scale sparse features (Theriault et al., 2011). . . . . 45
4.1 Sampling over all images and performing clustering over all
samples to create the dictionary of features. . . . . . . . . . 54
4.2 Sampling over one single image and performing clustering at
image level to create a dictionary of features. . . . . . . . . . 55
4.3 Clustering on samples from the center quarter of the images
from each category to create a dictionary of features. . . . . 57
4.4 Creating the dictionary of features from the center of images
rather than the whole image to create a dictionary of features. 58
IV
4.5 Clustering on samples from the center quarter of all of the
images to create a dictionary of features. . . . . . . . . . . . 59
4.6 Combined model of bottom up attention and object recog-
nition (Walther, 2006). . . . . . . . . . . . . . . . . . . . . . 60
4.7 Use of zones and frequency of features in clustering inter
classes using most frequent features in each zone for each
class of images. . . . . . . . . . . . . . . . . . . . . . . . . . 61
4.8 Different methods for creation of the dictionary of features. . 62
5.1 The use of Average pooling (HMean) and Max pooling (HMAX). 78
5.2 The use of frequency of features vs. the use of the best
matching unit (BMU) response. In HMAX implementations,
the max on the columns is taken as the response for creating
C2 output vector. In contrast, histogram approaches using
SIFT methods, use the statistics of occurrences of features,
i.e. the normalized sum of the max values on the rows. . . . 81
5.3 Creation of C3 dictionary for encoding co-occurrence of fea-
tures. . . . . . . . . . . . . . . . . . . . . . . . . . . . . . . . 84
5.4 The main model encoding co-occurrence of features. . . . . . 85
5.5 The neural network model with long-term memory for en-
coding co-occurrence of features. . . . . . . . . . . . . . . . . 87
5.6 The neural network model with short-term memory for en-
coding co-occurrence of features. . . . . . . . . . . . . . . . . 90
5.7 Sample images of (a) Caltech101 (b) Outdoor Scenes (c)
Soccer and (d) Flowers datasets. . . . . . . . . . . . . . . . . 91
V
5.8 Examples from TMSI Underwater Images dataset. . . . . . . 96
5.9 Classification accuracy on Caltech256 as a function of num-
ber of training images. . . . . . . . . . . . . . . . . . . . . . 99
6.1 The hierarchical structure of CQ-HMAX and an example
image of a beach scene in the S1 and C1 layers. . . . . . . . 111
6.2 The overall model using both shape and color information.
Dotted lines represent an extension in which C1 layer is
eliminated and S1 information are directly used to create
a dictionary of features and to calculate S2 and C2 features. 116
6.3 Histograms of color cores using a one-vs rest classification
scheme in Flowers dataset. Accuracy for categories 1 and 2
are 43.3% and 100% respectively. a. Category 1. b. Aver-
age of all categories except category 1. c. Category 2. d.
Average of all categories except category 2. . . . . . . . . . . 120
7.1 Framework for mitosis detection. . . . . . . . . . . . . . . . 130
7.2 The hierarchical structure of integrated HMAX and CQ-
HMAX models. . . . . . . . . . . . . . . . . . . . . . . . . . 134
7.3 Sample images from the marine organisms dataset. . . . . . 136
7.4 Comparison of HMAX and CQ-HMAX classification accuracy.140
VI
7.5 Sample images from different classes to compare the classifi-
cation accuracy of HMAX and CQ-HMAX. a) Seagrass (Sea-
weed) where CQ-HMAX significantly outperforms HMAX.
b) Seafan soft coral, where HMAX has a slightly higher
classification accuracy than CQ-HMAX. c) Stem Sponges,
where CQ-HMAX significantly outperforms HMAX. d)Lily
Anemone, where HMAX and CQ-HMAX have equal classi-
fication accuracy. . . . . . . . . . . . . . . . . . . . . . . . . 141
7.6 The hierarchical structure of our dual model. . . . . . . . . . 146
7.7 Target visibility reaches zero at farther ranges. Sample im-
ages of targets at range 3 meters. . . . . . . . . . . . . . . . 148
7.8 Sample pairs of images of camera and sonar taken at range
1.5m. The images on the left of each pair show a visual
image of an object and those on the right are cuts from a
3D sonar image. . . . . . . . . . . . . . . . . . . . . . . . . . 151
8.1 Retonotopic mapping in the fovea. The foveal area is repre-
sented by a relatively larger area in V 1 than the peripharal
areas. . . . . . . . . . . . . . . . . . . . . . . . . . . . . . . . 162
VII
Chapter 1
Introduction
1.1 Background and Motivations
Image classification includes a broad range of approaches to the identifi-
cation of images or parts of them. In classification of images, each image is
assumed to have a series of features that distinguish that particular image
from other images. Different approaches are proposed to extract features
such as geometric parts, spectral regions, histogram of pixels in color or
grayscale, using templates of the target of interest or other features from
images. These approaches generally fall into two categories, namely, super-
vised and unsupervised (or a combination of them).
These approaches can be bottom-up, top-down, or interactive based on
the contextual information from the images. Object rotations, occlusions,
different viewpoints, scales and lighting in the images are among the factors
that make image classification a complex process. As a result, the complete
method that can incorporate all these issues based on the computational
1
approaches of computer vision has not been successful.
On the other hand, human visual capabilities in dealing with these is-
sues have inspired many scientists to study the visual cortex of humans
and other mammals to gain a better understanding of it and to simulate
how these processes take place in the brain based on the current findings.
In addition there is active ongoing research in both directions (biologi-
cally inspired methods and computer vision approaches) towards a holistic
framework that can deal with all these issues.
1.2 Human Visual Cortex
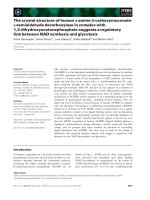
Research on the human visual cortex suggests a hierarchical structure
in which each level of the hierarchy is assumed to be responsible for specific
roles and sends its output to the higher levels, as can be seen in Figure 1.1.
Figure 1.1: Different roles proposed for different layers of human visual system
hierarchy in Goldstein (2009).
2
Visual cortex is a part of the cerebral cortex located in the occipital
lobe, which includes striate cortex or V 1 and extrastriate visual cortical
areas such as V 2, V 3, V 4 and V 5/MT, and is responsible for processing
visual information. The information acquired by V 1 is transmitted in two
primary pathways called the dorsal and ventral streams. The dorsal stream
begins with V 1, goes through V 2 and V 5/MT and to the posterior pari-
etal cortex. This pathway is also referred to as “Where pathway” or “How
pathway”. The ventral stream, begins with V 1, followed by V 2 and V 4 and
to the inferior temporal cortex (IT). This pathway is also called the “What
pathway” which is associated with the recognition and object representa-
tion and storage of long term memory (Mishkin et al., 1983). These layers
have interactions with each other via feedback, feedforward and inter-level
connections.
Object recognition in cortex is thought to be mediated by the ventral
visual pathway running from primary visual cortex, V 1, over extrastriate
visual areas V 2 and V 4 to inferotemporal cortex, IT Riesenhuber and Pog-
gio (1999).
Over the last decades, several physiological studies in non-human pri-
mates have established a core of basic facts about cortical mechanisms
of recognition that seem to be widely accepted and that confirm and re-
fine older data from neuropsychology. A brief summary of this consensus
knowledge begins with the ground-breaking work of Hubel and Wiesel first
in the cats (Hubel and Wiesel, 1962, 1965) and then in the macaque (Hubel
and Wiesel, 1968). Starting from simple cells in primary visual cortex, V 1,
3
with small receptive fields that respond preferably to oriented bars, neu-
rons along the ventral stream show an increase in receptive field size as
well as in the complexity of their preferred stimuli Riesenhuber and Poggio
(1999). At the top of the ventral stream, in anterior inferotemporal cortex
(AIT), cells are tuned to complex stimuli such as faces. A hallmark of these
IT cells is the robustness of their firing to stimulus transformations such
as scale and position changes. In addition, as other studies have shown,
most neurons show specificity for a certain object view or lighting condition
(Sigala et al., 2005; Olshausen et al., 1993).
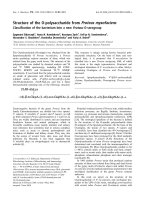
Since Hubel and Wiesel (1959) introduced simple and complex cells in
the early processing in visual system (Figure 1.2), a series of models were
proposed to simulate this hierarchical structure. HMAX Riesenhuber and
Poggio (1999) and HTM (George, 2008) are among these models. Some
other biologically inspired models are tackling the problem with a more
probabilistic approach like Deep Belief Networks (DBN) (Hinton et al.,
2006) using Restricted Boltzmann Machines (RBM) which will be further
discussed in Chapter 2.
There are also computational evidences that hierarchical structures such
as spatial pyramid matching and deep belief networks are more powerful
than traditional linear approaches. Computationally speaking, functions
that can be compactly represented by a depth k architecture might require
an exponential number of computational elements to be represented by a
depth k − 1 architecture. Since the number of computational elements one
can afford depends on the number of training examples available to tune
4
Figure 1.2: Hubel and Wiesel’s model of simple and complex cells in visual cortex
(right) and HMAX simulation (left).
or select them, the consequences are not just computational but also sta-
tistical: poor generalization may be expected when using an insufficiently
deep architecture for representing some functions (Bengio, 2009).
The depth of an architecture is the maximum length of a path from any
input of the graph to any output of the graph. Although depth depends on
the choice of the set of allowed computations for each element, theoretical
results suggest that it is not the absolute number of levels that matters,
but the number of levels relative to how many are required to represent the
target function efficiently (Bengio, 2009). Kernel machines, with a fixed
kernel can be considered as two level structures. Boosting usually adds
one level to its base learners. Artificial neural networks normally have two
hidden layers and can be considered two layer structures. Decision trees
are also considered two layer structures. According to the observations we
have from the human’s visual system, there are several layers in the brain
that work in a hierarchical structure to interpret the images and perform
cognition and recognition in the brain (Serre et al., 2007a).
5
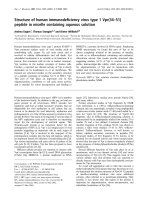
1.3 HMAX Biologically Inspired Model
HMAX, proposed by Riesenhuber and Poggio (1999), is a model that
simulates the simple-complex cell hierarchy in the visual cortex. The model
reflects the general organization of visual cortex in a series of layers from
V 1 to IT to PFC. In the standard HMAX model, there are four layers
of hierarchy (namely, S1, C1, S2 and C2) that create the features for
the classifier and there is a supervised classifier on top as can be seen in
Figure 1.3. A pyramid of Gaussian filters are convolved on the images in
S1 layer, and a local max is calculated on small neighborhoods in C1 layer.
A handmade dictionary of features that contains more complex features is
convolved on the C1 layer, and the S2 layer is thus created. A global max
is taken on S2 layer to create the C2 layer, and the outputs are then fed
to a classifier such as a support vector machine (SVM).
Subsequent extensions to this model have improved it for image classi-
fication tasks to compete with the state-of-the-art computational models.
We will explain the HMAX model in more detail and provide an extensive
review on the extensions to the base model in Chapter 2. Serre and Riesen-
huber modified the standard HMAX structure and released a new version
of this structure (Serre and Riesenhuber, 2004). Gabor filters were used
instead of second order Gaussian derivatives in S1 layer, and the number of
filter sizes was increased. They also changed the values of scale range and
pool range parameters in standard HMAX in C1 layer to provide less scale
tolerance and therefore narrower spatial frequency bandwidth (Serre and
Riesenhuber, 2004). Two other layers were added to the standard model to
6
simulate bypassing of information. This model includes S2b, S3, C2b, C3,
and S4. They also suggested a random sampling of features from C1 layer
in order to replace the handmade dictionary of features in HMAX model.
Mutch et al. (Mutch and Lowe, 2008; Mutch et al., 2010a) proposed a
series of computational modifications to the structure proposed by Serre et
al.’s model. In this model, a fixed size of Gabor filters is implemented on
different scales of the images which provides the same invariance to scale
for Gabor filters (Mutch and Lowe, 2008, 2006). They also investigated
the use of Sparse features. Theriault et al. (2011) suggested using multi-
scale sparse features and replaced Guassian response in S2 layer with a
normalized dot product.
1.4 Scope, Contributions and Organization
of Thesis
In this thesis, we propose several modifications, enhancements and ap-
plications for HMAX model as follows:
(i) Non-random sampling methods for creation of the dictionary of fea-
tures such as clustering and saliency points;
(ii) Different pooling methods and encoding occurrences and co-occurrences
of features in the intermediate layers;
(iii) A new high-level biologically inspired color model (CQ-HMAX); and
(iv) Applications of HMAX model in other image classification tasks.
7
All the modification made to the main model are biologically inspired
or consistent with the existing evidence from the visual cortex mechanisms,
which we will illuminate in detail in the following Chapters.
In Chapter 2, we have an overview, comparison and a discussion on sev-
eral pertinent models available in the literature. We introduce biologically
inspired models such as HTM (George, 2008), LeNet (LeCun and Ben-
gio, 1995), Dynamic Routing Model (Olshausen et al., 1993), Hierarchical
Statistical Learning (Fidler et al., 2008), Top-Down Hierarchy of Features
(Bart et al., 2004) , NeoCognitron (Fukushima, 1980) and computational
approach of bag of features (Li and Perona, 2005), DBN (Hinton et al.,
2006) and HMAX model (Riesenhuber and Poggio, 1999).
In Chapter 3 we investigate HMAX model in more detail and review
the main modifications made to it. We discuss this model and provide
several modifications and improvements built on top of the previous en-
hancements to the model which are both biologically inspired and result
in better classification performances on different datasets over the existing
HMAX model performance.
The general structure of HMAX model is shown in Figure 1.3 and the
main contribution areas to be covered in this thesis are highlighted by red
circles.
In Chapter 4 we present modifications to the creation of the dictio-
nary of features using several self organizing maps, clustering methods and
saliency points selection and discuss the significant improvement that is
achieved by using spatial and frequency information of the features in the
8
Figure 1.3: A summary of main contributions on the HMAX model.
9