Radon and radium Concentrations in drinkable water supplies of the Thu Duc region in Ho Chi Minh city, Vietnam
Bạn đang xem bản rút gọn của tài liệu. Xem và tải ngay bản đầy đủ của tài liệu tại đây (934.62 KB, 22 trang )
Author’s Accepted Manuscript
Radon and radium Concentrations in drinkable
water supplies of the Thu Duc region in Ho Chi
Minh city, Vietnam
Le Cong Hao, Huynh Nguyen Phong Thu, Nguyen
Van Thang, Le Quoc Bao
PII: S0969-8043(15)30174-3
DOI: />Reference: ARI7122
To appear in:
Applied Radiation and Isotopes
Received date: 12 May 2015
Revised date: 13 August 2015
Accepted date: 24 August 2015
Cite this article as: Le Cong Hao, Huynh Nguyen Phong Thu, Nguyen Van
Thang and Le Quoc Bao, Radon and radium Concentrations in drinkable water
supplies of the Thu Duc region in Ho Chi Minh city, Vietnam, Applied Radiation
and Isotopes, />This is a PDF file of an unedited manuscript that has been accepted for
publication. As a service to our customers we are providing this early version of
the manuscript. The manuscript will undergo copyediting, typesetting, and
review of the resulting galley proof before it is published in its final citable form.
Please note that during the production process errors may be discovered which
could affect the content, and all legal disclaimers that apply to the journal pertain.
www.elsevier.com/locate/apradiso
1
Radon and Radium Concentrations in Drinkable Water Supplies of the Thu Duc Region
in Ho Chi Minh City, Vietnam
Names of the authors: Le Cong Hao, Huynh Nguyen Phong Thu, Nguyen Van Thang,
and Le Quoc Bao
Title: Radon and Radium Concentrations in Drinkable Water Supplies of the Thu Duc
Region in Ho Chi Minh City, Vietnam
Affiliation(s) and address(es) of the author(s): Nuclear Technique Laboratory, VNU-
HCM, University of Science, Vietnam
E-mail address of the corresponding author:
2
Radon and Radium Concentrations in Drinkable Water
Supplies of the Thu Duc Region in Ho Chi Minh City, Vietnam
Le Cong Hao, Huynh Nguyen Phong Thu, Nguyen Van Thang, and Le Quoc Bao
Nuclear Technique Laboratory, VNU-HCM, University of Science, Vietnam
Abstract
The results of
222
Rn and
226
Ra activity measurements in drinkable water supplies of
the Thu Duc region in Ho Chi Minh City, Vietnam, are presented in this paper. The
measurements were performed using a RAD 7 radon detector manufactured by Durridge
Company, Inc. Mean concentrations of
222
Rn and
226
Ra were found to be 0.11 ± 0.01
Bq.l
-1
and 0.11 ± 0.02 Bq.l
-1
in 14 drinking water samples. They are 0.12 ± 0.01 Bq.l
-1
and 0.10 ± 0.02 Bq.l
-1
in 15 tap water samples, respectively. The mean
222
Rn
concentration of 1.40 ± 0.03 Bq.l
-1
in the 20 groundwater samples of this study is also
lower than the WHO advised level of 100 Bq.l
-1
. Fifty percent of groundwater samples
analysed have
226
Ra levels in excess of the USEPA recommended maximum contaminant
level of 0.185 Bq.l
-1
. The occurrence of elevated concentrations of
226
Ra in groundwater
samples was explained by pH and alkaline conditions.
Keywords
222
Rn,
226
Ra, Drinkable water, RAD 7, the Thu Duc region, Vietnam.
Introduction
The determination of actinides in small concentrations of natural
232
Th,
238
U,
226
Ra
and
210
Po in environmental samples has been the subject of several investigations (Hao et
al, 2011). In drinkable water supplies, the measurement of these naturally occurring
radionuclides is important for environmental pollution and public health studies. Findings
3
have suggested that the source of the radionuclides dissolved in the water is the
surrounding bedrock; in geological settings rich in
238
U, like, for example, granite, also
higher activity concentrations of the uranium series of radionuclides like
226
Ra and
222
Rn
are expected (Wallner et al, 2007).
226
Ra and
222
Rn are essentially soluble in water, thus enter groundwater by the
dissolution of materials in water layers, removal of rock or soil surfaces and expulsion
from minerals by radioactive decay (Sahin et al, 2013).
226
Ra has a long half-life of 1600
years and behaves as calcium, tracing the calcium path in the body partially deposited in
the bone tissue. The alpha-particle emission of radium makes it a carcinogen, with the
continual accumulation of
226
Ra in the bone tissue being a known cause of bone cancer
(Porntepkasemsan and Srisuksawad, 2008).
222
Rn a decay product of
226
Ra has a half-life
of 3.82 days and is a tasteless radioactive gas, inert, colourless, and odourless. Therefore,
human beings are exposed to
222
Rn in two ways, either through inhalation or ingestion
(Khattak et al, 2011). When radon decays after being inhaled or ingested, it releases
energy that can damage parts of living tissue, which may lead to the unnatural
reproduction of a cell and an increased risk of getting cancer.
It is well known that the different radionuclides are not in radioactive equilibrium
with each other due to differences in mobilisation from the rock and water chemistry. So,
for example, radon activities can be three to five orders of magnitude higher than U or Ra
activities, probably due to absorption of the U and Ra into the host rock, while the
gaseous Rn diffuses along microcrystalline imperfections into the interstitial waters
(Wallner et al, 2007). High levels of radon in drinking water represents a potential health
risk due to human exposure through both inhalation and ingestion of radon. In water prior
to drinking, alpha particles emitted by radon and its decay product quickly lose their
energy and are taken up by other compounds in water. Therefore, the exposure of the
ingested radon along with the intake of water is less than the inhaled radon from the
radon exhalation from the same water (Somashekar and Ravikumar, 2010). In the case of
radium, human exposure through the ingestion/consumption of radium in drinkable water
should be taken into account.
With regard to water contamination and public health, the purpose of this study was
to determine the activity concentrations of radon and radium in drinkable water supplies.
4
The occurrence of elevated concentrations of
226
Ra and the correlation between
222
Rn and
226
Ra concentrations in groundwater samples were also presented.
Experimental
Description of the site
Ho Chi Minh City (hereafter HCMC) is located in the south of Vietnam, and is the
biggest city in Vietnam. It is located from 10° 10’ to 10° 38’ North and 106° 2’ to 106°
54’ East. It is 1,730 km from Hanoi and is at the crossroads of international maritime
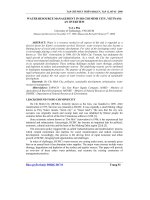
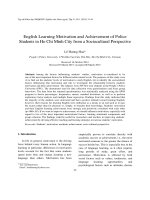
routes. Figure 1 shows the location map of the site in Thu Duc in Ho Chi Minh City,
Vietnam. At present, four water resources are used for water supply in HCMC. They are
(a) the Dong Nai River, (b) the Sai Gon River, (c) groundwater and (d) rainwater. The
Dong Nai River originates from the Di Linh highland in Lam Dong province and
connects to the East Sea through the Soai Rap estuary. The section of the Dong Nai River
in HCMC spreads from District 9 and intersects the Nha Be River. While a section of the
Sai Gon River in HCMC originates from the Phu My commune to Thanh My Loi,
District 2 and water from the Hoa An water intake station on the Dong Nai River is
pumped to the Thu Duc water treatment plant with a capacity of 650,000 m
3
/day. HCMC
also has the following five aquifers, namely, (i) Holocene, (ii) Pleistocene, (iii) Upper
Pliocene, (iv) Lower Pliocene and (v) Mesozoic. Over 150,000 wells/boreholes were
exploited in HCMC. Three of the five aquifers play an important role in terms of water
supply for HCMC: the Pleistocene aquifer (20–50 m), the upper Pliocene aquifer (50–100
m) and the lower Pliocene aquifer (100–140 m) (Institute for Global Environmental
Strategies (IGES), 2007).
Water sampling
In this study, a total of 49 water samples were collected using the techniques
proposed by the manufacturer (RAD7 RAD H
2
O). All water samples (without bubbles)
were collected in dedicated 250-ml glass bottles. 14 drinking water samples were
collected from universities and dormitories (in the University Village), while 35 drinking
water samples were collected from the source drilled wells (tube wells) and water taps.
During sampling a water, the water source flowed for 10 minutes before taking the
5
sample (RAD7 RAD H
2
O), in order to let out the water from a possibly stagnant pipe
section and to obtain parameters characteristic of the fresh water. pH values are an
important indicator of water quality because water with a low pH can damage the piping
of the distribution system, leading to contamination (Sahin et al, 2013). The pH
measurements for each sample/location were done by using a portable “OAKTON pH
TESTER 30” device.
222
Rn activity concentration measurements
A RAD 7 H
2
O detector (hereafter RAD-W) manufactured by Durridge Company was
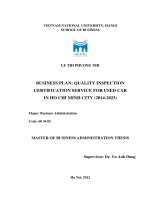
used to make direct readings of the radon concentrations in the water samples. The RAD-
W setup consists of three components, namely: a) a water vial with an aerator; b) the
desiccant tube and c) the alpha detector. Figure 2 shows a diagrammatic illustration of the
radon-monitor using a RAD-W for measuring radon concentrations in water samples. For
accurate readings, the RAD-W should be dried out thoroughly before making
measurements. High humidity levels reduce the efficiency of collection of the
218
Po
atoms, formed when radon decays inside the chamber. As always, the relative humidity
inside the instrument will stay below 10% for the entire 30-minute measurement period.
Then each measurement was carried out for three hours. The RAD-W method employs a
closed-loop aeration scheme whereby the air and water volumes are constant and
independent of the flow rate. The air is recirculated through the water and continuously
extracts the radon until a state of equilibrium develops. The RAD-W system reaches this
state of equilibrium within about 5 minutes after which no more radon can be extracted
from the water. The extraction efficiency (percentage of radon removed from the water
into the air loop) is around 94% for a 250 ml sample. The exact value of the extraction
efficiency depends somewhat on the ambient temperature, but it is almost always well
above 90%. The most significant background effects in the RAD-W are counts from
radon daughters and traces of radon left from previous measurements.
The RAD 7 has the unusual ability to distinguish between the ‘‘new’’ radon
daughters and the ‘‘old’’ radon daughters left from previous tests. Even so, a very high
radon sample can cause daughter activity that can affect the next measurement (RAD7
RAD H
2
O). In order to determinate the background level, a distilled water sample is used
6
as a radon-free water sample. The background sample was measured using the same
protocol. The minimum detectable activity (MDA) was estimated to be 0.073 Bq.l
-1
226
Ra Activity Concentration Measurements
After the latest results of radon activity in water, the bottles were tightly closed to
allow the concentration of radon from radium in the samples to increase. The same
experimental method as was used for the radon measurements was followed to measure
the radium content of the samples. The evaluation of the concentration of soluble radium
salts in water was performed after 10 days. Considering that after that time the radon
concentration was reaching the secular equilibrium, the radioactivity of radium (
226
Ra)
soluble compounds and radon (
222
Rn) could be calculated from equation (1):
Rn
C
t
Rn
e
C
k
Ra
C
.
1
(1)
where C
Rn
is the measured radioactivity of
222
Rn after 10 days,
Rn
is the decay constant
of
222
Rn, k
C
is the correction factor for both escape or leakage and counting efficiency
and C
Ra
is the activity of radium compounds which are soluble in water that could be
considered constant during the time interval t of 10 days.
The k
C
was determined by using a Standard Reference Material (SRM) capsule of
NIST. The SRM capsule contained
226
Ra with an activity of approximately 5 Bq. The
SMS capsule was stored in 250 ml of distilled water for 10 days. Equation (2) presents
the correction factor
Rn
NISTRn
C
C
)(
C
k
(2)
where C
Rn(NIST)
is the activity of radon calculated from NIST, and C
Rn
is the measured
radioactivity of
222
Rn from RAD-W. The evaluation of the correction factor was found to
be 1.250.03.
7
Dose assessment
The annual effective doses for ingestion and inhalation were estimated according to
parameters introduced by a UNSCEAR report (UNSCEAR, 2006). The annual effective
dose as a result of the intake of radon or radium, E
w
(Sv.y
-1
) is calculated on the basis of
the mean activity concentration using equation 3:
ww
CV
w
E
(3)
where, (Sv.Bq
-1
) is the ingesting dose conversion factor of radon or radium (10
-8
Sv.Bq
-1
for radon and 2.8x10
-7
Sv.Bq
-1
for radium), V
w
is the water consumption rate
(730 L.y
-1
was assumed
for a ‘standard adult’ drinking the same water directly from the
source point (Galán López et al, 2004, Somlai et al, 2007, Todorovic et al, 2012) and C
w
(Bq.l
-1
) is the radon or radium concentration in water.
Results and discussion
Table 1 summarises the concentration results of radon and radium in the 14 drinking
water samples collected from the University Village. The highest radon concentration
was measured in TDTT to be 0.36 ± 0.06 Bq.l
-1
. Mean concentrations of
222
Rn in these
water samples were calculated to be 0.11 ± 0.01 Bq.l
-1
. Following that, the highest
radium concentration was found to be 0.18 ± 0.08 Bq.l
-1
in the QT and the mean
concentration of
226
Ra was calculated to be 0.11 ± 0.02 Bq.l
-1
.
The annual effective dose contributions from radon and from radium in the drinking
water samples are also given in Table 1. It was found that the mean annual effective dose
for ingestion (radon) ranged was calculated to be 0.78 ± 0.07 µSv.y
-1
. The mean dose
contribution from radium in water to the annual dose resulting directly from the water
intake ranges was found to be 22.57 ± 3.74 µSv.y
-1
.
The United Nations Scientific Committee on the Effects of Atomic Radiation
(UNSCEAR) has provided the mean dose from radon in water. As a result of ingestion
the mean radon dose is 2 µSv.y
-1
(UNSCEAR, 2000). It is found that our average annual
effective dose due to ingestion is well below the reference level values of UNSCEAR and
8
hence does not pose any health problems as a consequence of the radon dose received
from drinking water in the study area.
Similarly, the highest radon concentration in 15 tap water samples in Table 2 was
found to be 0.20 ± 0.05 Bq.l
-1
in M1 with an average value of 0.12 ± 0.01 Bq.l
-1
and the
average annual effective dose for ingestion was found to be 0.86 ± 0.07 µSv.y
-1
. The
highest radium concentration was found to be 0.17 ± 0.08 Bq.l
-1
, then the mean annual
dose resulting directly from water intake was 18.98 ± 3.482 µSv.y
-1
. It has been observed
that these average values obtained are also under UNSCEAR safety limits.
Table 3 summarises the concentration results of radon and radium in the groundwater
samples collected from different drilled wells (tube wells). The recorded
222
Rn activities
in 20 groundwater samples were found to vary from 0.44 ± 0.07 to 4.16 ± 0.20 Bq.l
-1
with
an average value of 1.40 ± 0.03 Bq.l
-1
consequently the average annual effective dose for
ingestion was found to be 9.97 ± 0.20 µSv.y
-1
. The radium concentration was found to
range from 0.08 ± 0.06 to 0.54 ± 0.12 Bq.l
-1
, with an average value of 0.18 ± 0.02 Bq.l
-1
then the mean annual dose resulting directly from water intake was 36.66 ± 3.74 µSv.y
-1
.
In groundwater, findings suggested that the concentration of radium was consistently
controlled by the geochemical properties of the aquifer systems, with the highest
concentrations most likely to be present where, as a consequence of the geochemical
environment, adsorption of the radium was slightly decreased (Szabo et al, 2012). The
three water-chemistry groups defined by low pH, low dissolved oxygen (DO)
concentrations, or by the combination of both factors were supported to explain the
occurrence of elevated concentrations of radium in the groundwater samples. This
hypothesis was then confirmed by a study on the relationship between concentrations of
226
Ra and pH for twenty groundwater samples.
Table 3 summarises the pH values and concentration results of radon and radium in
the groundwater samples collected from different tube wells. It was observed that the pH
values range from 3.45 to 7.9, the lowest pH value was measured in G5 to be 3.45 and the
highest pH value was measured in G16 to be 7.9, respectively. The radium concentration
was found to range from 0.08 to 0.54 Bq.l
-1
with the lowest radium concentration
measured also in the G8 (pH = 4.91) and the highest in the G1 (pH = 5.17) samples. In
this study low-pH conditions were most commonly found in the 20 groundwater samples.
9
As a result, a pH of less than about 6.5 strongly enhances the mobility of radium into
groundwater.
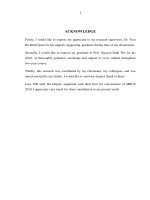
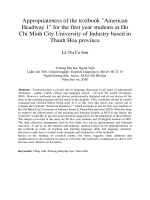
Figure 3 shows the relationship between concentrations of
226
Ra and pH for twenty
groundwater samples collected from different tube wells. It should be noted that
concentrations of
226
Ra in excess of 0.185 Bq.l
-1
(US Environmental Protection Agency
(USEPA), 2000) were observed in acidic water samples (pH was less than 6.3) at a
frequency of 40%. In particular, the maximum
226
Ra concentration of 0.54 Bq.l
-1
was
associated with acidic water (pH = 5.17) in the G1 sample. This result may be explained
by the fact that the Pleistocene aquifer is widely located under the whole area and is
exposed in Thu Duc district and some others. The high iron concentrations of
groundwater in HCMC and low pH levels of most surveyed wells are the dominant
reasons for high concentrations of
226
Ra in these groundwater samples. This means that
under low pH values and (or) anoxic conditions, the iron compounds can dissolve and
decrease the likelihood of the adsorption of radium onto aquifer materials enhancing the
mobility of radium into groundwater. Thus, low pH value is the most important water
parameter linked to high radium concentration (Almeida et al, 2004).
With two exceptions in the cases of samples from G12 and G16 (pH was larger than
7.5),
226
Ra concentrations were found to be in excess of 0.185 Bq.l
-1
with a frequency of
10%. These two values indicate that the occurrence of elevated concentrations of
226
Ra in
the groundwater samples was not only dependent on low pH levels but also on some
other parameters (Szabo et al, 2012). In fact,
226
Ra is chemically reactive and reacts
similarly to other divalent alkaline earth cations such as Ca and Sr and is most similar to
Ba. Thus, under high pH (pH>7.5) values, there is an increase of the mineral surface or
increasing stability of inorganic complexes such as chlorides so that the increase in
226
Ra
mobility along with an increase in mineralisation is mostly attributed to competitive
exchange with similar ions. Therefore, the most significant reasons for elevated
226
Ra
concentrations throughout the G12 and G16 samples are the low DO concentrations and
alkaline conditions.
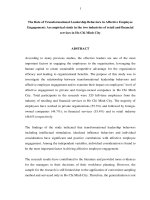
In order to investigate the origin of the radon from 20 groundwater samples, a
relationship between radon and radium levels was investigated as in Figure 4. The
correlation coefficient was then estimated to be 0.12. There is a weak linear correlation
10
between
222
Rn and
226
Ra in these samples. This suggests that the majority of
222
Rn found
in water samples did not originate from
226
Ra compounds soluble in water. The biggest
concentration of
222
Rn may have originated from gas exhalation by the soil adjacent to
the well due to a difference in physical-geographic characteristics of underground sources
of water. The geographical characteristics of water regions with different concentrations
of
238
U in rock, soil and water, or the temperature, salinity and turbidity of water may
play a key role in accelerating the rate of increase of
222
Rn concentrations in these 20
groundwater samples.
Conclusions
From the results for the 14 drinking water samples, and 15 tap water samples, it can be
concluded that these drinkable sources of water are low health risk from the standpoint of
the concentrations of radon (100 Bq.l
-1
) and radium (0.185 Bq.l
-1
) in them.
It was found that none of the radon concentrations of the twenty groundwater samples
are higher than the advised limit set by the WHO of 100 Bq.l
-1
(World Health
Organisation (WHO), 2008). The relationship between radon and radium levels was weak
and
222
Rn may have originated from differences in the physical-geographic characteristics
of underground sources of water.
Concentrations of
226
Ra were greater than 0.185 Bq.l
-1
in 10 (50%) of the 20 samples
analysed for this isotope. Typically, for 40% of the 20 samples the pH of the water was
lower than 6.3 and for 10% of these samples the pH of the water was greater than 7.5.
The occurrence of elevated concentrations of radium in these waters was explained by pH
and alkaline conditions.
Acknowledgements
This work was supported by the grant C2014-18-26 for Vietnam National University -
Ho Chi Minh City (VNU-HCM). The authors would like to thank the reviewers, English
proofreaders and editors for their thorough review and highly appreciated comments and
suggestions, which significantly contributed to improving the quality of this manuscript.
11
References
1. Le Cong Hao, Chau Van Tao, Nguyen Van Dong, Luong Van Thong, and Duong
Mong Linh (2011). Determination of natural uranium, thorium and radium isotopes in
water and soil samples by alpha spectroscopy. Kerntechnik, doi: 10.3139/124.110159
2. Wallner, G., & Steininger, G. (2007) Radium isotopes and
222
Rn in Austrian drinking
waters. Journal of Radioanalytical and Nuclear Chemistry, doi: 10.1007/s10967-006-
6939-4
3. Sahin, L., Cetinkaya, H., Murat, Saç M., and Ichedef, M. (2013) Determination of
radon and radium concentrations in drinking water samples around the city of
Kutahya. Radiation Protection Dosimetry, doi: 10.1093 /rpd /nct019
4. Porntepkasemsan, B., & Srisuksawad, K. (2008) Assessment of
226
Ra age-dependent
doses from water intake. Applied Radiation and Isotopes, doi:
10.1016/j.apradiso.2007
5. Khattak, N. U., Khan, M. A., Shah, M. T., and Javed, M. W. (2011) Radon
concentrations in drinking water sources of the main campus of the University of
Peshawar and surrounding areas, Khyber Pakhtunkhwa, Pakistan. Journal of
Radioanalytical and Nuclear Chemistry, doi: 10.1007/s10967-011-1297-2
6. Somashekar, R. K., & Ravikumar, P. (2010) Radon concentration in the groundwater
of Varahi and Markandeya river basins, Karnataka State, India. Journal of
Radioanalytical and Nuclear Chemistry, doi: 10.1007/s10967-010-0573-x
7. Institute for Global Environmental Strategies (IGES), 2007. Final research report,
Sustainable Groundwater Management In Asian Cities, IGES (Hayama, Japan)
8. RAD7 RAD H
2
O, User manual, Radon in water accessory, Durridge co.
9. United Nations Scientific Committee on the Effects of Atomic Radiation
(UNSCEAR) (2006) Annex E: Sources-to-effects assessment for radon in homes and
workplaces. New York
10. Galán López, M., Martín Sánchez, A. and Gómez Escobar, V. (2004) Estimates of the
dose due to
222
Rn concentrations in water, Radiation Protection Dosimetry,
doi:10.1093/rpd/nch350
12
11. Somlai, K., Tokonami, S., Ishikawa, T., Vancsura, P., Gáspár, M., Jobbágy, V.,
Somlai, J., and Kovács, T. (2007)
222
Rn concentration of water in the Balaton
Highland and in the southern part of Hungary and the assessment of the resulting
dose. Radiation Measurements, doi:10.1016/j.radmeas.2006.11.005
12. Todorovic, N., Nikolov, J., Forkapic, S., Bikit, I., Mrdja, D., Krmar, M., and
Veskovic, M. (2012) Public exposure to radon in drinking water in Serbia. Applied
Radiation and Isotopes, doi: 10.1016/j.apradiso.2011.11.045
13. United Nations Scientific Committee on the Effects of Atomic Radiation
(UNSCEAR) (2000) Annex E: Sources-to-effects assessment for radon in homes and
workplaces. New York
14. Szabo, Z., dePaul, V. T., Fischer, J. M., Kraemer, T. F., and Jacolsen, E. (2012)
Occurrence and geochemistry of radium in water from principal drinking-water
aquifer systems of the United States. Applied Geochemistry, doi:
10.1016/j.apgeochem.2011.11.002
15. World Health Organisation (WHO), 2008. third ed. Guidelines for Drinking Water
Quality, vol. 1. World Health Organisation, Geneva.
16. US Environmental Protection Agency (USEPA), 2000. Technical Support Document,
Radionuclides Notice of Data Availability, National Primary Drinking Water
Regulations; Radionuclides; Notice of Data Availability; Proposed Rule.
17. Almeida, R. M, Lauria, D. C, Ferreira, A. C, Sracek, O. (2004) Groundwater radon,
radium and uranium concentrations in Região dos Lagos, Rio de Janeiro State, Brazil.
Journal of Environmental Radioactivity, doi:10.1016/j.jenvrad.2003.10.006.
Figure captions:
Figure 1: Location map of the site in Thu Duc, Ho Chi Minh City Vietnam.
Figure 2: Diagrammatic illustrations of the radon-monitor with RAD-W.
Figure 3: Relationship of concentrations of
226
Ra with pH for twenty groundwater
samples.
Figure 4: Correlation between
222
Rn and
226
Ra concentration in drilled well water.
13
14
Figure 1: Location map of the site in Thu Duc, Ho Chi Minh City Vietnam.
Drinking water
Tap water
Drilled well
water
15
Figure 2: Diagrammatic illustrations of the radon-monitor with RAD-W.
16
Figure 3: Relationship of concentrations of
226
Ra with pH for twenty groundwater
samples.
Figure 4: Correlation between
222
Rn and
226
Ra concentration in drilled well water.
Table captions:
Table 1.
222
Rn and
226
Ra concentration in drinking water samples and the annual effective
doses.
Table 2.
222
Rn and
226
Ra concentration in tap water samples and the annual effective
doses.
Table 3.
222
Rn and
226
Ra concentration in drilled well water samples and the annual
effective doses.
17
Table 1.
222
Rn and
226
Ra concentration in drinking water samples and the annual
effective doses
Sample
Coordinates
222
Rn
concentration
(Bq.L
-1
)
226
Ra
concentration
(Bq.L
-1
)
Annual effective dose
due to ingestion (Sv.y
-1
)
222
Rn
226
Ra
KHTN
10°52'33"
0.090.03
0.110.07
0.690.25
22.6213.68
18
106°47'57"
CNTT
10°52'12"
106°48'13"
0.110.04
0.080.06
0.790.27
17.2112.80
BK
10°52'51"
106°48'21"
0.110.04
0.130.07
0.830.27
26.6014.89
QT
10°52'39"
106°48'06"
0.180.04
0.180.08
1.350.32
36.0816.11
KHXH&NV
10°52'14"
106°48'03"
0.100.04
0.110.07
0.740.26
22.9313.99
SPKT
10°50'60"
106°46'18"
0.130.04
0.100.07
0.970.29
21.4013.68
NH
10°51'27"
106°45'49"
0.170.04
0.110.07
1.230.31
21.4013.68
KTL
10°50'58"
106°45'13"
0.090.04
0.170.08
0.680.26
34.2415.81
NL
10°52'20"
106°47'34"
0.080.03
0.100.06
0.560.24
19.9613.08
ANND
10°52'24"
106°48'20"
0.070.03
0.110.07
0.540.23
22.0113.98
CNTĐ
10°51'04"
106°45'30"
0.090.04
0.100.06
0.660.27
20.0013.38
TDTT
10°52'18"
106°47'47"
0.360.06
0.160.08
2.620.44
32.7215.80
XD II
10°51'03"
106°45'50"
0.060.03
0.060.07
0.450.22
11.9613.68
KTX
10°52'42"
106°48'25’’
0.080.03
0.090.06
0.570.24
18.4112.78
Table 2.
222
Rn and
226
Ra concentration in tap water samples and the annual effective
doses
19
Sample
Coordinates
222
Rn
concentration
(Bq.L
-1
)
226
Ra
concentration
(Bq.L
-1
)
Annual effective dose
due to ingestion (Sv.y
-1
)
222
Rn
226
Ra
M1
10°50'7"
106°45'6’’
0.200.05
0.130.07
1.440.34
26.2914.59
M2
10°50'43"
106°46'44’’
0.100.04
0.080.06
0.700.26
17.0012.48
M3
10°50'25"
106°45'27’’
0.190.05
0.170.08
1.400.34
35.1616.11
M4
10°51'2"
106°46'52’’
0.140.04
0.150.07
1.010.29
29.9615.20
M5
10°52'8"
106°46'42’’
0.170.05
0.090.07
1.270.34
19.0214.28
M6
10°51'10"
106°45'52’’
0.060.03
0.060.06
0.410.22
11.7112.18
M7
10°52'6"
106°44'9’’
0.190.05
0.090.07
1.360.34
18.9314.28
M8
10°53'28"
106°46'5’’
0.180.04
0.070.06
1.290.31
13.3912.18
M9
10°50'42"
106°45'45’’
0.070.03
0.110.07
0.510.23
22.6213.68
M10
10°51'56"
106°47'36’’
0.080.04
0.070.06
0.590.27
14.5511.88
M11
10°52'6"
106°48'17’’
0.080.03
0.070.06
0.580.24
13.4512.78
M12
10°52'13"
106°46'25’’
0.170.04
0.150.08
1.250.31
29.6617.01
M13
10°50'53"
106°45'58’’
0.100.04
0.070.06
0.700.28
14.6212.48
M14
10°51'2"
106°45'44’’
0.090.04
0.110.07
0.640.26
22.6213.68
M15
10°51'9"
106°45'10’’
0.180.04
0.070.06
1.290.32
14.5212.78
20
Table 3.
222
Rn and
226
Ra concentration in drilled well water samples and the annual
effective doses
Sample
Coordinates
pH
222
Rn
concentration
(Bq.L
-1
)
226
Ra
concentration
(Bq.L
-1
)
Annual effective dose
due to ingestion (Sv.y
-1
)
222
Rn
226
Ra
G1
10°50'41"
106°46'2’’
5.17
4.160.20
0.540.12
30.371.47
111.2924.74
G2
10°52'40"
106°45'9’’
4.13
2.390.17
0.260.09
17.451.25
52.5918.55
G3
10°51'34"
106°47'18’’
6.27
2.400.15
0.430.12
17.551.11
87.4424.68
G4
10°51'6"
106°45'47’’
5.27
0.87.0.10
0.230.09
6.360.70
48.0018.24
G5
10°50'47"
106°45'58’’
3.45
2.570.16
0.340.11
18.791.16
68.7921.61
G6
10°50'51"
106°45'26’’
6.05
2.660.16
0.130.07
19.421.17
26.6014.59
G7
10°50'41"
106°45'40’’
6.10
1.640.13
0.390.12
11.940.92
80.7224.66
G8
10°52'18"
106°44'5’’
4.91
2.960.19
0.080.06
21.591.41
16.1413.38
G9
10°51'23"
106°45'39’’
6.04
1.420.12
0.170.08
10.350.89
34.8617.02
G10
10°51'38"
106°46'3’’
6.92
1.080.11
0.180.08
7.850.79
36.9916.42
G11
10°51'55"
106°48'2’’
4.30
1.370.11
0.100.06
9.990.82
20.0013.38
G12
10°50'25"
106°44'1’’
7.33
2.830.17
0.230.09
20.701.21
47.3918.54
G13
10°52'17"
106°46'16’’
6.22
0.560.08
0.150.07
4.060.60
29.6614.90
G14
10°51'38"
106°46'4’’
5.34
3.000.18
0.190.08
21.871.35
38.2217.02
G15
10°52'2"
106°47'2’’
4.70
0.440.07
0.090.06
3.220.49
17.7013.38
G16
10°52'24"
106°47'59’’
7.90
1.460.12
0.230.09
10.680.92
46.4718.54
G17
10°52'32"
106°46'2’’
4.15
1.030.11
0.320.11
7.500.82
65.4321.60
G18
10°51'9"
106°47'16’’
6.94
3.790.20
0.110.07
27.651.45
23.2414.59
G19
10°50'41"
106°44'2’’
6.17
0.870.10
0.120.07
6.340.70
23.5413.99
G20
10°50'50"
6.13
1.400.12
0.150.07
10.260.84
30.5815.20
21
106°44'39’’
Research highlights
We studied radon and radium levels of drinkable water supplies in the Thu Duc
region in Ho Chi Minh City, Vietnam and the health hazards
The majority of
222
Rn found in groundwater samples did not originate from
226
Ra
compounds soluble in water
The occurrence of elevated concentrations of
226
Ra in groundwater samples was
explained by pH and alkaline conditions.