Development of microextraction based techniques for quantification and behaviour characterization of nanoparticles in aquatic environments
Bạn đang xem bản rút gọn của tài liệu. Xem và tải ngay bản đầy đủ của tài liệu tại đây (5.98 MB, 257 trang )
DEVELOPMENT OF MICROEXTRACTION-BASED TECHNIQUES
FOR QUANTIFICATION AND BEHAVIOR CHARACTERIZATION
OF NANOPARTICLES IN AQUATIC ENVIRONMENTS
SEYED MOHAMMAD MAJEDI
NATIONAL UNIVERSITY OF SINGAPORE
2014
DEVELOPMENT OF MICROEXTRACTION-BASED TECHNIQUES
FOR QUANTIFICATION AND BEHAVIOR CHARACTERIZATION
OF NANOPARTICLES IN AQUATIC ENVIRONMENTS
SEYED MOHAMMAD MAJEDI
(M.Sc., AMIRKABIR UNIVERSITY OF TECHNOLOGY)
A THESIS SUBMITTED
FOR THE DEGREE OF DOCTOR OF PHILOSOPHY
DEPARTMENT OF CHEMISTRY
NATIONAL UNIVERSITY OF SINGAPORE
2014
i
Thesis Declaration
I hereby declare that the work reported in this thesis is my original work
performed independently between 02/08/2010 and 01/06/2014. The current
thesis has been entirely written by me, and has not been submitted previously
for any degree in any university. I have duly acknowledged all the sources of
information which have been used in this thesis.
Some contents of the thesis have been published in:
[1] S.M. Majedi, B.C. Kelly, H.K. Lee, Combined effects of water temperature
and chemistry on the environmental fate and behavior of nanosized zinc oxide,
Science of The Total Environment 496 (2014) 585.
[2] S.M. Majedi, B.C. Kelly, H.K. Lee, Evaluation of a cloud point extraction
approach for the preconcentration and quantification of trace CuO
nanoparticles in environmental waters, Analytica Chimica Acta 814 (2014) 39.
[3] S.M. Majedi, B.C. Kelly, H.K. Lee, Role of combinatorial environmental
factors in the behavior and fate of ZnO nanoparticles in aqueous systems: A
multiparametric analysis, Journal of Hazardous Materials 264 (2014) 370.
[4] S.M. Majedi, B.C. Kelly, H.K. Lee, Toward a robust analytical method for
separating trace levels of nano-materials in natural waters: Cloud point
extraction of nano-copper(II) oxide, Environmental Science and Pollution
Research 21 (2014) 11811.
ii
[5] S.M. Majedi, B.C. Kelly, H.K. Lee, Efficient hydrophobization and solvent
microextraction for determination of trace nano-sized silver and titanium
dioxide in natural waters, Analytica Chimica Acta 789 (2013) 47.
[6] S.M. Majedi, H.K. Lee, B.C. Kelly, Role of water temperature in the fate
and transport of zinc oxide nanoparticles in aquatic environment, Journal of
Physics: Conference Series 429 (2013) 012039, DOI: 10.1088/1742-
6596/429/1/012039.
[7] S.M. Majedi, H.K. Lee, B.C. Kelly, Chemometric analytical approach for
the cloud point extraction and inductively coupled plasma mass spectrometric
determination of zinc oxide nanoparticles in water samples, Analytical
Chemistry 84 (2012) 6546.
Seyed Mohammad Majedi
12 August 2014
iii
Acknowledgements
My first and foremost gratitude goes to my supervisor, Professor Hian Kee
Lee, for his continuous and unconditional support of my Ph.D. study and
research, invaluable suggestions, and for his patience and encouragement.
Under his guidance, I learnt how to do research independently, and gained a
number of valuable experiences. My sincere thanks also go to my co-
supervisor, Assistant Professor Barry C. Kelly from Department of Civil and
Environmental Engineering, for his kind support and precious comments
throughout the research. I also gratefully acknowledge the Agency for
Science, Technology and Research (A STAR), Singapore, for the award of a
research scholarship.
I would like to express my special thanks to my colleagues, Dr Hong
Zhang, Dr Liang Guo, Dr Yufeng Zhang, Dr Dandan Ge, Mr Nyi Nyi Naing,
Ms Ruyi Xu, Ms Zhenzhen Huang, Ms Claire Anne Taylor, Ms Maryam
Lashgari, and Mr Sheng Tang, and all my friends, for their help and advice
during my candidature.
I am also grateful to Mdm Lim Guek Choo, Frances and Ms Per Poh
Geok (NUS Environmental Research Institute), Dr Liu Qiping (Depratment of
Chemistry), Mr Sukiantor Bin Tokiman, Mr Mohamed Sidek Bin Ahmad, and
Ms Chia Yuit Ching, Susan (Temasek Lab, Department of Civil and
Environmental Engineering), Dr. Jixuan Zhang and Ms Fengzhen Yang
(Transmission Electron Microscopy Lab, Department of Material Science and
iv
Engineering), and many other staff and laboratory technologists at the
Department of Chemistry, for their kind help and assistance.
Last but not the least, my deep appreciations go to my wife, Ms Samaneh
Tavakolinia, for her endless love, support, and motivation, and my beloved
little daughter, Arghavan, for making my student life joyful, and my dear
parents, sisters, and the rest of my family, for their understanding, tolerance,
and supporting me spiritually.
v
Table of Contents
Thesis declaration i
Acknowledgements iii
Table of Contents v
Summary x
List of Tables xiii
List of Figures xv
List of Abbreviations xxi
Chapter 1 Introduction 1
1.1 Application and environmental implications of NPs 4
1.1.1 Application 4
1.1.2 Transformation in the environment 8
1.1.3 Toxicity 10
1.2 Identification and characterization of NPs 12
1.2.1 Microscopic techniques 13
1.2.2 Laser-based techniques 14
1.2.3 X-ray-based techniques 15
1.2.4 Surface charge and area analysis 16
1.3 Separation of NPs in aqueous media 17
1.3.1 Ultrafiltration and ultracentrifugation 17
1.3.2 Field-flow fractionation 19
vi
1.3.3 Size exclusion chromatography 20
1.3.4 Electrophoresis 20
1.3.5 Two-phase separation 21
1.3.5.1 Liquid-liquid extraction 21
1.3.5.2 Cloud point extraction 23
1.4 Quantification of NPs 26
1.4.1 Elemental analysis 27
1.4.1.1 Inductively coupled plasma-mass spectrometry 27
1.4.1.2 Atomic absorption spectrometry 31
1.4.2 Electroanalytical methods 32
1.4.3 Spectroscopic methods 33
1.5 Objectives and scope of the study 35
Chapter 2 Evaluation of a cloud point extraction for quantification of
trace levels of copper(II) oxide nanoparticles in water 39
2.1 Introduction 39
2.2 Materials and methods 42
2.2.1 Chemicals 42
2.2.2 Cloud point extraction 44
2.2.3 Microwave digestion and elemental analysis 44
2.2.4 Dissolution and adsorption experiments 47
2.2.5 Preparation of coated CuO NPs 48
2.2.6 Characterization of CuO nanoparticles 49
2.3 Results and discussion 50
vii
2.3.1 Enrichment factor 50
2.3.2 Sample pH 53
2.3.3 Incubation conditions 57
2.3.4 Environmental interferences 61
2.3.5 Coating chemical 67
2.3.6 Sample analysis 73
2.3.7 Method validation 77
2.3.8 Genuine water sample analysis 79
2.4 Conclusion 81
Chapter 3 Surface modification and solvent microextraction of trace
silver and titanium dioxide nanoparticles in water 83
3.1 Introduction 83
3.2 Materials and methods 86
3.2.1 Chemicals 86
3.2.2 Surface functionalization, solvent extraction, and measurement of
NPs 90
3.2.3 Characterization of Ag and TiO
2
NPs 92
3.2.4 Selection of reagent type by experimental design 93
3.3 Results and discussion 96
3.3.1 Preliminary optimization 96
3.3.2 Effects of pertinent parameters 98
3.3.3 Effects of ultrasonication and centrifugation 103
3.3.4 Effects of NP size and concentration 105
viii
3.3.5 Effects of environmental factors 107
3.3.6 Characterization of Ag and TiO
2
NPs 114
3.3.7 Method validation 125
3.3.8 Separation of Ag and TiO
2
NPs in natural waters 126
3.4 Conclusion 131
Chapter 4 Combined effects of environmental factors on the behavior and
fate of zinc oxide nanoparticles in aquatic environments 133
4.1 Introduction 133
4.2 Materials and methods 136
4.2.1 Chemicals 136
4.2.2 Sample preparation 137
4.2.3 NPs characterization, aggregation and sedimentation
measurements 138
4.2.4 Released zinc ion measurement 140
4.2.5 Multiparametric approach 141
4.2.6 Temperature dependence study 145
4.3 Results and discussion 145
4.3.1 ZnO NP aggregation 145
4.3.2 ZnO NP dissolution 156
4.3.3 Effect of temperature on ZnO NP aggregation and dissolution 160
4.4 Conclusion 164
ix
Chapter 5 Role of water temperature and chemistry in the environmental
fate and behavior of zinc oxide nanoparticles 166
5.1 Introduction 166
5.2 Materials and methods 169
5.2.1 Chemicals 169
5.2.2 Sample preparation 170
5.2.3 Characterization of ZnO NPs 172
5.2.4 Dissolution experiment 174
5.2.5 Adsorption of NOM and Zn
2+
175
5.2.6 Statistical approach 176
5.3 Results and discussion 176
5.3.1 Aggregation 176
5.3.2 Surface charge of ZnO NPs 183
5.3.3 Dissolution kinetics 185
5.3.4 Adsorption of NOM and Zn
2+
188
5.3.5 Environmental implications 192
5.4 Conclusion 193
Chapter 6 Conclusions and future work 196
References 203
List of publications 228
Conference presentations 229
x
Summary
Engineered nanomaterials (ENMs) contribute significantly to improving
human life through extensive applications in industrial and consumer products,
thanks to their unique physicochemical and optoelectronic properties.
Concomitantly, the environmental levels of ENMs are increasing due to their
occurrence in waste streams such as wastewaters and landfill leachates, and
emissions from e.g., industrial flue-gas stacks and incinerators as a result of
combustion. While high bioavailability and toxicity of these materials to living
organisms are of particular concerns according to the literature, there are few
analytical techniques to characterize and quantify trace environmental
concentrations of ENMs in real matrices. ENMs exhibit different behavior and
fate in the environment, and this can subsequently influence their detection
and identification. Furthermore, the sample matrix itself may directly interfere
with the trace analysis of ENMs. As such, robust sample preparation and
analytical approaches are needed. The current thesis has addressed some major
issues associated with the determination and characterization of ENMs in
water. A review of current knowledge about properties, application, toxicity,
and transformation of ENMs is provided in Chapter 1. The available methods
for characterization, separation, and quantification of these materials are also
briefly described in Chapter 1.
In Chapter 2, cloud point extraction (CPE) evaluated for the trace analysis
of copper(II) oxide nanoparticles (CuO NPs) is reported. Factors such as
Triton X-114 (TX-114) concentration, pH, incubation temperature and time,
xi
were optimized. For the first time, the effects of CuO NP behavior like
agglomeration, dissolution, and surface adsorption of natural organic matter,
copper(II) ions (Cu
2+
), and coating chemicals, on its recovery were studied.
The results indicated that all the CPE factors had significant effects on the
extraction efficiency. The detection limits for CuO NPs were 0.02 and 0.06 µg
L
-1
using these techniques, respectively.
In Chapter 3, the development of a solvent microextraction technique is
reported for the first time, for the separation of surface-functionalized silver
(Ag) and titanium dioxide (TiO
2
) NPs in natural water samples. Five NP
surface modification and solvent extraction agents (reagents) types,
mercaptocarboxylic acid, alkylamine, mediator solvent, extraction solvent, and
surfactant, were investigated and optimized with three-level orthogonal array
design (OAD), an OA
27
(3
13
) matrix. The most favorable reagents and
experimental conditions were then examined. Based on the results, efficient
ligand exchange and acid–base pair formation were observed on the NP
surface without significant change in the original properties of the NPs.
Detection limits of ICP-MS analyses of Ag and TiO
2
NPs were 0.02 and 0.07
µg L
-1
, respectively.
In Chapter 4, we describe a multivariate approach that was employed to
investigate the role of combinatorial environmental factors in the behavior and
fate of zinc oxide (ZnO) NPs in aqueous systems. The effects of six co-
varying environmental factors, organic acid type, organic acid concentration,
NP concentration (water temperature for dissolution study), pH, salt content,
and electrolyte type, on the aggregation and dissolution of ZnO NPs were
studied using an OA
27
(3
13
) matrix. The results showed that the organic acid
xii
concentration and the pH were the most significant factors (p <0.001)
influencing aggregation and dissolution of ZnO NPs, respectively. This
approach demonstrates that the behavior of ZnO NP may vary substantially
under combinatorial conditions.
In Chapter 5, a comprehensive study is reported on the effects of water
temperature on the dynamic behavior and fate of ZnO NPs in US
Environmental Protection Agency (EPA) synthetic water samples containing 2
mg C/L of humic acid as a natural organic matter surrogate (NOM), at the
temperature range of between 4
°
C and 45
°
C, representing very cold to warm
freshwaters with varying pH and hardness. The results showed that water
chemistry had more pronounced effects than the temperature on the rate of
ZnO NP aggregation. With increase of the water temperature, the NP surface
potential, dissolution and surface adsorption of NOM and zinc ions declined.
This study provides useful information for assessing environmental risks of
ZnO NPs in aqueous matrices with various water chemistries and
temperatures.
The results presented in the current thesis indicate that the robustness of
an analytical approach applied for the detection, determination, and behavior
characterization of ENMs in water, relies on the preservation of the original
properties of ENMs, and resembling of the environmentally-relevant
conditions, that can be potentially applied to natural waters.
xiii
List of Tables
Table 1-1 Annual production quantities of ten ENPs (ton/year)
Table 1-2 Product distribution based on the use of TiO
2
, ZnO, Ag, and CuO
NPs
Table 1-3 L(E)C
50
values (mg/L)
a
of Ag, CuO, ZnO NPs and their
corresponding salts for organisms (MIC for bacteria)
Table 1-4 Separation techniques available for nano- and submicron sized
particles
Table 1-5 Chemical structures and properties of two common nonionic
surfactants
Table 2-1 Summary of CuO nanoparticle properties
Table 2-2 Operating conditions of ICP-MS
Table 2-3 Optimized graphite furnace temperature program
Table 2-4 Assignment of peaks in the FTIIR spectra (Figure 2-11)
Table 2-5 ICP-MS analysis of CuO NPs in spiked genuine water samples
Table 3-1 Assignment of peaks in the FTIIR spectra (Figure 3-1)
Table 3-2 Characteristics of natural water samples
Table 3-3 Assignment of factors and their level values in the OA
27
(3
13
)
matrix
Table 3-4 OA
27
(3
13
) matrix with extraction efficiency (%) as response
Table 3-5 ANOVA for experimental responses in the OA
27
(3
13
) matrix
Table 3-6 Optimization steps and their corresponding experimental conditions
xiv
Table 3-7 Extraction efficiencies and TEM sizes of commercial Ag NP
dispersions
Table 3-8 Assignment of peaks in the FTIR spectra (Figure 3-18)
Table 3-9 ICP-MS analysis of Ag and TiO
2
NPs in spiked natural water
samples
Table 4-1 Summary of ZnO nanoparticle properties
Table 4-2 Assignment of factors and their level values in the OA
27
(3
13
)
matrix (aggregation study)
Table 4-3 Assignment of factors and their level values in the OA
27
(3
13
)
matrix (dissolution study).
Table 4-4 OA
27
(3
13
) matrix with hydrodynamic diameter (nm) after 24 h as
response
Table 4-5 OA
27
(3
13
) matrix with released Zn
2+
(mg/L) after 48 h as response
Table 4-6 ANOVA for experimental responses of aggregation study in the
OA
27
(3
13
) matrix (at the 95% confidence level)
Table 4-7 ANOVA for experimental responses of solubility study in the OA
27
(3
13
) matrix (at the 95% confidence level)
Table 5-1 Summary of ZnO nanoparticle properties
Table 5-2 Characteristics of synthetic freshwater samples
Table 5-3 Summary of one-way ANOVA of influence of water temperature
on the behavior and fate of ZnO nanoparticles in the synthetic freshwaters
Table 5-4 Dissolution rate coefficient (k) of ZnO NPs in different synthetic
freshwater samples as a function of temperature
xv
List of Figures
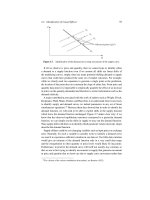
Figure 1-1 Behavior and fate of ZnO NPs in cold and warm waters.
Figure 1-2 Mechanism of cloud point extraction of ZnO NPs and their
characterization.
Figure 2-1 Effects of TX-114 concentration on the extraction efficiency
(circle) and hydrodynamic diameter (asterisk) (a), and enrichment factor
(triangle) and surfactant-rich phase volume (square) (b), for 100 µg L
-1
CuO
NPs at pH 8.5 and incubation at 40
°
C for 45 min. Error bars represent standard
deviations of three independent replicates.
Figure 2-2 TEM images of CuO NPs (top) before extraction (left), and after
extraction into TX-114-rich phase (right), and their respective particle size
distribution histograms (bottom).
Figure 2-3 Effects of sample pH on the extraction efficiency (circle) and zeta
potential (triangle) (a), and release of Cu
2+
(diamond) (b), for 100 µg L
-1
CuO
NPs with 0.2% w v
-1
of TX-114 and incubation at 40
°
C for 45 min. Error bars
show standard deviations of triplicate measurements.
Figure 2-4 Effects of pH on the extraction efficiency (circle) and
hydrodynamic diameter (asterisk) of 100 µg L
-1
CuO NPs with 0.2% w v
-1
of
TX-114 and incubation at 40
°
C for 45 min. Error bars represent standard
deviations of triplicate measurements.
Figure 2-5 Effects of incubation temperature (a), and incubation time (b), on
the extraction efficiency (circle) and release of Cu
2+
(triangle and diamond),
for 100 µg L
-1
CuO NPs with 0.2% w v
-1
of TX-114 , pH 9.0, incubation time
of 45 min (a), and incubation temperature of 40
°
C (b). Error bars indicate
standard deviations (n = 3).
Figure 2-6 TEM images of nanosized zero-valent copper particles before
extraction (left), and after extraction into TX-114-rich phase (right).
Figure 2-7 Effect of DOC concentration on the extraction efficiency without,
and with pre-treatment with 3% w v
-1
H
2
O
2
(under optimum CPE conditions),
and effect of DOC concentration on the amount of NOM adsorption (circle),
for 100 µg L
-1
CuO NPs. Error bars show standard deviations of three
replicates.
xvi
Figure 2-8 Effects of H
2
O
2
concentration on the extraction efficiency of 100
µg L
-1
CuO NPs (under optimum CPE conditions) (circle), and DOC
concentration (after 6 h) (square), in the samples containing 20 mg C L
-1
of
humic acid. Error bars show standard deviations of three replicates.
Figure 2-9 Effect of Cu
2+
concentration on the extraction efficiency without,
and with the addition of 10 mM EDTA (under optimum CPE conditions), and
effect of Cu
2+
concentration on the amount of its adsorption on the NP surface
(circle), for 100 µg L
-1
CuO NPs. Error bars represent standard deviations of
triplicate measurements.
Figure 2-10 Effects of EDTA concentration on the extraction efficiency
(under optimum CPE conditions) (circle) and amount of Cu
2+
adsorption
(triangle), in the samples containing 100 µg L
-1
CuO NPs and 1000 µg L
-1
Cu
2+
. Error bars represent standard deviations of triplicate measurements.
Figure 2-11 FTIR spectra of bare CuO NPs, pure citric acid and citrate-coated
CuO NPs (top), pure PVP10 and PVP-coated CuO NPs (middle), and pure
PEG 10,000 and PEG-coated CuO NPs (bottom). Each illustration shows the
respective spectra of bare CuO NPs (bottom), pure coating chemical (middle),
and coated CuO NPs (top).
Figure 2-12 Zeta potentials (top), and extraction efficiencies (bottom), of
coated CuO NPs as a function of pH in the presence of 10 mM NaCl. Error
bars represent standard deviations of triplicate measurements.
Figure 2-13 Effects of coating chemical and NaCl addition on the extraction
efficiency of 100 µg L
-1
CuO NPs under optimum CPE conditions. For all
types of CuO NPs, the difference between the extraction efficiencies with 10
mM and 30 mM NaCl is insignificant (p > 0.05). Error bars show standard
deviations of three independent replicates.
Figure 2-14 Optimization of graphite furnace pyrolysis temperature at the
atomization temperature of 2000
°
C (a), and atomization temperature at the
pyrolysis temperature of 1200
°
C (b), for the analysis of 10 µg L
-1
CuO NPs
extracted under optimum CPE conditions.
Figure 2-15 Measured extraction efficiencies of 20 µg L
-1
CuO NPs as a
function of TX-114 concentration, determined by ICP-MS and GF-AAS after
treatment of the extracted samples. Asterisk indicates significant difference (p
<0.01). Error bars represent standard deviations (n = 3).
Figure 3-1 FTIR spectra of pure and citrate-stabilized TiO
2
NPs at pH 4.0.
xvii
Figure 3-2 Effects of significant factors (p <0.05) at three levels (refer also
Table 3-4) on the extraction efficiency (average of responses ± SD) at the
preliminary step of optimization.
Figure 3-3 Effects of variations of influential factors on extraction efficiency
of Ag NPs. (A) Effects of sample pH on zeta potential and extraction
efficiency. (B) Effect of 11-MUA adsorption time. (C) Effect of TOAB
concentration. (D) Effect of 11-MUA concentration. (E) Effect of ODA to 11-
MUA mole ratio. (F) Effect of mediator solvent volume. (G) Effects of
extraction solvent volume on enrichment factor and extraction efficiency of
Ag NPs.
Figure 3-4 Effects of ultrasonication (top), and centrifugation time (bottom),
on the extraction efficiency of Ag NPs.
Figure 3-5 Photograph of 50 mg L
-1
of 11-MUA-functionalized TiO
2
NP
suspension before (A), and after (B), addition of ODA. The white layer in B
contains NP-incorporated flocs.
Figure 3-6 Effect of coating chemical on the extraction efficiencies of 1 mg L
-
1
Ag and TiO
2
NPs.
Figure 3-7 Effect of dissolved organic carbon on the extraction efficiency of 1
mg L
-1
Ag NPs without/with pre-treatment with H
2
O
2
(top). Effect of Ag
+
on
the extraction efficiency of 1 mg L
-1
Ag NPs without /with addition of
Na
2
S
2
O
3
(bottom).
Figure 3-8 Effect of H
2
O
2
pre-treatment on the extraction efficiency of 1 mg
L
-1
Ag NPs in samples containing 20 mg C L
-1
humic acid as DOC (top).
Effect of Na
2
S
2
O
3
addition on the apparent extraction efficiency (bottom). To
samples of 5 mg L
-1
Ag
+
, 1 mg L
-1
Ag NPs and the ligand solution were
added.
Figure 3-9 Effect of salt content on the extraction efficiency of Ag NPs.
Figure 3-10 TEM images of 1 mg L
-1
Ag NP suspensions before (A, C, E),
and after (B, D, F), extraction into the organic phase, with 20 nm (A, B), 40
nm (C, D), and 60 nm (E, F) particle sizes. Insets in A and B are SAED
patterns.
Figure 3-11 SAED patterns with Bragg reflection planes of Ag (left), and
TiO
2
(right), NPs.
Figure 3-12 PSD histograms of 1 mg L
-1
Ag NP suspensions before (A, C, E),
and after (B, D, F), extraction into the organic phase, with 20 nm (A, B), 40
nm (C, D), and 60 nm (E, F) particle sizes.
xviii
Figure 3-13 TEM images of a mixture of 100 µg L
-1
citrate-stabilized Ag and
TiO
2
NPs with SAED patterns of TiO
2
NPs in aqueous phase (A), and organic
phase (B). EDS spectrum of the extracted NPs (C).
Figure 3-14 UV–visible spectra of 1 mg L
-1
Ag NPs (top), and 5 mg L
-1
TiO
2
NPs (bottom), before and after extraction into the organic phase (diluted by
cyclohexane), and after extraction in the aqueous phase.
Figure 3-15 Sedimentation plots of Ag NPs before and after extraction into
the organic phase (diluted by cyclohexane).
Figure 3-16 TEM image (left), and PSD histogram (right), of Ag NPs in the
organic phase after 30 days of storage.
Figure 3-17 UV–visible spectra of extracted 1 mg L
-1
Ag NPs in the organic
phase at different storage times (top), and the corresponding FWHM as a
function of storage time (bottom).
Figure 3-18 FTIR spectra of pure 11-MUA (solid sample), Ag NP-MUA
(adsorbed 11-MUA), and Ag NP-floc (adsorbed 11-MUA-ODA) (vacuum-
dried samples).
Figure 3-19 ATR-FTIR spectra of TiO
2
NP-MUA at different times (top), and
the normalized peak height corresponding to S–H stretch (2565 cm
-1
) as a
function of time (bottom).
Figure 3-20 TEM image of river water (canal II sample) spiked with 10 µg L
-1
of Ag and TiO
2
NPs after extraction into the organic phase (left), and EDS
spectrum of the organic phase (right).
Figure 4-1 Intensity-weighted aggregate size distribution of 100 mg/L ZnO
NPs in ultrapure water. The sample was passed through a 2-µm syringe filter
prior to DLS analysis.
Figure 4-2 Effect of three levels of significant factors (p <0.05) (refer also to
Table 4-2) on the averages of hydrodynamic diameter (HDD), indicated as r1,
r2, and r3 in Table 4-4.
Figure 4-3 Zeta potential of ZnO NP suspension (mean ± SD, n = 3) as a
function of pH in ultrapure water. The ionic strength was maintained at 3 mM
with NaCl.
Figure 4-4 Calculated net energy between two ZnO NPs for the selected
treatments (see Table 4-4) at 25
º
C. The maximum net NP-NP energy was
xix
given at 31.4 kT for R15. Inset shows effect of temperature on interaction
energy for R15.
Figure 4-5 Aggregation kinetics of 100 mg/L ZnO NPs for the selected runs at
room temperature (R3: pH = 9.0, oxalic acid (2 mg C/L), CaCl
2
(50 mM);
R15: pH = 6.0, humic acid (5 mg C/L), KCl (2 mM); R27: pH = 7.5, citric
acid (20 mg C/L), NaNO
3
(10 mM)). Error bars represent standard deviations
(n = 3).
Figure 4-6 TEM images of ZnO NPs under selected run conditions, R3 (left),
R15 (center), and R27 (right) (top), and radial distribution function for a
representative point in a nanoparticle under R15 conditions (bottom).
Figure 4-7 X-ray diffraction patterns of ZnO NPs at different pH exhibit
hexagonal wurtzite crystal structure.
Figure 4-8 Effect of three levels of significant factors (p <0.05) (refer also to
Table 4-3) on the averages of released Zn
2+
(mg/L), indicated as r1, r2, and r3
in Table 4-5.
Figure 4-9 Effect of incubation temperature on the HDD of 100 mg/L ZnO
NPs (mean ± SD, n = 3) for the selected runs after 24 h. The differences are
significant for R15 and R27 (F
2,6
(R15) = 20.70 and F
2,6
(R27) = 5.61; p
<0.05), and insignificant for R3 (F
2,6
= 3.12, p >0.05).
Figure 4-10 Sedimentation plots of 100 mg/L ZnO NPs for the selected runs
at different temperatures (measures at 5- and 10-min intervals) (R3: pH = 9.0,
oxalic acid (2 mg C/L), CaCl
2
(50 mM); R15: pH = 6.0, humic acid (5 mg
C/L), KCl (2 mM); R27: pH = 7.5, citric acid (20 mg C/L), NaNO
3
(10 mM)).
Figure 4-11 Dissolution kinetics of 100 mg/L ZnO NPs for the selected runs
at 15
°
C (a), 25
°
C (b), and 35
°
C (c) (R3: pH = 9.0, oxalic acid (2 mg C/L),
CaCl
2
(50 mM); R15: pH = 6.0, humic acid (5 mg C/L), KCl (2 mM); R27: pH
= 7.5, citric acid (20 mg C/L), NaNO
3
(10 mM)). Error bars represent standard
deviations (n = 3).
Figure 5-1 (a) TEM images of ZnO aggregates in the VSW (top), MHW
(middle), and VHW (bottom) samples. (b) Sedimentation plots of ZnO NP
suspension in different synthetic freshwater samples (measures at 5- and 10-
min intervals), presenting average time-resolved optical absorbency measured
by UV‒visible spectrophotometer. (c) Kinetics of ZnO NP aggregation in the
VSW (top), MHW (middle), and VHW (bottom) samples at different
temperatures, showing the time-dependent average hydrodynamic diameters
determined by dynamic light scattering analyzer. Error bars (representing the
standard deviations of triplicate measurements) are not shown for clarity.
xx
Figure 5-2 Effect of temperature on the average polydispersity index of ZnO
NPs in various synthetic freshwater samples, calculated by using the DLS
instrument. Asterisk (*) indicates significant difference from control (at 25
°
C)
(p <0.05). Error bars represent standard deviations of triplicate measurements.
Figure 5-3 Intensity-normalized aggregate size distribution of ZnO NPs at 45
°
C in different synthetic freshwater samples.
Figure 5-4 Effect of temperature ramp rate on the aggregation kinetics of ZnO
NPs in the VSW (a), MHW (b), and VHW (c) samples. The target temperature
is 45
°
C. Data show the time-dependent average hydrodynamic diameters
determined by dynamic light scattering analyzer. Error bars (indicating the
standard deviations of triplicate measurements) are not shown for clarity.
Figure 5-5 Effect of temperature on the ζ-potential of ZnO NPs (average
value) in the synthetic freshwater samples (containing 2 mg C/L of humic
acid), determined by ζ-potential analyzer. Error bars show standard deviations
of three independent replicates.
Figure 5-6 Dissolution kinetics of ZnO NPs in various synthetic freshwater
samples at 4
°
C (a), 25
°
C (b), and 45
°
C (c), showing the time-dependent
average dissolved zinc concentration measured by ICP-OES/ICP-MS. Error
bars represent standard deviations of triplicate measurements.
Figure 5-7 Effects of temperature on the amount of NOM (a) and Zn
2+
(c)
adsorption on ZnO NP surface after 24 h in the synthetic water samples, and
their related van’t Hoff plots (b,d). The spiked levels of NOM, Zn
2+
, and ZnO
NPs are 2 mg C/L, 2 mg/L, and 20 mg/L, respectively. Data represent the
average values measured by TOC analyzer (in (a)) and ICP-OES/ICP-MS (in
(c)), and error bars show standard deviations of three independent replicates.
xxi
List of Abbreviations
A4F
Asymmetric flow field flow fractionation
AAS
Atomic absorption spectrometry
AFM
Atomic force microscopy
ANOVA
Analysis of variance
ATR
Attenuated total reflectance
BET
Brunauer-Emmett-Teller
C
60
Fullerene
CCC
Critical coagulation concentration
CCD
Charge-coupled device
CE
Capillary electrophoresis
CLSM
Confocal laser scanning microscopy
CMC
Critical micelle concentration
CNT
Carbon nanotube
CPC
Condensed particle counting
CPE
Cloud point extraction
CPT
Cloud point temperature
CTAB
Cetyl trimethylammonium bromide
DCHA
Dicyclohexylamine
DDA
Dodecylamine
DLLME
Dispersive liquid-liquid microextraction
DLS
Dynamic light scattering
xxii
DLVO
Derjaguin–Landau–Verwey–Overbeek
DMA
Differential mobility analysis
DNA
Deoxyribonucleic acid
DO
Dissolved oxygen
DOC
Dissolved organic carbon
EC
50
Median effective concentration
EDL
Electric double layer
EDS
Energy-dispersive X-ray spectroscopy
EDTA
Ethylenediaminetetraacetic acid
EHS
Environmental Health and Safety
en
Ethylenediamine
ENP
Engineered nanoparticles
EPA
Environmental Protection Agency
ET-AAS
Electrothermal atomic absorption spectrometry
FAAS
Flame atomic absorption spectrometry
FCS
Fluorescence correlation spectroscopy
FFF
Field flow fractionation
FITC
Fluorescein isothiocyanate
FlFFF
Flow field flow fractionation
FTIR
Fourier transform infrared
FWHM
Full width at half maximum
GF-AAS
Graphite furnace atomic absorption spectrometry
HDC
Hydrodynamic chromatography
HDD
Hydrodynamic diameter
xxiii
HLB
Hydrophilic-lipophilic balance
HPLC
High performance liquid chromatography
ICP-MS
Inductively coupled plasma-mass spectrometry
ICP-OES
Inductively coupled plasma-optical emission spectrometry
IEP
Isoelectric point
IMS
Ion mobility spectrometry
ISE
Ion selective electrode
ISI
Institute for Scientific Information
ISO
International Organization for Standardization
LC
50
Median lethal concentration
LCST
Lower critical solution temperature
LIBD
Laser-induced breakdown detection
LIF
Laser induced fluorescence
LOD
Limit of detection
m/z
Mass-to-charge ratio
MALLS
Multi-angle laser light scattering
MHW
Moderately hard water
MIC
Minimal inhibitory concentration
MPA
Mercaptopropionic acid
MPC
Monolayer-protected cluster
MSA
Mercaptosuccinic acid
MUA
Mercaptoundecanoic acid
MW
Microwave
M
w
Weight-average molecular weight