Molecular simulation of gas permeation and separation in polymer membranes
Bạn đang xem bản rút gọn của tài liệu. Xem và tải ngay bản đầy đủ của tài liệu tại đây (3.47 MB, 160 trang )
MOLECULAR SIMULATION OF GAS
PERMEATION AND SEPARATION IN
POLYMER MEMBRANES
FANG WEIJIE
NATIONAL UNIVERSITY OF SINGAPORE
2012
ii
DECLARATION
I hereby declare that this thesis is my original work and it has
been written by me in its entirety. I have duly
acknowledged all the sources of information which have
been used in the thesis.
This thesis has also not been submitted for any degree in any
university previously.
Fang Weijie
12-Dec-2012
iii
MOLECULAR SIMULATION OF GAS
PERMEATION AND SEPARATION IN
POLYMER MEMBRANES
FANG WEIJIE
(B. Eng., Hebei University of Technology
M. Eng., Tianjin University)
A THESIS SUBMITTED
FOR THE DEGREE OF DOCTOR OF
PHILOSOPHY
DEPARTMENT OF CHEMICAL AND
BIOMOLECULAR ENGINEERING
NATIONAL UNIVERSITY OF SINGAPORE
2012
i
ACKNOWLEDGEMENTS
First and foremost, I would like to extend my deepest and sincerest appreciation to
my supervisor Professor Jiang Jianwen. His invaluable guidance, unwavering support
and encouragement have helped me develop in-depth understanding of my research
subject and overcome considerable difficulties during my Ph.D. program. Prof.
Jiang’s passion and meticulous attitude in scientific research have deeply inspired me
and set a wonderful example to me. I sincerely treasure this precious experience,
which will be extremely valuable for my future professional career.
I would like to convey my gratitude to Professor Neal Chung Tai-Shung for his
kind support for my Ph.D. study in the last four years. I would also like to express my
sincere thanks to National Research Foundation for financial support and also to
National University of Singapore for the opportunity to pursue my Ph.D. degree.
I would also like to extend my thanks to all my group members: Dr. Zhang Liling,
Dr. Luo Zhonglin, Dr. Hu Zhongqiao, Dr. Ravichandar Babarao, Dr. Anjaiah
Nalaparaju, Dr. Chen Yifei, Mr. Krishna Mohan Gupta, Mr. Huang Zongjun, Ms.
Zhang Kang, and Mr. Naresh Thota.
Finally, I am deeply indebted to my parents and friends for their love, support, and
encouragement during my Ph.D. program.
ii
TABLE OF CONTENTS
ACKNOWLEDGEMENTS i
TABLE OF CONTENTS ii
SUMMARY vi
LIST OF TABLES ix
LIST OF FIGURES xi
NOMENCLATURE xv
ABBREVIATIONS xviii
CHAPTER 1 INTRODUCTION 1
1.1 Polymers for Gas Permeation and Separation 1
1.2 Industrial Applications 3
1.3 Basic Concepts 5
1.3.1 Solution-Diffusion Mechanism 5
1.3.2 Free Volume 6
1.3.3 Permeability and Selectivity 7
1.4 Scopes and Outline of the Thesis 8
CHAPTER 2 LITERATURE REVIEW 10
2.1 Molecular Simulation Studies 10
2.2 Polymers of Intrinsic Microporosity 19
2.2.1 Experimental Studies 20
2.2.2 Simulation Studies 21
2.3 Polymeric Ionic Liquids 22
CHAPTER 3 SIMULATION METHODOLOGY 26
3.1 Interaction Potentials 26
iii
3.2 Force Fields 27
3.3 Monte Carlo Simulation 28
3.4 Molecular Dynamics Simulation 29
3.5 Technical Issues 30
3.5.1 Free Volume and Void Size Distribution 30
3.5.2 Radial Distribution Function 31
3.5.3 Mean Squared Displacement 32
CHAPTER 4 POLYMERS OF INTRINSIC MICROPOROSITY 33
4.1 Introduction 33
4.2 Models and Methods 34
4.2.1 Atomistic Models 34
4.2.2 Sorption and Diffusion 37
4.3 Results and Discussion 38
4.3.1 Membrane Characterization 38
4.3.2 Sorption 42
4.3.3 Diffusion 44
4.3.4 Permeation 49
4.4 Conclusions 50
CHAPTER 5 FUNCTIONALIZED POLYMERS OF INTRINSIC
MICROPOROSITY 52
5.1 Introduction 52
5.2 Models and Methods 54
5.2.1 Atomistic Models 54
5.2.2 Ab Initio Calculations 55
5.2.3 Sorption and Diffusion 56
iv
5.3 Results and Discussion 56
5.3.1 Membrane Characterization 56
5.3.2 Sorption 62
5.3.3 Diffusion 66
5.3.4 Permeation and Selectivity 68
5.4 Conclusions 69
CHAPTER 6 EFFECTS OF RESIDUAL SOLVENT ON MEMBRANE
STRUCTURE AND PERMEATION 71
6.1 Introduction 71
6.2 Models and Methods 72
6.2.1 Membrane Construction 72
6.2.2 Sorption and Diffusion of H
2
74
6.3 Results and Discussion 75
6.3.1 Membrane Characterization 75
6.3.2 Polymer-Solvent Interaction and Mobility 77
6.3.3 H
2
Sorption and Diffusion 81
6.4 Conclusions 83
CHAPTER 7 POLY(IONIC LIQUID) MEMBRANES FOR CO
2
CAPTURE 85
7.1 Introduction 85
7.2 Models and Methods 88
7.2.1 Atomistic Models 88
7.2.2 Gas Sorption and Diffusion 92
7.3 Results and Discussion 93
7.3.1 Densities, Solubility Parameters and Vaporization Enthalpies 93
7.3.2 Membrane Structural Properties 95
v
7.3.3 Membrane Dynamic Properties 97
7.3.4 Fractional Free Volumes and Void Size Distributions 99
7.3.5 Gas-Membrane Interactions 101
7.3.6 Sorption, Diffusion and Permeation 106
7.4 Conclusions 109
CHAPTER 8 CONCLUSIONS AND FUTURE WORK 112
8.1 Conclusions 112
8.1.1 PIMs 112
8.1.2 Functionalized PIMs 113
8.1.3 Effects of Residual Solvents 113
8.1.4 Polymeric ILs 114
8.2 Future work 115
BIBLIOGRAPHY 117
PUBLICATIONS 131
PRESENTATIONS 132
APPENDICES 133
vi
SUMMARY
Polymer membranes have been widely used in industry for gas separation and are
anticipated to play an increasingly important role in the development of new energy
and environmental technologies. To understand the relationship between polymer
structure and performance, deep insights into membrane properties such as chain
mobility, free volume distribution, gas diffusion and sorption are crucial. With ever-
growing computational power and advances in mathematical algorithms, molecular
simulation has become an indispensable tool for materials characterization,
screening and design. Through molecular simulation, this thesis aims to elucidate
gas permeation and separation in two classes of newly synthesized polymer
membranes, namely polymers of intrinsic microporosity (PIMs) and polymerized
ionic liquids (PILs). These polymer membranes have recently attracted considerable
interest because of their unique structures and properties; however, molecular-level
studies on their performance in gas permeation and separation are scarce. The major
content of the thesis consists of four parts.
1. Gas sorption, diffusion and permeation in two PIMs (PIM-1 and PIM-7) are
simulated to compare their performance. The voids in both PIMs have diameter up
to 9 Å and are largely interconnected. The solubility and diffusion coefficients are
correlated well with the critical temperatures and effective diameters of gases,
respectively. These molecular-based correlations can be used for the prediction of
other gases. For CO
2
/H
2
, CO
2
/O
2
, and CO
2
/CH
4
gas pairs, the simulated sorption,
diffusion, and permeation selectivities match fairly well with experimental data. The
quantitative microscopic understanding of gas permeation and separation in the two
PIMs is useful for the new development of polymer membranes with high
permeability and selectivity.
vii
2. Permeation and separation of CO
2
and N
2
are examined in PIM-1 with various
functional groups (cyano, trifluoromethyl, phenylsulfone, and carboxyl). A robust
equilibration protocol is proposed to construct model membranes with predicted
densities very close to experimental data. Hydrogen bonds are observed to form
among carboxyl groups and contribute to the lowest fractional free volume in CX-
PIM. Ab initio calculations reveal that the interaction energies between CO
2
and
functional groups decrease as carboxyl > phenylsulfone > cyano > trifluoromethyl.
To evaluate the gas separation performance the diffusion selectivity, sorption
selectivity and permselectivity of CO
2
and N
2
were calculated. While the diffusion
selectivity of CO
2
/N
2
remains nearly constant, the sorption selectivity increases as
PIM-1 < TFMPS-PIM < CX-PIM; consequently, the permselectivity follows the
same hierarchy as the sorption selectivity. This study provides microscopic insight
into the role of functional groups in gas permeation and suggests strong CO
2
-philic
groups should be chosen to functionalize PIM-1 membrane for high-efficiency
CO
2
/N
2
separation.
3. The effects of residual solvent in PIM-1 on membrane structure and H
2
permeation are studied since it remains elusive how residual solvent specifically
interacts with PIM-1 membrane and affects membrane microstructure and
performance. The effects of residual solvents on the diffusion and sorption of
various gases are similar. Therefore, as a simple gas, H
2
is considered in this work.
The interaction energies of three solvents (CHCl
3
, CH
3
OH and H
2
O) with PIM-1 are
−16.3, −9.6 and −7.0 kcal/mol, respectively, in good agreement with experimental
data. The cyano and dioxane groups in PIM-1 interact preferentially with CH
3
OH
and H
2
O; however, carbon atoms interact more strongly with CHCl
3
. The mobility
of residual solvent decreases in the order of H
2
O > CH
3
OH > CHCl
3
. The solubility
and diffusion coefficients of H
2
were predicted to investigate the effects of residual
viii
solvents on gas permeation. The predicted solubility and diffusion coefficients of H
2
decrease in the same order, and they are in fairly good agreement with experimental
coefficients. This study provides quantitative understanding for microscopic
properties of residual solvent in a polymer membrane and reveals that residual
solvent plays a crucial role in tailoring membrane structure and gas permeation.
4. CO
2
capture is examined by simulation in four polymeric ionic liquids (PILs)
based on 1-vinyl-3-butylimidazolium ([VBIM]
+
) and four anions
bis(trifluoromethylsulfonyl)imide ([TF
2
N]
-
), thiocyanate ([SCN]
-
),
hexafluorophosphate ([PF
6
]
-
) and chlorine ([Cl]
-
). In addition, two ILs
[BMIM][TF
2
N] and [BMIM][SCN] based on 1-butyl-3-methylimidazolium
([BMIM]
+
) are also considered. The predicted densities, solubility parameters and
vaporization enthalpies of the PILs and/or ILs match well with experimental data. In
remarkable contrast to ILs, gas in PILs interacts with polycation more strongly than
with anion and thus the effect of anions on gas solubility is marginal. Therefore, the
gas solubilities predicted in poly([VBIM][TF
2
N]), poly([VBIM][PF
6
]),
poly([VBIM][SCN]) and poly([VBIM][Cl]) are close, which also agree well with
available measured data. Consistent with the increasing percentage of large voids,
gas diffusivities in the four PILs increase as poly([VBIM][Cl]) <
poly([VBIM][PF
6
]) < poly([VBIM][SCN]) < poly([VBIM][TF
2
N]). For CO
2
/N
2
separation, the sorption, diffusion and permeation selectivities from simulation and
experiment are consistent. The diffusion selectivities are approximately equal to one,
implying the separation is governed by sorption. This study provides atomistic
insight into the mechanisms of gas sorption, diffusion and permeation in [VBIM]
+
-
based PILs and suggests that polycation plays a dominant role in gas-membrane
interaction and governs separation performance.
ix
LIST OF TABLES
Table 1.1
Commercial polymer membranes for gas separation.
p4
Table 4.1
PIM-1 and PIM-7 model membranes.
p39
Table 4.2
Simulated and experimental solubility coefficients [cm
3
(STP)/cm
3
(polymer) bar] and diffusion coefficients [10
-
8
cm
2
/s] in PIM-1 and PIM-7 at 300 K. The experimental
pressure was approximately 200 mbar.
p41
Table 4.3
Critical temperature, kinetic diameters
k
d
, collision
diameters
c
d
, and effective diameters
eff
d
of H
2
, O
2
, CO
2
,
and CH
4
. The diameters are in angstrom (Å).
p44
Table 4.4
Sorption, diffusion, and permeation selectivities of CO
2
over H
2
, O
2
, and CH
4
in PIM-1 and PIM-7 at 300 K.
p50
Table 5.1
Simulated and experimental densities of PIM-1, TFMPS-
PIM and CX-PIM membranes.
p57
Table 5.2
Schematic structures and van der Waals volumes of
functional groups, and binding energies between CO
2
and
functional groups.
p59
Table 5.3
Solubility coefficients [cm
3
(STP)/cm
3
(polymer) bar],
diffusion coefficients [10
-8
cm
2
/s] and permeabilities
[barrer] of CO
2
and N
2
in PIM-1, TFMPS-PIM and CX-
PIM, respectively.
The experimental temperature and
pressure were 303 K and 0.2 bar, 298 K and 3.4 bar, 308 K
and 4 atm.
p64
Table 6.1
Physical properties of residue solvents.
p73
Table 6.2
Predicted densities and fractional free volumes of PIM-
1/solvent membranes.
p75
Table 6.3
Solubility coefficients S [10
−3
cm
3
(STP)/cm
3
cmHg] and
diffusion coefficients D (10
-8
cm
2
/s) of H
2
in PIM-1/solvent
membranes.
p81
Table 7.1
Atomic charges in [VBIM]
+
. The C8 and C9 atoms are the
head and tail to form polymeric [VBIM]
+
chain.
p89
Table 7.2
Atomic charges in [TF
2
N]
−
.
p89
Table 7.3
Atomic charges in [SCN]
−
.
p90
x
Table 7.4
Atomic charges in [PF
6
]
−
.
p90
Table 7.5
Atomic charges in [Cl]
−
.
p90
Table 7.6
Atomic charges in [BMIM]
+
.
p90
Table 7.7
The van der Waals interaction parameters (nonbonded 9-6)
and atomic partial charges for CO
2
and N
2
. The CO
2
and N
2
parameters were from the
PCFF and COMPASS,
respectively.
p92
Table 7.8
Densities (g/cm
3
) of [BMIM][TF
2
N], [BMIM][SCN],
poly([VBIM][TF
2
N]), poly([VBIM][SCN]),
poly([VBIM][PF
6
]) and poly([VBIM][Cl]) membranes. The
densities in ref. 274 and 275 are at 298.15 K. The density in
ref. 190 is at 301.15 K. All the simulated densities are at
300 K.
p94
Table 7.9
Solubility parameters δ [(J/cm
3
)
0.5
] and vaporization
enthalpies
vap
H∆
[kJ/mol] of [BMIM][TF
2
N] and
[BMIM][SCN] at 298 K and 1 atm.
p95
Table 7.10
Solubility coefficients [cm
3
(STP) cm
−3
(membrane) bar
−1
],
diffusivities [10
-8
cm
2
s
−1
] and permeabilities [barrer] of CO
2
and N
2
in [BMIM][TF
2
N], [BMIM][SCN],
poly([VBIM][TF
2
N]), poly([VBIM][SCN]),
poly([VBIM][PF
6
]) and poly([VBIM][Cl]) at 308 K. The
experimental measurements were at 308.15 K and 10 atm in
ref 190.
p107
Table 7.11
Sorption, diffusion and permeation selectivities of CO
2
/N
2
in [BMIM][TF
2
N], [BMIM][SCN], poly([VBIM][TF
2
N]),
poly([VBIM][SCN]), poly([VBIM][PF
6
]) and
poly([VBIM][Cl]) at 308 K. The experimental data are from
ref 190.
p109
xi
LIST OF FIGURES
Figure 1.1
Robeson upper bound 2008 for (a) CO
2
/N
2
(b)
O
2
/N
2
.
p2
Figure 1.2
Schematic representation of solution-diffusion
mechanism. The orange and blue spheres represent
gas molecules with different sizes.
p6
Figure 1.3
Penetrant diffusion in a polymer network from (a)
initial (b) next position.
p7
Figure 2.1
Schematic structure of PIM-1.
p20
Figure 3.1
Schematic representation of a void. The black dot
denotes particles in the simulation system.
p31
Figure 3.2
Schematic representation of radial distribution
function.
p31
Figure 4.1
Schematic synthesis processes and structures of
PIM-1 and PIM-7.
p34
Figure 4.2
Typical atomistic models of (a) PIM-1 and (b) PIM-
7. Color code: carbon, grey; nitrogen, blue; oxygen,
red; hydrogen, white.
p38
Figure 4.3
Void morphologies in (a) PIM-1 and (b) PIM-7 as
denoted by the blue regions. The grey regions are
polymer chains.
p40
Figure 4.4
Void size distributions in (a) PIM-1 and (b) PIM-7.
p40
Figure 4.5
Mean-squared displacements of polymer chains in
PIM-1 and PIM-7.
p41
Figure 4.6
Radial distribution functions of CO
2
and atoms in
PIM-1.
p42
Figure 4.7
Energy distribution of a single CO
2
molecule in
PIM-1 and PIM-7.
p43
Figure 4.8
Simulated solubility coefficients in (a) PIM-1 and
(b) PIM-7 as a function of critical temperature
c
T
.
p44
Figure 4.9
Representative displacement of a single gas
molecule as a function of time in PIM-7. The
p45
xii
trapped and jumping motions are schematically
indicated for O
2
.
Figure 4.10
Simulated diffusion coefficients in (a) PIM-1 and
(b) PIM-7 as a function of squared collision and
kinetic diameters.
p48
Figure 4.11
Simulated diffusion coefficients in (a) PIM-1 and
(b) PIM-7 as a function of squared effective
diameter.
p48
Figure 5.1
Structures of PIM-1, TFMPS-PIM and CX-PIM.
The fragmental structures within dotted lines were
saturated with hydrogen atoms and then used to
calculate the binding energies with CO
2
.
p54
Figure 5.2
Void morphologies in (a) PIM-1, (b) TFMPS-PIM
and (c) CX-PIM as denoted by the blue regions. The
grey regions are polymer networks.
p57
Figure 5.3
Void size distributions in PIM-1, TFMPS-PIM and
CX-PIM.
p58
Figure 5.4
Radial distribution function between hydrogen and
oxygen atoms of carboxyl groups in CX-PIM. The
inset demonstrates hydrogen bonds.
p59
Figure 5.5
Simulated wide angle X-ray diffractions (WAXDs)
in PIM-1, TFMPS-PIM and CX-PIM.
p61
Figure 5.6
Distances between spiro-carbon atoms in PIM-1. (a)
extended conformation (b) bended conformation.
Color code: oxygen, red; nitrogen, blue; carbon,
grey; hydrogen, white; spiro carbon, yellow.
p62
Figure 5.7
Optimized structures of CO
2
with functional groups
(a) cyano (b) trifluoromethyl (c) phenylsulfone and
(d) carboxyl. The scale of electrostatic potentials is
in atomic unit (a.u.). Color code: oxygen, red;
nitrogen, blue; carbon, grey; hydrogen, white;
fluorine, cyan; sulfur, yellow. The distance between
one oxygen atom in CO
2
and hydrogen atom in
carboxyl is 2.06 Å.
p63
Figure 5.8
Radial distribution functions for CO
2
around (a)
cyano, trifluoromethyl and phenylsulfone (b) cyano
and carboxyl.
p65
Figure 5.9
Correlations between diffusion coefficients of CO
2
and N
2
and fractional free volumes in PIM-1,
p67
xiii
TFMPS-PIM and CX-PIM.
Figure 5.10
Sorption, diffusion and permeation selectivities of
CO
2
/N
2
in PIM-1, TFMPS-PIM and CX-PIM.
p68
Figure 6.1
(a) Backbone of PIM-1 (the spiro carbons are
denoted by ‘C’). (b) Three dimensional simulation
box of PIM-1 membrane
(the box length is
approximately 31.8 Å).
p72
Figure 6.2
Void size distributions in PIM-1/solvent
membranes.
p76
Figure 6.3
Simulation snapshots of PIM-1 with 27 residual
water mol
ecules. (a) Initial structure with water
molecules randomly inserted in simulation box. (b)
Equilibrium structure after 5 ns simulation.
p77
Figure 6.4
Distributions of interaction energy E between a
single solvent molecule and PIM-1. The inset is the
ensemble averaged energy <E> versus the critical
volume of solvent.
p77
Figure 6.5
Radial distribution functions g(r) between solvent
molecules and (a) nitrogen atoms in cyano groups,
(b) oxygen atoms in dioxanes, (c) carbon atoms in
phenyl rings, and (d) spiro carbon atoms.
p79
Figure 6.6
Mean-squared displacements of solvent molecules
in PIM-1/solvent membranes.
p80
Figure 6.7
Mean-squared displacements of polymer chains in
PIM-1/solvent membranes.
p80
Figure 6.8
Mean-squared displacement of H
2
in PIM-1/solvent
membranes. The inset is in log-log scale.
p82
Figure 7.1
Chemical structures of [VBIM]
+
, [TF
2
N]
−
,
[BMIM]
+
, [SCN]
−
, [PF
6
]
-
and [Cl]
-
. The C8 and C9
atoms in [VBIM]
+
are the head and tail to form
polymeric [VBIM]
+
chain.
p87
Figure 7.2
Radial distribution functions in (a) [BMIM][TF
2
N]
(b) poly([VBIM][TF
2
N]).
p96
Figure 7.3
Radial distribution functions in (a) [BMIM][SCN]
(b) poly([VBIM][SCN]).
p96
Figure 7.4
Radial distribution functions in (a)
poly([VBIM][PF
6
]) (b) poly([VBIM][Cl]).
p97
xiv
Figure 7.5
MSDs of (a) [BMIM]
+
and [TF
2
N]
−
(b) [BMIM]
+
and [SCN]
−
.
p98
Figure 7.6
MSDs of C1, N1 atoms and anions in (a)
poly([VBIM][TF
2
N]) (b) poly([VBIM][SCN]) (c)
poly([VBIM][PF
6
]) (d) poly([VBIM][Cl]).
p98
Figure 7.7
Void morphologies in (a) [BMIM][TF
2
N] (b)
[BMIM][SCN] (c) poly([VBIM][TF
2
N]) (d)
poly([VBIM][SCN]) (e) poly([VBIM][PF
6
]) and (f)
poly([VBIM][Cl]) membranes. The blue regions are
voids and the grey regions are membrane networks.
p100
Figure 7.8
VSDs in [BMIM][SCN], [BMIM][TF
2
N],
poly([VBIM][SCN]), poly([VBIM][TF
2
N]),
poly([VBIM][PF
6
]) and poly([VBIM][Cl]).
p101
Figure 7.9
Radial distribution functions of CO
2
and N
2
in
[BMIM][TF
2
N]. (a) CO
2
-[BMIM]
+
(b) CO
2
-[TF
2
N]
−
(c) N
2
-[BMIM]
+
(d) N
2
-[TF
2
N]
−
.
p102
Figure 7.10
Radial distribution functions of CO
2
and N
2
in
[BMIM][SCN]. (a) CO
2
-[BMIM]
+
(b) CO
2
-[SCN]
−
(c) N
2
-[BMIM]
+
(d) N
2
-[SCN]
−
.
p103
Figure 7.11
Radial distribution functions of CO
2
and N
2
in
poly([VBIM][TF
2
N]) (a) CO
2
-poly[VBIM]
30+
(b) CO
2
-[TF
2
N]
−
(c) N
2
-poly[VBIM]
30+
(d) N
2
-
[TF
2
N]
−
.
p104
Figure 7.12
Radial distribution functions of CO
2
and N
2
in
poly([VBIM][SCN]) (a) CO
2
-poly[VBIM]
30+
(b) CO
2
-[SCN]
−
(c) N
2
-poly[VBIM]
30+
(d) N
2
-
[SCN]
−
.
p105
Figure 7.13
Radial distribution functions of CO
2
and N
2
in
poly([VBIM][PF
6
]) (a) CO
2
-poly[VBIM][PF
6
]
(b) N
2
-poly[VBIM][PF
6
].
p105
Figure 7.14
Radial distribution functions of CO
2
and N
2
in
poly([VBIM][Cl]). (a) CO
2
-poly[VBIM][Cl]. (b)
N
2
-poly[VBIM][Cl].
p105
xv
NOMENCLATURE
α Selectivity
β Reciprocal temperature, 1/k
B
T
γ Activity coefficient
δ Solubility parameter
ε Well depth of Lennard-Jones potential
ε
0
Permittivity of vacuum
θ Scattering angle or bond angle
λ Wavelength
µ Chemical potential
µ
ex
Excess chemical potential
ρ Density
φ Dihedral angle
χ Out-of-plane angle
a
Acceleration
b Langmuir affinity parameter or bond length
c Concentration
d d-spacing
d
c
Collision diameter
d
k
Kinetic diameter
d
eff
Effective diameter
k
B
Boltzmann constant, 1.38066 × 10
-23
J/K
k Elastic constant
k
D
Henry’s constant
xvi
l Membrane thickness
m Mass
p Pressure
Δp Pressure difference
q Atomic charge
r Distance between atoms, bond length or radius
r
Position of a particle
r
0
Equilibrium bond length
i
∆r
Displacement of a particle i
t Time
Δt Timestep
v
Molar volume
v
Velocity
C Penetrant concentration
'
H
C
Langmuir sorption capacity
D Diffusion coefficient
E Interaction energy
E
coh
Cohesive energy per mole
E
vac
Cohesive energy in vacuum
E
bulk
Cohesive energy in amorphous bulk state
i
F
Force
vap
H∆
Vaporization enthalpy
J Flux
K
H
Henry’s constant
L Membrane intrinsic coefficient
xvii
N Number of particles
P Permeability
R Universal gas constant
S Solubility coefficient
S
selectivity
Selectivity
T Temperature
T
c
Critical temperature
T
g
Glass transition temperature
U Potential energy
U
b
Bond-stretching potential
U
θ
Bond-bending potential
U
φ
Torsional potential
U
bonded
Intramolecular potential
U
k
Kinetic energy
U
p
Potential energy
U
non-bonded
Intermolecular potential
U
VDW
van der Waals potential
U
Q
Coulombic potential
V System volume
V
c
Critical volume
V
vdw
van der Waals volume
V
sp
Specific volume
xviii
ABBREVIATIONS
AMBER Assisted Model Building with Energy Refinement
CHARMM Chemistry at HARvard Macromolecular Mechanics
COMPASS Condensed-phase Optimized Molecular Potentials for
Atomistic Simulation Studies
CED Cohesive Energy Density
CFF Consistent Force Field
CFF91 Consistent Force Field 91
COF Covalent Organic Frameworks
CVFF Consistent Valence Force Field
DFT Density Function Theory
FFV Fractional Free Volume
GCMC Grand Canonical Monte Carlo
IL Ionic Liquid
LJ Lennard-Jones
MC Monte Carlo
MD Molecular Dynamics
MM Molecular Mechanics
MMFF93 Merck Molecular Force Field93
MMMs Mixed Matrix Membranes
MOFs Metal-organic Frameworks
MP2 Second order Møller–Plesset
MSD Mean Squared Displacement
xix
PALS Positron Annihilation Lifetime Spectroscopy
PC Polycarbonate
PCFF Polymer Consistent Force Field
PDMS Polydimethylsiloxane
PEEK Poly(ether-ether-ketone)
PEG Polyethylene glycol
PEI Polyetherimide
PET Poly(ethylene terephthalate)
PI Polyimide
PIM Polymer intrinsic microporosity
PIL Polymeric Ionic Liquid
PSf Polysulfone
PTMSP Poly[1-(trimethylsilyl)-1-propyne]
PVC Poly(vinyl chloride)
RDFs Radial Distribution Functions
SILM Supported Ionic Liquid Membrane
TST Transition State Theory
VSD Void Size Distribution
VVA Velocity Verlet Algorithm
WAXD Wide Angle X-ray Diffraction
[BMIM]
+
1-butyl-3-methylimidazolium
[VBIM]
+
1-vinyl-3-butylimidazolium
Poly[BIM]
+
poly[2-(1-butylimidazolium-3-yl)ethyl methacrylate]
+
Poly[MABI]
+
poly[1-[2-(methacryloyloxy)ethyl]-3-butyl-imidazolium]
+
Poly[VBBI]
+
poly[1-(p-vinylbenzyl)-3-butyl-imidazolium]
+
xx
Poly[VBI]
+
poly[1-(4-vinylbenzyl)-3-butylimidazolium]
+
Poly[VBTMA]
+
poly[(p-vinylbenzyl)trimethylammonium]
+
[TF
2
N]
−
Bis(trifluoromethylsulfonyl)imide
[BF
4
]
−
Tetrafluoroborate
[Cl]
−
Chlorine anion
[Sac]
−
o-benzoicsulphimide
[SCN]
−
Thiocyanate
[PF
6
]
−
Hexafluorophosphate
Chapter 1 Introduction
1
CHAPTER 1 INTRODUCTION
1.1 Polymers for Gas Permeation and Separation
Early observation of gas permeation in polymers can be traced back to the 19
th
century. In 1830’s, Mitchell first observed gas diffusion in a natural rubber [1]. After
approximately 30 years, Graham reported the first quantitative measurement of gas
permeation and proposed solution-diffusion model [2,3]. This model suggests that gas
flux is governed by sorption and diffusion, and has been widely used to elucidate gas
permeation process in polymer membranes. Later, Wroblewski quantitatively defined
the concept of permeability and discussed the relationship between gas permeability
and other factors such as flux, membrane thickness, and pressure gradient [4].
Furthermore, Wroblewski proved that permeability is equal to the product of
solubility and diffusivity. These early studies are the solid foundation for subsequent
studies of gas permeation and separation in polymer membranes.
Before 1950’s, most polymers investigated for gas permeation were natural rubbers.
The advent of synthetic polymers appeared in late 1950’s to 1970’s; thereafter,
synthetic polymers were systematically studied by examining the effects of molecular
mass, chemical structure, cross-linking, etc. It is worth to note that most polymers
considered during this period were rubbery polymers with low glass transition
temperatures (T
g
). However, rubbery polymers have low modulus and are not easy to
be fabricated into thin, self-supported, and pressure-resistant membranes. After
1970’s, advanced polymer materials appeared, particularly glassy polymers with high
T
g
. In general, glassy polymers exhibit higher gas selectivity than rubbery polymers
and attract more attention.
Chapter 1 Introduction
2
To choose a polymer membrane for gas separation, the following factors should be
considered: (1) high flux and high separation efficiency (2) good thermal resistant (3)
good mechanical strength (4) low cost and (5) engineering feasibility [5]. On this
basis, the commonly investigated polymers include polyimides (PIs), polysulfones
(PSfs), poly[1-(trimethylsilyl)-1-propyne] (PTMSP), polyphosphazenes,
polycarbonates, etc. Among these polymers, PTMSP has ultra-high gas permeability,
comparable to that of rubbery polymers, as attributed to the large free volume.
However, gas selectivity in PTMSP is exceptionally low.
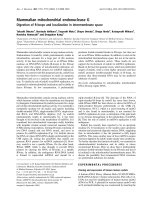
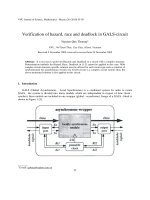
It has been well recognized that a polymer membrane with high permeability is
coupled with low selectivity, and vice versa. In this context, Robeson proposed an
‘upper bound’ or ‘trade-off’ between permeability and selectivity. The upper bound
was first reported in 1991 [6] and then revised in 2008 [7]. Each gas pair has a unique
upper bound, e.g., as shown in Figure 1.1 for CO
2
/N
2
and O
2
/N
2
. The upper bound
provides an empirical guidance on the performance of polymer membranes for gas
separation. A polymer membrane exhibiting good performance in separating one gas
pair usually also performs well another gas pairs. The α and P (defined in Section
1.3.3) represent gas selectivity and permeability, respectively.
Figure 1.1 Robeson upper bound 2008 for (a) CO
2
/N
2
(b) O
2
/N
2
.
(a) (b)
α
CO
2
/N
2
α
O
2
/N
2