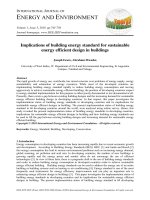
Costing energy efficiency improvements in buildings case study braşov, romania
Bạn đang xem bản rút gọn của tài liệu. Xem và tải ngay bản đầy đủ của tài liệu tại đây (1.12 MB, 14 trang )
INTERNATIONAL JOURNAL OF
ENERGY AND ENVIRONMENT
Volume 6, Issue 1, 2015 pp.47-60
Journal homepage: www.IJEE.IEEFoundation.org
ISSN 2076-2895 (Print), ISSN 2076-2909 (Online) ©2015 International Energy & Environment Foundation. All rights reserved.
Costing energy efficiency improvements in buildings
Case study: Braşov, Romania
Elena Eftimie
Department of Product Design, Mechatronics and Environment, Transilvania University of Braşov,
Eroilor 29, 500036, Romania.
Abstract
One of the methods of buildings' energetic streamline consists of reducing the thermal energy needs (i.e.
the building heating/cooling demand) at the level of building. In this regard, this study provides the
opportunity of performing a comparative analysis between the values of energy demand for space
heating/cooling, based on a case study in which for a building have been modified, at a time, the
insulation material of exterior walls, the thermopane windows and the roof insulation. To evaluate the
energy consumption in buildings, it is proposed an advanced hourly calculation method using
simulations with TRNSYS program, in order to obtain values as close to reality of the energy demand for
their space heating and cooling. It is envisaged that the use of building performance simulation programs
allow the modelling and computer simulation of building performance in order to obtain a solution that
to approximate to a large extent an actual case. Also it should be noted that the estimation and the
analysis of the building energy behaviour – still from the design phase or prior to its rehabilitation – is
more efficient and economical than solving problems in the use phase of the building.
Copyright © 2015 International Energy and Environment Foundation - All rights reserved.
Keywords: Building performance; Indoor thermal comfort; Low-energy buildings; Space
heating/cooling demand; TRNSYS.
1. Introduction
Globally, about 40% of the total energy consumption is represented by the thermal energy demand of
buildings. In addition, the construction sector is growing, which will lead to the increase of energy
consumption [1, 2]. The residential buildings and the trade ones (offices, commercial areas, hotels,
restaurants, schools, hospitals, gyms, indoor swimming pools) are the largest final consumers of energy,
particularly for heating, lighting, home appliances and equipment [1].
At present, the care for global energy depletion makes from the increasing of building energy efficiency
a necessary economical standard; so besides the aesthetic factors underlying the construction of a
building, it needs to be also designed from the point of view of energy efficiency.
A major objective of low energy buildings is to minimize the amount of external energy purchased –
providing indoor thermal comfort of occupants – regardless of the season and outdoor climatic
conditions [3]. Low energy buildings usually use a high level of insulation and energy efficient windows
to reduce heating and cooling demand, and obtaining of high energy efficiency.
The energy efficiency increase of buildings consists of a set of methods and techniques that consider
both the buildings as a whole, as well as that centres of energy exchange with the environment.
International Journal of Energy and Environment (IJEE), Volume 6, Issue 1, 2015, pp.47-60
ISSN 2076-2895 (Print), ISSN 2076-2909 (Online) ©2015 International Energy & Environment Foundation. All rights reserved.
48
Increasing the energy performance of a building can be achieved by different methods such as:
• at the building level by creating the indoor comfort conditions, respectively a good insulation of
walls and the use of windows with a high degree of thermal protection;
• increasing the performance of heating systems;
• increasing the performance of air conditioning systems and those concerning the electrical
installations.
This paper aims to analyze some of the most effective methods to improve the energy performance of a
building at construction level, namely:
• the thermal insulation of exterior walls, a method by which, once with the building envelopment it is
also provided an increase of their lifetime;
• the use of thermopane windows, preferably modern windows with triple-pane insulation glass
(glazed windows with double effect), that to assure the maintaining of heat indoor during the winter,
but also to prevent its excessive influx during summer;
• the thermal insulation of roofs with lightweight materials that do not load the building but ensure its
higher lifetime.
The objective of the study is to quantify by energy simulation, which are the values of the energy
demand for space heating and cooling, thus highlighting the differences between the energy
performances of a building in various embodiments; in this regard it will be achieved a comparative
analysis of energy demand values obtained by the use of three different types of insulation materials, by
replacing windows and by replacing the roof insulation. The exemplification will be performed by a case
study for a multi-zone building located in urban area of Braşov.
2. Materials and methods used
2.1 Possibilities to increase the energy efficiency of building
The best solution and the one with the best efficiency of heat gain and of heat carrier saving is the
insulation of whole building, both of the roof as well as of the basement, by which large amounts of heat
are lost.
The highest losses of a building are found in the field of thermal energy. For this reason, there are
required a number of additional measures that take into account the following aspects:
• the building thermal envelope must ensure the comfortable indoor climate with low energy
consumption, regardless of the season (both in warm seasons as well in the cold ones) [4-6];
• the windows must have a coefficient of thermal loss as low as possible and the highest solar gain, for
saving more energy;
• the proper insulation of the roof especially for buildings with a few floors.
For a detailed study of the energetic behaviour of buildings, the constructive properties and also the
materials for walls, ceilings, floors, windows and roof must be known.
2.1.1 Exterior walls insulation
As first method of rehabilitation of a building, the exterior walls insulation is considered. It is envisaged
that the thickness and quality of envelope have a significant influence on the amount of energy that is
lost due to excessive transfer between the inside and the outside thereof.
The insulation defects have as effects the heat losses during the winter (these causing the condensation
on inside walls) and the excessive power consumption of air-conditioning equipments in the summer.
One of the easiest methods to maintain the indoor thermal comfort of a building consists of the thermal
insulation that will reduce the costs for thermal energy [4].
The most commonly used insulation materials are the expanded polystyrene (EPS) and extruded
polystyrene (XPS).
To determine the most effective choice of polystyrene type, the following aspects must be considered:
• Expanded polystyrene (according to EN 13163 [7])
9 it can be used successfully in buildings located in areas with high humidity; the fungi, bacteria or
mould do not affect it.
9 the vapour permeability of the material, if it is mounted on the outside, does not favour the
"lock" of moisture between the polystyrene plate and the wall, thus the mould does not appears.
9 in the last years, while the price for the most construction materials has fluctuated much, the cost
of expanded polystyrene remained constant.
International Journal of Energy and Environment (IJEE), Volume 6, Issue 1, 2015, pp.47-60
ISSN 2076-2895 (Print), ISSN 2076-2909 (Online) ©2015 International Energy & Environment Foundation. All rights reserved.
49
• Extruded Polystyrene (in accordance with EN 13164[8])
9 it does not allow the vapour crossing, the humidity remains between the wall and the insulation
material and thus the condensation occurs;
9 reliability and high resistance to the destructive effects of nature;
9 high resistance to heat transfer when the temperature drops;
9 higher strength compared to of expanded polystyrene to chemical agents such as acids, alkalis,
alcohol and alcohol-based dyes, salt water, cement, asphalt etc.;
9 an extruded polystyrene plate exposed to sunlight, even if it changes its colour, it will not change
significantly its thermal insulation values.
Regardless of the used polystyrene type, its thickness influences the heat loss. The recommended
minimum thickness for insulation of facades is by 10cm; the thickness increase of polystyrene makes that
the investment to be more profitable in the long term [9].
Still the polystyrene – that does not allow the air crossing from the outside to the inside to save energy –
can represent a significant disadvantage; in a hermetically sealed building, energy is saved, but over time
the construction is not protected due to the mould occurrence and condensation.
In a building must exist transfer between the air from the inside – that has already been used – and the air
from the outside, but the polystyrene has not the property of being a good air conductive that to let
building "to breathe".
In these situations, there can be used new alternative materials, more efficient and even cheaper. In this
category are included, facade systems that includes insulation made of polyurethane.
• Polyurethane thermal insulation (in accordance with EN 13165 [10])
9 its heat transfer coefficient has a value of about 0.020 W/mK, compared to expanded polystyrene
that has a value of about 0.036 W/mK; (these values for both materials may vary depending on
the density of the material and the manufacturer);
9 it is resistant to damages caused by chemical substances; expanded polystyrene is sensitive to
petroleum-based solvents such as gasoline, several insect sprays and ordinary adhesives;
9 it has fireproof properties, it does not burn and does not sustain combustion;
9 it can be applied without interruption, eliminating the thermal bridges between the panels, on the
entire surface of building, regardless its size and form;
9 the properties of polyurethane foam in terms of soundproofing are far superior to those of
expanded polystyrene;
9 it has waterproofing properties that makes it from this point of view to be preferable compared to
polystyrene that can absorb and retain water, which can lead to increasing of the structure weight
on what this was mounted (in these situations, the detachment of insulation material may result).
2.1.2 New modern windows with triple-pane insulation glass (low-E)
The exterior windows are part of the building envelope so that in a rehabilitation process the
characteristics of windows are important.
The energy efficient glazed windows reduce the thermal energy consumption.
In the field of high quality windows, currently there were developed a number of modern technologies
that allow reducing costs for space heating. The current trend in this field is directed to windows with
triple-pane insulation glass [11]; these windows have double effect, respectively of maintaining the heat
indoors in winter but do not allow excessive influx from outside in summer.
2.1.3 Roof insulation
The thermal protection improvement of the roof represents an effective measure that can be applied to
existing buildings, in view of the rehabilitation and their thermal energy modernization.
The proper insulation of roof prevents heat loss, respectively energy, that occur at the roof level;
therefore its efficient thermal insulation is essential to ensure indoor thermal comfort of the building.
Providing an additional insulation layer for this construction element does not require major investments,
it is relatively simple to perform, and the investment recovery time is reduced.
A substantial increase in the thermal resistance of the roof is much more effective and appropriate if the
number of floors is more reduced.
International Journal of Energy and Environment (IJEE), Volume 6, Issue 1, 2015, pp.47-60
ISSN 2076-2895 (Print), ISSN 2076-2909 (Online) ©2015 International Energy & Environment Foundation. All rights reserved.
50
2.2 Computational methods
The energy performance simulation of building proposed to study was performed using transient analysis
software, TRNSYS (TRansient System Simulation) [12]. This software is dynamic simulation program
that benefits by a modular structure that makes possible its supplement with mathematical models.
The energy simulation was performed using the weather data recorded by a local weather station (Braşov
urban area) by implementing them in TRNSYS subroutines; it was considered the fact that to achieve an
energy calculation as accurately is important to have accurate weather data (solar radiation data, ambient
temperature, relative humidity, wind speed and direction).
Implementing the building model consisted of the following steps:
• the defining of thermal zones and their characteristics;
• the detailed specification of envelope elements for building, the optical properties of windows, the
working programme of the equipment;
• defining of the orientation for building and for glazed surfaces;
• the specification of infiltration due to leaks and the type of air conditioning;
• the specification of heating and cooling regimes (temperatures during the day and the night, supplied
heating power);
• specifying the internal gains distributed in the three components (persons, artificial lighting,
electrical devices);
• the detailed description of shading type.
3. Results and discussions
3.1 Case study
Energy calculation is applied for an office building of Transilvania University of Braşov; the building
has two floors with a built area of 260m
2
. The North and South oriented exterior walls of the second floor
are formed mostly from windows (Figure 1).
Zone II
Zone V
Zone VI
Zone I
Zone III
Zone IV
Figure 1. Sample of figure for the international journal of energy and environment
To define in detail the characteristics and the thermal behaviour of proposed building this was divided
into 6 thermal zones (Zone I: Entrance Hall, Zone II: Office (First Floor), Zone III: Bathroom, Zone IV:
Small Lobby, Zone V: Staircase; Zone VI: Second Floor), for each zone being possible to define a
different thermal regime.
The two offices are located each on one floor having each 10 occupants.
The occupants schedule was considered from 8.00 until 20.00 during the weekdays, from Monday to
Friday.
The control strategy for electronics apparatus from offices (PC, laptop, printer, and photocopier) was
defined according to the same schedule.
The artificial lighting scenario is the same as that for occupants activity, lighting being available from
8.00 to 20.00, during the days from Monday to Friday.
For setting of the heating requirements, the air temperature of the zone was set to 21°C during workday
and for the periods of night, Saturday and Sunday, the air temperature was set to 19°C.
Regarding the cooling control, for the set-point temperature above which the cooling is active, it was
considered a constant value of 25°C.
International Journal of Energy and Environment (IJEE), Volume 6, Issue 1, 2015, pp.47-60
ISSN 2076-2895 (Print), ISSN 2076-2909 (Online) ©2015 International Energy & Environment Foundation. All rights reserved.
51
The air flow from outside into the building zones was specified by defining the type of infiltrations [12,
13]. The air change rate of the infiltration was considered as having a value of 0.5 1/h for the following
thermal zones: Entrance Hall, Bathroom, Small Lobby, First Floor, respectively 0.3 1/h for the Second
Floor and Staircase (it is considered that airing takes place only during work schedule).
TRNSYS simulations were performed for specific climatic conditions of Braşov urban area (Romania);
thus the meteorological database implemented in TRNSYS subroutines contains the data monitored
using a local Weather Station (Delta T) placed near the building subjected to analysis.
The geographic coordinates of Braşov are 23.1° East longitude and 45.5° North latitude, this area being
characterized by a climate profile of continental temperate type.
The proposed simulations were performed for the same configuration of building, during the same time
period, but this being affected by a series of successive modifications. Therefore, the simulated model is
a transformation of an existing reference building into a low energy building.
Thus, Table 1 shows the building variants for which the simulations were made respectively using three
types of insulation materials (and different thicknesses) for exterior walls, different types of windows
(double-pane insulation glass (low-E) and triple-pane insulation glass (low-E)) and two different types of
thermal insulation of the roof.
Table 1. Building variants for which the energy simulations were carried out
Variant Characteristics Energy demand for
space heating (kWh/m
2
/ year)
Reference
building
v
0
- building without insulation of the exterior walls; u-value for
exterior walls, 0.908 W/(m
2
K);
- exterior windows with a standard spacer and a standard
double pane low-e glazing (u=1.27 W/(m
2
K); g=0.591);
- roof insulated with mineral wool of 15cm (according to EN
13162 [14]), u-value for roof, 0.299 W/(m
2
K); [12]
87.87
v
1
- reference building + extruded polystyrene insulation (XPS),
10 cm thickness, u-value for exterior walls, 0.247 W/(m
2
K);
65.09
v
2
- reference building + expanded polystyrene insulation (EPS),
10 cm thickness, u-value for exterior walls, 0.278 W/(m
2
K);
66.29
v
3
- reference building + expanded polystyrene insulation (EPS),
20 cm thickness, u-value for exterior walls, 0.164 W/(m
2
K);
62.23
v
4
- reference building + polyurethane insulation, 10cm
thickness, u-value for exterior walls, 0.213 W/(m
2
K);
63.98
v
5
- reference building + polyurethane insulation, 15cm
thickness, u-value for exterior walls, 0.154 W/(m
2
K);
61.79
v
6
- reference building + polyurethane insulation, 15cm
thickness, u-value for exterior walls, 0.154 W/(m
2
K);
- new exterior windows with triple-pane low-e glazing (u=0.4
W/(m
2
K); g=0.408);
48.42
v
7
- reference building + polyurethane insulation, 15cm
thickness, u-value for exterior walls, 0.154 W/(m
2
K);
- new exterior windows with triple-pane low-e glazing (u=0.4
W/(m
2
K); g=0.408);
- new roof (polyurethane insulation of 20cm), u-value for roof,
0.132 W/(m
2
K);
42.79
3.2 Energetic simulation of building - Space heating demand
3.2.1 The exterior walls insulation
The correct insulation of a building leads to reducing of energy consumption for heating space, in the
same time ensuring a constant temperature indoor and improving also its sustainability.
Considering the building without thermal insulation of exterior walls and with their thermal insulation
with extruded polystyrene of 10cm (v
1
versus v
0
, Figure 2) it can be noticed a considerable decrease of
International Journal of Energy and Environment (IJEE), Volume 6, Issue 1, 2015, pp.47-60
ISSN 2076-2895 (Print), ISSN 2076-2909 (Online) ©2015 International Energy & Environment Foundation. All rights reserved.
52
heating demand (annually this decrease is about 30%) and an increasing of cooling demand (annually
with about16%).
5258
4669
1886
3971
4601
4066
3497
2997
3590
‐4000
‐3500
‐3000
‐2500
‐2000
‐1500
‐1000
‐500
0
500
1000
1500
2000
2500
3000
3500
4000
4500
5000
5500
Jan. Feb. Mar. A pr. May Jun. Jul. A ug. Se p. Oct. Nov. Dec.
Qheat Qheat_XPS_1 0 Qcool Qcool_XPS_1 0
Spac eheatingand cooling demand(kWh)
(a)
23
25
36
41
34
25
22
29.34
22
14
10
7
9
16
34
15.92
0
5
10
15
20
25
30
35
40
45
50
Jan. Feb. Mar. A pr . May Jun. Jul. Aug. Sep. Oc t. Nov. Dec .
(%)
MonthlyHeat ing Decrease YearlyHeating Decrease
MonthlyCoolingIncrease YearlyCooling Increase
(b)
Figure 2. Exterior walls insulation (v
0
versus v
1
): (a) Monthly demand of space heating and cooling; (b)
Monthly percentage differences between variants
However it should be taken into account that in order to ensure a certain degree of indoor thermal
comfort, there are needed both the avoidance of condensation on the inside surfaces of the walls as well
the discomfort avoidance; the lower the difference between the indoor air temperature and the inside
surface temperature of the wall is, the lower the discomfort of cold radiation is.
Considering this aspect in Figure 3 is represented the monthly variation of the differences between
indoor air temperature and the inside surface temperature of the North wall for the Second Floor.
The exterior walls insulation with extruded polystyrene leads to a significant decrease of the difference
between the indoor air temperature and the North wall temperature, during the months, January to March
and October to December (a monthly average of 1.8
o
C); however, during the months of April to
September there is an increase of this difference, respectively the inside surface temperature of wall is
higher than indoor air temperature (an average increase of 0.9
o
C).
A thermal insulation material is characterized by the thermal conductivity that measures the ability of a
material to transmit thermal energy; therefore, the lower this coefficient is the better insulation is
obtained.
International Journal of Energy and Environment (IJEE), Volume 6, Issue 1, 2015, pp.47-60
ISSN 2076-2895 (Print), ISSN 2076-2909 (Online) ©2015 International Energy & Environment Foundation. All rights reserved.
53
5.4
5.3
1.7
‐0.2
‐3.0
‐4.0
‐5.0
‐4.5
‐2.7
1.6
4.4
4.9
3.4
3.1
0.0
‐1.6
‐4.1
‐4.9
‐5.7
‐5.2
‐3.5
0.2
2.7
3.2
‐6
‐5
‐4
‐3
‐2
‐1
0
1
2
3
4
5
6
Jan. Feb. Mar. A pr. May Jun. Jul. Aug. Sep. Oct. Nov. Dec.
T
air
‐T
si
(
o
C)
Tair‐T_North_Wall Tair‐T_North_Wall_XPS_10
Figure 3. Differences between the monthly averages of indoor air temperature and monthly averages of
inside surface temperature of the North wall (Second Floor)
The comparison of different insulation materials is achieved based on their thermal conductivity values,
but there are not available concrete comparative analyzes in terms of energy demand for space heating /
cooling. Although it can be said that: the polyurethane foam is better in terms of thermal conductivity,
with 20.7% compared to extruded polystyrene and with 41.5% compared to expanded polystyrene (Table
2, [4]), these percentages do not reflect themselves in a similarly manner on the differences between
thermal demands for building heating / cooling.
Therefore at the insulation material selection is recommended the comparative analysis of thermal
demand for space heating / cooling, the values obtained for different types and thicknesses of insulation
materials. In this way it can also takes account of factors such as the complete structure of the building
and climatic conditions of the geographical area.
Thus for the considered building, the energy simulations were achieved for three types of insulation
materials (all of 10cm thick), Figure 4.
Table 2. Insulation materials used in the building energy simulation [12]
Insulation Thermal conductivity (W/mK) Density (kg/m
3
)
Extruded Polystyrene Average Density (XPS) 0.032 35
Expanded Polystyrene Average Density (EPS) 0.0375 25
Polyurethane Average Density 0.0265 40
The carried analysis led to the conclusion that the polyurethane foam provides the best insulation during
the cold period but its use leads to an increased demand for the space cooling. The expanded polystyrene
(EPS) provides the worst insulation during the cold period and the extruded polystyrene (XPS) leads to
the lowest values of the space cooling demand.
However, among the annual obtained values (both for heating and cooling demand) small differences
were recorded; thus,
• the percentage increase of heating demand compared to polyurethane foam,
- when using the expanded polystyrene is 3.6% and,
- when using the extruded polystyrene 1.73%,
• the percentage increase of cooling demand compared to extruded polystyrene,
- when using the expanded polystyrene is 1.78%, and,
- when using polyurethane foam of 3.0%.
One of the factors that make the difference between a good insulation and an inefficient one is the
thickness of insulation material. In this respect Figure 5 shows the influence of insulation material
thickness, respectively for expanded polystyrene (10cm and 20cm thick) and polyurethane foam (10cm
and 15cm).
International Journal of Energy and Environment (IJEE), Volume 6, Issue 1, 2015, pp.47-60
ISSN 2076-2895 (Print), ISSN 2076-2909 (Online) ©2015 International Energy & Environment Foundation. All rights reserved.
54
‐4000
‐3500
‐3000
‐2500
‐2000
‐1500
‐1000
‐500
0
500
1000
1500
2000
2500
3000
3500
4000
4500
5000
5500
Jan. Fe b. Mar. A pr. May Jun. Jul. A ug. Sep. Oct. Nov. Dec.
Qheat_XPS_1 0 Qheat_EPS_1 0 Qheat_Poly_10
Qcool_XPS_10 Qcool_EPS_1 0cm Qc ool_P oly_1 0
Spaceheatingandcooling demand(kWh)
Figure 4. Insulation of exterior walls with different insulation materials with thickness of 10cm (the
comparison of variants v
1
, v
2
, v
4
)
‐4000
‐3500
‐3000
‐2500
‐2000
‐1500
‐1000
‐500
0
500
1000
1500
2000
2500
3000
3500
4000
4500
5000
5500
Jan. Feb. Mar. Apr . May Jun. Jul. Aug. Sep. Oc t. Nov. Dec .
Qheat_EPS_10cm Qheat_EPS_2 0 c m
Qc ool_EPS_1 0cm Qc ool_EPS_2 0 cm
Spac eheatingand cooling demand(kWh)
(a)
‐4000
‐3500
‐3000
‐2500
‐2000
‐1500
‐1000
‐500
0
500
1000
1500
2000
2500
3000
3500
4000
4500
5000
5500
Jan. Feb. Mar. Apr . May Jun. Jul. A ug. Sep. Oct. Nov. De c.
Qheat_Poly_10cm Qheat_Poly_15cm
Qc ool_P oly_1 0cm Qc ool_ P oly_15 cm
Spaceheatingandcooling demand(kWh)
(b)
Figure 5. Insulation of exterior walls using different thicknesses of insulation material (v
2
versus v
3
and
v
4
versus v
5
): (a) expanded polystyrene; (b) polyurethane foam
International Journal of Energy and Environment (IJEE), Volume 6, Issue 1, 2015, pp.47-60
ISSN 2076-2895 (Print), ISSN 2076-2909 (Online) ©2015 International Energy & Environment Foundation. All rights reserved.
55
In the case of expanded polystyrene use, doubling the thickness of the insulation layer leads to a decrease
in the space heating demand with 6.1%, but to an increase in the cooling demand with 2.1% (Figure
5,(a)). However it is noted that an increasing of the polyurethane foam layer from 10cm to 15cm leads to
a decrease of space heating demand with 3.4% and to a decrease of cooling demand with 1.3% (Figure
5,(b)).
In view of the above conclusion, for the building being analyzed it is recommended the use of
polyurethane foam with 15cm thick as insulation material (the following simulations were made for
variants of the building for what the thermal insulation of exterior walls was made with polyurethane
foam of 15cm).
3.2.2 New modern windows with triple-pane insulation glass (low-E)
The thermal losses for windows are characterized by the value of heat transfer coefficient U; this value is
inversely proportional to the thermal resistance, a low value for U leading to a better energy efficiency of
the window [11, 13].
As a measure for the possible solar heat gain, the glazing g-value must be as high as possible.
Although the reference building variant is provided with double-pane insulation glass (low-E) for
exterior windows (u=1.27 W/(m
2
K); g=0.591) their change with triple-pane insulation glass windows
(u=0.4 W/(m
2
K); g=0.408) has positive effects both on the heating /cooling demand as well on the indoor
thermal comfort (Figures 6 and 7).
‐4000
‐3500
‐3000
‐2500
‐2000
‐1500
‐1000
‐500
0
500
1000
1500
2000
2500
3000
3500
4000
4500
5000
5500
Jan. Feb. Mar. Apr. May Jun. Jul. Aug. Sep. Oct. Nov. De c.
Qheat_Poly_15cm Qheat_Poly_15cm_ Win
Qcool_ Po ly_15cm Qc ool_P oly_ 15 cm_W in
Spac eheatingand cooling demand(kWh)
(a)
24
25
21
15
13
20
21
39
35
34
33
34
36
48
19.92
36.75
0
5
10
15
20
25
30
35
40
45
50
Jan. Feb. Mar. A pr . May Jun. Jul. Aug. Se p. Oct. Nov. Dec.
(%)
MonthlyHeating Decrease MonthlyCoolingDecrease
YearlyHeating Decrease YearlyCoolingDecrease
(b)
Figure 6. The replacement of the double-pane insulation glass windows by triple-pane insulation glass
windows (v
5
versus v
6
): (a) monthly demand for space heating and cooling; (b) monthly percentage
differences between variants
International Journal of Energy and Environment (IJEE), Volume 6, Issue 1, 2015, pp.47-60
ISSN 2076-2895 (Print), ISSN 2076-2909 (Online) ©2015 International Energy & Environment Foundation. All rights reserved.
56
Thus, the use of modern windows leads to a decrease of the annual value of energy demand for space
heating with about 20%; the decrease for annual space cooling demand is about 37%.
The analysis of monthly temperature differences between the indoor air temperature and the inside
surface temperature of the North wall for the Second Floor is presented in Figure 7,(a).
3.1
2.8
‐0.2
‐1.8
‐4.3
‐5.0
‐5.8
‐5.3
‐3.6
0.0
2.4
3.0
2.4
2.1
0.0
‐1.1
‐3.1
‐3.7
‐4.3
‐3.9
‐2.5
0.2
1.9
2.4
‐7
‐6
‐5
‐4
‐3
‐2
‐1
0
1
2
3
4
5
Jan. Feb. Mar. Apr. May Jun. Jul. Aug. Se p. Oct. Nov. Dec.
T
air
‐T
si
(
o
C)
Tair‐T_North_Wall_Poly_15 Tair‐T_North_Wall_Poly_15_Window
(a)
21
20
22
22
22
22
23
23
23
24
24
23
0
5
10
15
20
25
30
0
500
1000
1500
2000
2500
3000
Jan. Feb . Mar. A pr. May Jun . Jul. A u g. Se p. Oct. Nov. Dec.
(%)
Qse c_W indows Qsec_newWindows MonthlyQsecDecrease
Secondaryheatflux (kWh)
(b)
Figure 7. The use of triple-pane insulation glass windows (T
air
– air temperature; T
si
- inside surface
temperature): (a) T
air
-T
si
– the North wall of the Second Floor; (b) secondary heat flux of all windows
It is noted that changing the windows has a positive influence on indoor comfort both in the cold periods
January to March and October to December as well during the warm period April to October. Thus for
the two cold periods mentioned above it is recorded a decrease of temperature difference on average with
0.4
o
C, a significant decrease of the temperature difference being obtained during the warm period,
respectively of 1.2
o
C.
This fact is due to the decrease of secondary heat flux that is transmitted through the windows throughout
the year (Figure 7,(b)); as it can be seen, the use of triple-pane insulation glass windows leads to a
decrease of the monthly values of the secondary heat flux with 20-24%.
3.2.3 The roof insulation
For the thermal insulation of the roof, this paper proposes to replace the existent insulation of mineral
wool with the polyurethane foam.
Considering the building (provided with exterior walls insulated with polyurethane foam of 15cm and
triple-pane insulation glass windows) the replacement of roof insulation with polyurethane foam of 15cm
International Journal of Energy and Environment (IJEE), Volume 6, Issue 1, 2015, pp.47-60
ISSN 2076-2895 (Print), ISSN 2076-2909 (Online) ©2015 International Energy & Environment Foundation. All rights reserved.
57
thickness, leads to a decrease in the annual demand of space heating with about 11%, but to an increase
in cooling demand of about 7% (Figure 8).
‐4000
‐3500
‐3000
‐2500
‐2000
‐1500
‐1000
‐500
0
500
1000
1500
2000
2500
3000
3500
4000
4500
5000
5500
Jan. Feb. Mar. Apr. May Jun. Jul. Aug. Sep. O ct. Nov. De c.
Qheat_Poly_15 c m_W in Qheat_ Poly_15 c m_Roof
Qcool_Poly_15cm_Win Qc ool_Poly_1 5 c m_ Roof
Spac eheatingand cooli ng demand(k Wh)
Figure 8. Monthly values of heating and cooling demand at the replacement of the roof insulation (v
6
versus v
7
)
The last stage of the study proposes a comparative analysis between the building reference variant (v
0
)
and the latest variant proposed (v
7
).
From the comparative analysis of results obtained following the energy simulations (Figures 9 and 10
and Table 3) it can be said that the rehabilitation of the entire building can lead to:
• the decrease of space heating demand with about 53% compared to the reference variant;
• the decrease of space cooling demand with about 17% compared to the reference variant;
• the temperature difference between indoor air temperature and North wall surface temperature for the
Second Floor, decreases on average with about 2.6
o
C during the cold periods: January to March,
October to December, and with about 0.3
o
C during period of May to September.
Table 3. The annual values of the space heating / cooling demand
Variant Yearly Qheat
[kWh]
Yearly Qcool
[kWh]
Yearly decrease of heating
demand (%) compared to v
0
Yearly increase of cooling
demand (%) compared to v
0
v
0
22847 14663 - -
v
1
16923 16295 25.93 11.13
v
2
17235 16587 24.56 13.12
v
3
16181 16940 29.18 15.53
v
4
16634 16785 27.19 14.47
v
5
16066 16570 29.68 13.01
v
6
12589 11060 44.90 -24.57
v
7
11127 11851 51.30 -19.18
International Journal of Energy and Environment (IJEE), Volume 6, Issue 1, 2015, pp.47-60
ISSN 2076-2895 (Print), ISSN 2076-2909 (Online) ©2015 International Energy & Environment Foundation. All rights reserved.
58
5258
4669
1886
828
1635
3971
4601
2660
2191
743 740
2021
2451
‐4000
‐3500
‐3000
‐2500
‐2000
‐1500
‐1000
‐500
0
500
1000
1500
2000
2500
3000
3500
4000
4500
5000
5500
Jan. Fe b. Mar. A pr . May Jun. Jul. Aug. Sep. Oct. Nov. Dec .
Qheat Qheat_Poly_15cm_Roof Qcool Qcool_Poly_ 15 cm_Roof
Spaceheatingand cooling demand(k Wh)
(a)
49
53
61
62
55
49
47
8
18
22
25
24
18
2
53.70
16.76
0
5
10
15
20
25
30
35
40
45
50
55
60
65
70
Jan. Feb. Mar. Apr . May Jun. Jul. A ug. Sep. Oct. Nov. Dec.
(%)
MonthlyHeating Decrease MonthlyCooling Decrease
YearlyHeating Decrease YearlyCoolingDecrease
(b)
Figure 9. The reference variant versus the final one (v0 versus v7): (a) monthly demand of space heating
/ cooling; (b) monthly percentage differences between variants
5.4
5.3
1.7
‐0.2
‐3.0
‐4.0
‐5.0
‐4.5
‐2.7
1.6
4.4
4.9
2.1
1.8
‐0.3
‐1.4
‐3.2
‐3.8
‐4.4
‐3.9
‐2.6
0.0
1.7
2.1
‐6
‐5
‐4
‐3
‐2
‐1
0
1
2
3
4
5
6
Jan. Fe b. Mar. Apr . May Jun. Jul. A ug. Sep. Oct. Nov. Dec.
T
air
‐T
si
(
o
C)
Tair‐T_North_Wall Tair‐T_ North_W all_ Poly_1 5_W indow_Roof
Figure 10. Differences between the monthly averages of indoor air temperature and the monthly averages
of the North wall temperature (Second Floor)
International Journal of Energy and Environment (IJEE), Volume 6, Issue 1, 2015, pp.47-60
ISSN 2076-2895 (Print), ISSN 2076-2909 (Online) ©2015 International Energy & Environment Foundation. All rights reserved.
59
4. Conclusions
For Braşov area, the energy demand for building heating in cold season represents an important share in
energy consumption. Thus, as early as the construction phase of a building there can be considered a
series of methods to reduce the energy demand for heating. To highlight the advantages of such methods,
this paper proposed the energy analysis of an office building and the comparative study of the influence
of various factors, such: the insulation material type of the exterior walls, the type of thermopane
windows and the thermal insulation type of the roof. Following the achieved study, the following
conclusions can be formulated:
• The climatic conditions of area have a significant influence both on the indoor comfort as well on the
energy consumption in buildings. In view of this aspect, the energy demand simulation was
performed using weather data recorded by a local weather station (data specific to Braşov area), data
that were then implemented for simulations with TRNSYS software.
• The building envelope must be analyzed for its features of heat transmission, for its ability to control
heat gain and losses considering the use of different insulation materials.
• A good insulation of exterior walls leads to a decrease in heating demands, through a good
preservation of indoor temperature. Also, an increase in indoor thermal comfort is recorded due to
eliminating the effect of "cold wall" on exterior walls (the difference between the wall surface
temperature and indoor air temperature decreases). In addition, the risk of condensation is reduced
and sudden temperature changes are prevented.
• High efficiency windows (which include multiple layers of insulation and low emissivity coatings)
lead to energy savings by reducing the energy losses during the cold period, but also to maintaining
of some reduced temperatures and reduced cooling demands during the warm period.
• The roof thermal insulation leads to a decrease of heating energy demand (for the considered case
study the annual reduction of heating demand for the Second Floor is of 20%).
Finally it must be mentioned the important role of computer simulation in the design based on energy
performance of buildings, in order to obtain some results based on which the final solution will decided.
Using libraries of building materials, windows, weather data and standards for determining the buildings
performance, through computer simulations there can be evaluated the parameters that ensure the energy
efficiency of a building (calculation of building loads and of energy consumption; evaluation of thermal
comfort conditions, thermal behaviour, etc.).
References
[1] International Energy Agency. SHC Task 40, Net Zero Energy Solar Buildings: International
Projects of Carbon Neutrality in Buildings, 2011.
[2] Directive 2010/31/EU of the European Parliament and of the Council of 19 May 2010 on the
energy performance of buildings. Official Journal of the European Union, 2010.
[3] Hui S.C.M. Low energy building design in high density urban cities. Renewable Energy 2001, 24,
627-640
.
[4] Clarke J.A. Energy Simulation in Building Design, The second Edition. Butterworth-Heinemann
A division of Reed Educational and Professional Publishing Ltd., 2001.
[5] Zalejska-Jonsson A. Evaluation of low-energy and conventional residential buildings from
occupants’ perspective. Building and Environment 2012, 58, 135-144.
[6] Laustsen J. Energy efficiency requirements in building codes, energy efficiency policies for new
buildings. International Energy Agency, OECD/IEA France, 2008.
[7] EN 13163. Thermal insulation products for buildings - Factory made products of expanded
polystyrene (EPS) - Specification, November 2008.
[8] EN 13164. Thermal insulation products for buildings - Factory made products of extruded
polystyrene foam (XPS) - Specification, November 2008.
[9] EN 7345. Thermal insulation - Physical quantities and definitions, March 1996.
[10] EN 13165. Thermal insulation products for buildings - Factory made rigid polyurethane foam
(PUR) products - Specification, November 2008.
[11] VFF/BF - Save more energy with new windows, Update of the study “In a new light: Energetic
modernization of old windows”. Verband Fenster + Fassade (VFF) and Bundesverband Flachglas
(BF), Frankfurt am Main / Troisdorf, March 2014.
International Journal of Energy and Environment (IJEE), Volume 6, Issue 1, 2015, pp.47-60
ISSN 2076-2895 (Print), ISSN 2076-2909 (Online) ©2015 International Energy & Environment Foundation. All rights reserved.
60
[12] Klein S.A., et al. TRNSYS 16, A transient System Simulation Program. University of Wisconsin
Solar Energy Laboratory, 2006.
[13] Malkawi A.M., Augenbroe G. Advanced Building Simulation. Spon Press, Taylor & Francis
Group, 2004.
[14] EN 13162. Thermal insulation products for buildings - Factory made mineral wool (MW) products
- Specification, November 2008.
Elena Eftimie is a full Professor at Transilvania University of Braşov, Faculty of Product Design and
Environment, Department of Product Design, Mechatronics and Environment, Romania. She has
a
Ph.D. in Mechanical Engineering from Transilvania University of Braşov (2000). She supervises MSc
and PhD students. Prof. Eftimie’s main research interests are in information technology and renewable
energy especially solar radiation estimation, building energy simulation. She is member of Romanian
Association for the Science of Mechanisms and Machines and Romanian Association of Mechanical
Transmissions.
E-mail address: