CO2 emission optimization for a blast furnace considering plastic injection
Bạn đang xem bản rút gọn của tài liệu. Xem và tải ngay bản đầy đủ của tài liệu tại đây (1.11 MB, 16 trang )
INTERNATIONAL JOURNAL OF
ENERGY AND ENVIRONMENT
Volume 6, Issue 2, 2015 pp.175-190
Journal homepage: www.IJEE.IEEFoundation.org
ISSN 2076-2895 (Print), ISSN 2076-2909 (Online) ©2015 International Energy & Environment Foundation. All rights reserved.
CO
2
emission optimization for a blast furnace considering
plastic injection
Xiong Liu
1,2,3
, Xiaoyong Qin
1,2,3
, Lingen Chen
1,2,3
, Fengrui Sun
1,2,3
1
Institute of Thermal Science and Power Engineering, Naval University of Engineering, Wuhan 430033,
P. R. China.
2
Military Key Laboratory for Naval Ship Power Engineering, Naval University of Engineering, Wuhan
430033, P. R. China.
3
College of Power Engineering, Naval University of Engineering, Wuhan 430033, P. R. China.
Abstract
An optimization model based on mass balance and energy balance for a blast furnace process is
established by using a nonlinear programming method. The model takes the minimum CO
2
emission of a
blast furnace as optimization objective function, and takes plastic injection or pulverized coal injection
into account. The model includes sixteen optimal design variables, six linear equality constraints, one
linear inequality constraint, six nonlinear equality constraints, one nonlinear inequality constraint, and
thirteen upper and lower bound constraints of optimal design variables. The optimization results are
obtained by using the Sequential Quadratic Programming (SQP) method. Comparative analyses for the
effects of plastic injection and pulverized coal injection on the CO
2
emission of a blast furnace are
performed.
Copyright © 2015 International Energy and Environment Foundation - All rights reserved.
Keywords: Blast furnace; CO
2
emission; Iron-making; Plastic injection; Optimization.
1. Introduction
The iron and steel industry is one of the higher industrial CO
2
emission sources and energy consumers.
Around the world, between 4% and 7% of the anthropogenic CO
2
emissions originate from this industry
[1-3]. Blast furnace iron-making is a vital process in integrated iron and steel works. The technical
improvement and process optimization of blast furnace iron-making is a key step to the development of
the iron and steel industry, energy conservation and CO
2
emission reductions [4, 5]. A blast furnace,
however, is a rector containing many very complex physical and chemical processes. Mathematical
modeling is an efficient way to obtain further understanding of blast furnace process, and can achieve
further improvements of the operations. Currently, some scholars have established different kinds of
models for blast furnaces. The models for blast furnace may approximately be divided into three classes:
Statistical models [6, 7], kinetic models
[8-10] and mass and energy balance models
[11-19]. The mass
and energy balance model, which is based on thermodynamic theory and takes the characteristics of blast
furnace into account, is an effective method to conduct macro analyses and calculations for blast furnace
performance. Rasul et al [11] established an model for a blast furnace based on mass and energy
balances, and analyzed the influences of blast temperature, silicon content in hot metal and ash content in
coke on the blast furnace performance. Emre et al [12] established a model for a blast furnace based on
International Journal of Energy and Environment (IJEE), Volume 6, Issue 2, 2015, pp.175-190
ISSN 2076-2895 (Print), ISSN 2076-2909 (Online) ©2015 International Energy & Environment Foundation. All rights reserved.
176
the first law of thermodynamics, and analyzed the energy balance of Erdemir No.1 blast furnace. Ziebik
et al [13, 14] established exergy analysis models for a blast furnace based on mass and energy balances,
and analyzed the effects of the operation parameters such as blast temperature and oxygen enrichment
degree on exergy and exergy loss of the blast furnace.
In addition, based on mass and energy balances, some optimization models for blast furnace iron-making
have been established by using mathematical programming method. Helle et al [15] established an
optimization model of iron-making process using a linear programming method with biomass as an
auxiliary reductant in the blast furnace, and investigated the economy of biomass injection and its
dependence on the price structure of materials and emissions. Helle et al [16] established a blast furnace
iron-making optimization model using nonlinear programming method by taking production as objective
function on the basis of the given production rate of hot metal, and analyzed the optimum performance of
iron-making system including a blast furnace. Yang et al [17] established an optimization model for a
blast furnace using linear programming method by taking coke rate as objective function, and proposed
some guidelines for the operation of a blast furnace after comparing the optimization result with
production reality. Zhang et al [18] established a multi-objective optimization model of blast furnace
iron-making system using linear programming method by taking energy consumption, cost and CO
2
emissions as objective functions, and analyzed the effects of coke rate, coal rate, blast temperature and
sinter ore grade on the energy consumption and cost of production.
The plastic is mainly composed of carbon and hydrogen, and its composition is similar to heavy oil.
Thus, the application value of plastic for blast furnace smelting is obvious. To a certain extent, the
technology of injecting plastic into a blast furnace can solve environmental problem caused by the
extensive use of plastic. Hence, the industrial application value and environmental protection value of
plastic injection in blast furnace have been noted by researchers [19-21]. Minoru et al [19] described the
development of waste plastics injection for blast furnaces. Dongsu et al [20] conducted an experiment on
plastic injection for blast furnaces and discovered that the combustion efficiency of plastic in tuyere zone
could be improved by improving blast temperature and oxygen enrichment degree, and reducing plastic
particle size. Minor et al
[21] conducted experiments on plastic injection in blast furnaces and found that
the combustion performance of plastic in a blast furnace is equivalent to pulverized coal when a plastic
particle is less than 1.44 mm.
Based on the studies mentioned above, a blast furnace optimization model, in which CO
2
emissions of
the blast furnace is taken as an objective function, is established, and the plastic injection and pulverized
coal injection are considered. Then, the model is solved by using the Sequential Quadratic Programming
(SQP) method from MATLAB optimization toolbox. In addition, the effects of plastic injection and
pulverized coal injection on the CO
2
emissions of a blast furnace are analyzed and contrasted. The
conclusions obtained herein can provide some guidelines for the design and operation of blast furnaces.
2. The CO
2
emission optimization model for a blast furnace
2.1 Physical model
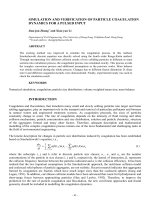
As shown in Figure 1, a physical model of a blast furnace is considered based on the temperature
characteristics inside the blast furnace and some division methods proposed in Refs. [22, 23]. The blast
furnace is divided into three zones along its height: the upper preparation zone (PZ), the middle reserve
zone (RZ) and the bottom elaboration zone (EZ). The inputs of material flows include sinter ore, pellet
ore, lump ore, coke, blast and fuel injected into tuyere area. The outputs of material flows include hot
metal, slag and blast furnace gas. The limit temperature of the bottom elaboration zone is set as 950
°C
;
the middle reserve zone is considered as an isothermal region of 950
°C
, and the upper preparation zone
is a lumpish zone while its temperature is lower than 950
°C
. Furthermore, the following assumptions are
considered: (1) All the high valence iron oxides in the preparation zone are reduced into wustite; (2) The
gasification of carbon only takes place in the elaboration zone; (3) Behaviors in a blast furnace are
described according to the theory of Rist operation; (4) The combustion efficiency of fuel in blast furnace
is 100%; (5) Both free water and crystal water in raw material and fuel are evaporated or separated in the
preparation zone.
The chemical reaction relations exist in the elaboration zone are listed in Table 1.
The main chemical reactions present in the middle reserve zone are: indirect reduction of wustite
(
2
FeO+CO=Fe+CO
) and water gas shift reaction (
2 2 2
CO+H O=CO +H
).
International Journal of Energy and Environment (IJEE), Volume 6, Issue 2, 2015, pp.175-190
ISSN 2076-2895 (Print), ISSN 2076-2909 (Online) ©2015 International Energy & Environment Foundation. All rights reserved.
177
The main chemical reactions present in the preparation zone are: decomposition of carbonate (excluding
flux); both the free water and crystal water of raw material and fuel are evaporated or separated; carbon
deposition (
2
2CO = CO +C
); hematite and magnetite are completely reduced to wustite.
Figure 1. Physical model of a blast furnace
Table 1. Chemical reactions and their introductions in the elaboration zone
chemical reaction
introduction
FeO+C=Fe+CO
direct reduction of wustite
2
SiO +2C=Si+2CO
direct reduction of SiO
2
MnO+C=Mn+CO
direct reduction of MnO
25
P O +5C=2P+5CO
direct reduction of P
2
O
5
FeS+CaO+C=CaS+Fe+CO
desulfurization
2
C+O =2CO
combustion of carbon
2
CO +C=2CO
(>1000
°C
)
reduction of CO
2
22
C+H O=CO+H
(>1000
°C
)
reduction of water in blast
International Journal of Energy and Environment (IJEE), Volume 6, Issue 2, 2015, pp.175-190
ISSN 2076-2895 (Print), ISSN 2076-2909 (Online) ©2015 International Energy & Environment Foundation. All rights reserved.
178
2.2 Optimal design variables
The performance of a blast furnace is affected by many factors. These factors include three classes: (1)
raw material and fuel parameters, (2) process parameters and (3) product quality parameters. The raw
material parameters refer to the dosage of iron ore and flux. The fuel parameters refer to the coke rate
and injected fuel rate. The process parameters refer to the direct reduction degree of iron, blast
parameters (including volume, temperature, humidity and oxygen enrichment degree), slag basicity,
volume of blast furnace gas and coke load. The product quality parameters refer to the content of each
ingredient in hot metal.
Some main techno-economic indexes of iron-making process are often influenced by these parameters.
Thus, as listed in Table 2, sixteen parameters are chosen from these three kinds of parameters as optimal
design variables.
Table 2. Optimal design variables and introductions
parameter categories
variables
symbols
units
introductions
raw material parameters
x
1
sinter
m
kg/t
sinter ore rate
x
2
pellet
m
kg/t
pellet ore rate
x
3
lump
m
kg/t
lump ore rate
x
4
ls
m
kg/t
flux rate
fuel parameters
x
5
fuel,injected
m
kg/t
injected fuel rate
x
6
coke
m
kg/t
coke rate
technological parameters
x
7
d
r
-
direct reduction degree of iron
x
8
b
V
Nm
3
/t
blast volume
x
9
b
T
°C
blast temperature
x
10
%
blast humidity
x
11
f
%
blast oxygen enrichment degree
quality parameters of
production
x
12
[Fe]
%
Fe content in hot metal
x
13
[C]
%
C content in hot metal
x
14
[P]
%
P content in hot metal
x
15
[Mn]
%
Mn content in hot metal
x
16
[S]
%
S content in hot metal
2.3 Objective function
In fact, there are various carbon gases in the blast furnace gas. Thus, the CO
2
emissions value should be
the mass of all the CO
2
when the carbon gases are converted to CO
2
[24]. According to this method of
calculation on CO
2
emissions, and the carbon gas in blast furnace is composed of CO and CO
2
, the CO
2
emission objective function is expressed as
2
bfg CO ,bfg CO,bfg
44 ( )
2.24
V
F
(kg/t) (1)
where
bfg
V
is the blast furnace gas volume (
3
Nm /t
),
CO,bfg
ω
is the volume content of CO within blast
furnace gas (%), and
2
CO ,bfg
ω
is the volume content of
2
CO
within blast furnace gas (%).
2.4 Constraint conditions
The process of blast furnace iron-making must obey the laws of mass and energy balances, and also
needs to conform to a certain process system and some material conditions. Thus, all the constraint
conditions are classified into mass and energy balance constraints, process constraints, and upper and
lower bound constraints of the optimal design variables.
2.4.1 Mass and energy balance constraints
Mass and energy balance constraints include hot metal composition balance constraint, ferrum element
balance constraint, manganese element balance constraint, phosphorus element balance constraint, sulfur
International Journal of Energy and Environment (IJEE), Volume 6, Issue 2, 2015, pp.175-190
ISSN 2076-2895 (Print), ISSN 2076-2909 (Online) ©2015 International Energy & Environment Foundation. All rights reserved.
179
element balance constraint, dissolved carbon balance constraint, heat balance constraint for the
elaboration zone, and carbon and oxygen balance constraints for the elaboration zone.
The hot metal composition balance constraint for blast furnace means that the sum of the contents of
each kind of element in hot metal is 100%, so its constraint function is
[j]=100
(2)
where [j] is the content of each kind of element in hot metal (%).
The balance constraints of ferrum element, manganese element, phosphorus element and sulfur element
mean that the inputs of each kind element within a blast furnace should be equal to the outputs of it.
Thus, the constraint function is
i i,j
(m /100) 10[j]
(kg/t) (3)
where m
i
is the dosage of each kind of raw material and fuel (kg/t), and
i, j
is the content of element j
(Fe, P, Mn, S) in each kind of raw material and fuel (%).
The dissolved carbon balance constraint means that the carbon content of hot metal has a relationship
with the other element content within the hot metal. As it is hard to control the content of carbon in hot
metal, the corrected formula is adopted in this model according to Ref. [25]:
[C]=4.3-0.27[Si]-0.32[P]-0.032[S]+0.03[Mn]
(%) (4)
The heat balance constraint in the elaboration zone means that the heat inputs should be equal to the heat
outputs in the elaboration zone [26]. Thus, its constraint function is
EZ
c b fuel df dr dcar bfg iron slag loss
Q Q Q Q Q Q Q Q Q Q
(kJ/t) (5)
where
c
Q
,
b
Q
and
fuel
Q
are, respectively, heat release of carbon combustion, physical heat of blast
(excluding decomposition heat of water in blast) and physical heat of injected fuel (kJ/kg);
df
Q
,
dr
Q
,
dcar
Q
,
bfg
Q
,
iron
Q
,
slag
Q
and
EZ
loss
Q
are, respectively, decomposition heat of injected fuel, demanded heat of
direct reduction of ferrum element and other alloying elements, decomposition heat of carbonate,
physical heat of blast furnace gas, physical heat of hot metal, physical heat of slag, and heat loss of the
elaboration zone (kJ/kg).
When the blast furnace iron-making process is in equilibrium state, the coke rate from calculation is the
lowest coke rate, namely theoretical coke rate [25]. Actually, because the blast furnace iron-making
process is always in a non-equilibrium state, the constraint function of carbon oxygen balance for the
elaboration zone is
22
H H ,r C,b C,da C,dFe C,dFe
10[Fe]/56- /0.0224-( + + -10[C])/12/3.237 /12V m m m m
(6)
where
2
H
is the hydrogen utilization ratio,
2
H ,r
V
is the volume of hydrogen involved in reduction
reaction,
C,b
m
,
C,da
m
and
C,dFe
m
are, respectively, the mass of carbon burning in raceway, the mass of
carbon involved in direct reduction for alloying elements (including the mass of carbon involved in
solution loss reaction and desulfurization), and the mass of carbon involved in direct reduction for iron.
2.4.2 Process constraints
Process constraints include constraint of slag basicity, constraint of the content of MgO in slag,
constraint of the content of Al
2
O
3
in slag, constraint of coke load, constraint of sulfur load, constraint of
blast temperature, constraint of oxygen enrichment degree, constraint of blast humidity, and constraint of
the relationship between hydrogen utilization ratio and carbon monoxide utilization ratio. These
constraints are listed in Table 3.
International Journal of Energy and Environment (IJEE), Volume 6, Issue 2, 2015, pp.175-190
ISSN 2076-2895 (Print), ISSN 2076-2909 (Online) ©2015 International Energy & Environment Foundation. All rights reserved.
180
Table 3. Process constraints and constraint functions
process constraints
constraint functions
constraint of slag basicity (
R
)
min max
R R R
content constraint of MgO in slag (
MgO,slag
)
MgO,slag MgO,i i slag
/mm
content constraint of Al
2
O
3
in slag (
23
Al O ,slag
)
2 3 2 3
Al O ,slag Al O ,slag,max
constraint of coke load (
coke
L
)
coke,min coke coke,max
L L L
constraint of sulfur load (
S
L
)
S S,max
LL
constraint of blast temperature (
b
t
)
b,min b b,max
t t t
constraint of oxygen enrichment degree (
f
)
min max
f f f
constraint of blast humidity (
)
min max
constraint of the relationship between hydrogen utilization
ratio and carbon monoxide utilization ratio (
2
H
)
2 2 2
H CO ,bfg CO,bfg CO ,bfg
0.88 ( ) 0.1
2.4.3 Upper and lower bound constraints for optimal design variables
All of the optimal design variables in the model come from raw material parameters, fuel parameters,
process parameters and product quality parameters. These optimal design variables should be within the
allowable ranges. In addition, as blast temperature, oxygen enrichment degree of blast and blast humidity
have been contained in process constraints, the upper and lower bounds of the other thirteen optimal
design variables needed to be given. The constraint functions of upper and lower bound of the optimal
design variables can be written as
i i i
lb ubx
(7)
where x
i
is optimal design variable, lb
i
and ub
i
are, respectively, upper and lower bounds of optimal
design variables.
3. Description of the optimization problem and its solution
3.1 Description of the optimization problem
The optimization problem in this model is a nonlinear programming problem with multivariable and
multi-dimensional constraints [27]. Its mathematical description can be expressed as follows:
eq
eq eq
min ( )
s.t. ( ) 0
( ) 0
lb ub
fx
cx
cx
Ax b
A x b
x
(8)
where f(x) is objective function, x, b, b
eq
and lb are, respectively, n dimension column vector,
1
m
dimension column vector, and
2
m
dimension column vector. c(x) and c
eq
(x) are, respectively, nonlinear
functions of return vectors, ub and lb are, respectively, upper and lower bounds of optimal design
variables, while both ub and lb have the same dimension with x.
3.2 Solutions of constraint conditions and objective function
In order to obtain the values of constraint conditions and objective function, the results of material
balance calculation and heat balance calculation should be substituted into constraint conditions and
objective function, when the initial values of the optimal design variables are given. Thus, at first, it is
necessary to calculate the material and heat balances [26].
International Journal of Energy and Environment (IJEE), Volume 6, Issue 2, 2015, pp.175-190
ISSN 2076-2895 (Print), ISSN 2076-2909 (Online) ©2015 International Energy & Environment Foundation. All rights reserved.
181
3.2.1 Material balance calculation
The material balance calculation includes calculation of slag mass and its composition contents, blast
volume, blast furnace gas volume and its composition contents.
The calculation methods of slag mass and its composition contents are listed in Table 4.
The blast volume V
b
is
2
b
b
O ,b
22.4
24
m
V
(Nm
3
/t) (9)
where m
b
is the mass of carbon burned in the raceway (kg/t), and
2
O ,b
is the content of oxygen in the
blast air.
Blast furnace gas is composed of H
2
, CO
2
, CO and N
2
. The calculation methods of blast furnace gas
volume and its composition contents are listed in Table 5.
Table 4. Calculation of slag mass and its composition content*
symbol
introduction
unit
calculation method
2
SiO ,slag
m
SiO
2
mass in slag
kg/t
22
SiO ,slag SiO ,i i
/100 10[Si] 30 / 28mm
CaO,slag
m
CaO mass in slag
kg/t
CaO,slag CaO,i i
/100mm
MgO,slag
m
MgO mass in slag
kg/t
MgO,slag MgO,i i
mm
23
Al O ,slag
m
Al
2
O
3
mass in slag
kg/t
2 3 2 3
Al O ,slag Al O ,i i
mm
FeO,slag
m
FeO mass in slag
kg/t
FeO,slag TFe,i i Fe,slag
( ) 72 / 56 /100mm
Mn,slag
m
Mg mass in slag
kg/t
Mn,slag Mn,i i Mn,slag
( ) 71/55/100mm
S,slag
m
S mass in slag
kg/t
S,slag S,i i S,slag
0.5 ( ) 32 /100mm
slag
m
slag mass
kg/t
2 2 3
slag SiO ,slag CaO,slag MgO,slag Al O ,slag
FeO,slag Mn,slag S,slag
m m m m m
m m m
*
2
SiO ,i
,
CaO,i
,
MgO,i
,
TFe,i
,
Mn,i
and
S,i
are, respectively, the contents of SiO
2
, CaO, MgO, TFe, Mn
and S in each kind of raw material (%), i is each kind of raw material,
Fe,slag
,
Mn,slag
and
S,slag
respectively are the distribution rate of Fe, Mn and S in slag.
Table 5. Calculation of blast furnace gas volume and its composition content*
symbol
introduction
unit
calculation method
2
H ,bfg
V
volume of H
2
in blast furnace gas
3
Nm /t
2 2 2 2
H ,bfg H H ,b H ,fuel
(1- ) ( )V V V
CO,bfg
V
volume of CO in blast furnace gas
3
Nm /t
CO,bfg CO,b CO,d CO,id
V V V V
2
CO ,bfg
V
volume of CO
2
in blast furnace gas
3
Nm /t
2 2 2
CO ,bfg CO ,r CO ,i
V V V
2
N ,bfg
V
volume of N
2
in blast furnace gas
3
Nm /t
2 2 2
N ,bfg N ,b N ,fuel
V V V
bfg
V
blast furnace gas volume
3
Nm /t
2 2 2
bfg H ,bfg CO,bfg CO ,bfg N ,bfg
V V V V V
*
2
H
is hydrogen utilization rate,
2
H ,b
V
is the volume of water in blast (Nm
3
/t),
2
H ,fuel
V
is the volume of
2
H
within injected fuel (Nm
3
/t),
CO,b
V
is the volume of CO produced by the combustion of carbon in
raceway (Nm
3
/t),
CO,d
V
is the volume of CO produced by the direction reduction of iron and other
alloying elements (Nm
3
/t),
CO,id
V
is the volume of CO used by the indirect reduction (Nm
3
/t),
2
CO ,r
V
is the
volume of CO
2
produced in reduction reaction (Nm
3
/t),
2
CO ,i
V
is the volume of CO
2
in each kind of raw
material (Nm
3
/t),
2
N ,b
V
is the volume of N
2
in blast (Nm
3
/t),
2
N ,fuel
V
is the volume of N
2
in injected fuel
(Nm
3
/t).
3.2.2 Heat balance calculation
Heat inputs of a blast furnace include heat released by combustion of carbon in raceway and physical
heat of the hot blast air. Heat outputs of blast furnace include heat demand of reduction reaction, heat
International Journal of Energy and Environment (IJEE), Volume 6, Issue 2, 2015, pp.175-190
ISSN 2076-2895 (Print), ISSN 2076-2909 (Online) ©2015 International Energy & Environment Foundation. All rights reserved.
182
demand of desulfurization, heat demand of carbonate decomposition, physical heat of slag, physical heat
of hot metal, physical heat of blast furnace gas, heat demand of evaporation of water in raw materials and
heat carried by cooling water and heat loss. The calculation methods of those are listed in Table 6.
Table 6. Calculation of each kind of heat*
symbol
introduction
unit
calculation method
heat
input
C,b
Q
heat released by combustion of carbon in
raceway
kJ/t
C,b C,b dm fuel
9781.2Q m q m
b
Q
physical heat of hot-blast air
kJ/t
b
p,t
b b b
Q 10806(1 )V C t f
heat
output
d
Q
heat demand for reduction reaction
kJ/t
dd
2890 10[Fe] 22960 10[Si]
+4880 10[Mn] 26520 10[P]
Qr
S
Q
heat demand for desulfurization
kJ/t
S S,slag slag
=4650Qm
carb
Q
heat demand for carbonate decomposition
kJ/t
carb d,i carb,i
=Q q m
slag
Q
physical heat of slag
kJ/t
slag slag slag,out
Q m h
iron
Q
physical heat of hot metal
kJ/t
iron iron,out
1000Qh
bfg
Q
physical heat of blast furnace gas
kJ/t
22
bfg bfg bfg d H O,r H O d
CQ V C t V t
2
HO
Q
heat demand for evaporation of water in raw
materials and heat carried out by cooling water
kJ/t
22
H O H O,i i
2450 ( /100)Qm
loss
Q
heat loss
kJ/t
loss 0 C,coke V
10 /QZ
*
C,b
m
is the quantity of carbon burned in raceway (kg/t),
dm
q
is heat demanded for injected fuel
decomposition (kg/t),
b
p,t
C
is the specific heat capacity of blast (kJ/(m
3
·
°C
)),
f
and
respectively are
oxygen enrichment degree and humidity of blast,
carb,i
m
is quantity of carbon within each kind of raw
material (kg/t),
d,i
q
is heat demanded for decomposition of carbonate within each kind of raw material
(kJ/t),
slag,out
h
is specific enthalphy of slag of hot metal (kJ/kg),
bfg
C
is specific heat capacity of blast
furnace gas (kJ/(m
3
·
°C
)),
d
t
is temperature of blast furnace gas (
°C
),
2
H O,r
V
is volume of water produced
by reduction reaction in which hydrogen involved (Nm
3
/t),
2
HO
C
is the specific heat capacity of water
vapor (kJ/(m
3
·
°C
)),
2
H O,i
is the content of water within each kind of raw material and fuel (%),
V
is
productivity (kJ/(m
3
·d)),
0
Z
is heat loss of one kilogram carbon when smelting intensity is one (kJ/kgC),
C,coke
is the content of carbon in coke (%).
3.3 Optimization method
The optimization problem in this model is a nonlinear programming problem with multivariable and
multi-dimensional constraints. Its objective function is a nonlinear function. Its constraints include
nonlinear equality constraints, nonlinear inequality constraints, linear equality constraints and linear
inequality constraints. The function of “fmincon” in the optimization toolbox of the MATLAB is used to
find the optimization results of nonlinear programming problem with multivariable and multi-
dimensional constraints [27]. As SQP algorithm has global and superlinear convergence, it has been one
of the most efficient nonlinear programming algorithms in solving nonlinear programming problem with
multivariable and multi-dimensional constraints [28]. Then, the function of “fmincon” in the
optimization toolbox of the MATLAB is adopted in this model, and its call form is
0
[ , ]=fmincon(@objfun, ,A,b,Aeq,beq,lb,ub,@confun,options)x fval x
(10)
where x
0
is a initial point, x is optimal solution, and fval is the minimum of the objective function.
4. Optimization results and analyses
A designed blast furnace described in Ref. [26] is taken as an example. The contents of plastic and
pulverized coal are listed in Table 7.
International Journal of Energy and Environment (IJEE), Volume 6, Issue 2, 2015, pp.175-190
ISSN 2076-2895 (Print), ISSN 2076-2909 (Online) ©2015 International Energy & Environment Foundation. All rights reserved.
183
Table 7. Contents of plastic and pulverized coal ( %)
item
C
S
O
H
N
H
2
O
FeO
SiO
2
CaO
MgO
Al
2
O
3
plastic
85.60
14.40
-
-
-
-
-
-
-
-
-
pulverized coal
85.40
0.550
0.460
0.300
0.310
0.37
0.847
5.950
0.800
0.710
4.373
The upper and lower bounds of the optimal design variables are listed in Table 8. The upper bound of
injected fuel is 170 kg/t-hot metal when pulverized coal is injected. The upper bound of injected fuel is
100 kg/t-hot metal when plastic is injected. The upper and lower bounds of the other optimal design
variables with pulverized coal injection are the same as those of optimal design variables with plastic
injection.
Table 8. Upper and lower bounds of the optimal design variables
variable
unit
upper bound
lower
bound
variable
unit
upper
bound
lower
bound
x
1
kg/t
1500
0
x
9
°C
1250
1050
x
2
kg/t
1000
0
x
10
%
2.0
0
x
3
kg/t
158.52
0
x
11
%
6.0
0
x
4
kg/t
80
0
x
12
%
100
94
x
5
kg/t
100 (plastic injection)
0
x
13
%
4.9
0
170 (pulverized coal injection)
x
6
kg/t
500
200
x
14
%
0.4
0
x
7
-
1
0.3
x
15
%
1.2
0
x
8
Nm
3
/t
1800
700
x
16
%
0.07
0
4.1 Optimization results
The optimization results and original ones are listed in Table 9. As shown in Table 9, the optimal
pulverized coal rate reaches the lower bound (0 kg/t-hot metal) when pulverized coal is injected. In
contrast, the optimal plastic rate reaches the upper bound (100 kg/t-hot metal) when plastic is injected.
Table 9. Optimization results and original results
variable
introduction
symbol
unit
optimization
results with
plastic injection
optimization
results with
pulverized
coal injection
original
results
x
1
sinter ore rate
m
sinter
kg/t
840.25
998.23
1030.35
x
2
pellet ore rate
m
pellet
kg/t
575.13
436.12
396.29
x
3
lump ore rate
m
lump
kg/t
158.52
158.52
158.52
x
4
flux rate
m
ls
kg/t
0
0
0
x
5
injected fuel rate
m
fuel
kg/t
100
0
170
x
6
coke rate
m
coke
kg/t
270.86
448.94
325
x
7
direct reduction
degree of iron
r
d
0.39
0.56
0.45
x
8
blast volume
V
b
m
3
/t
865.32
1005.32
1000.48
x
9
blast temperature
T
b
°C
1250
1250
1250
x
10
blast humidity
%
0
0
2.0
x
11
blast oxygen
enrichment degree
f
%
0
0
3.5
x
12
Fe content in hot metal
[Fe]
%
95.09
95.09
94.34
x
13
C content in hot metal
[C]
%
4.16
4.16
4.90
x
14
P content in hot metal
[P]
%
0.09
0.10
0.10
x
15
Mn content in hot metal
[Mn]
%
0.14
0.13
0.15
x
16
S content in hot metal
[S]
%
0.03
0.03
0.025
-
minimum
CO
2
emissions
-
kg/t
1013.96
1272.44
1344.30
International Journal of Energy and Environment (IJEE), Volume 6, Issue 2, 2015, pp.175-190
ISSN 2076-2895 (Print), ISSN 2076-2909 (Online) ©2015 International Energy & Environment Foundation. All rights reserved.
184
In addition, both blast humidity (
) and blast oxygen enrichment degree (
f
) reaches the lower bound
whether plastic or pulverized coal is injected. The CO
2
emissions of blast furnace with pulverized coal
injection decrease 6.27% after optimization. In fact, the metal oxide content of coal is higher than that of
coke, so both heat demand of reduction and carbon dosage with pulverized coal injection are increased.
Hence, the mass of pulverized coal reaches 0 kg/t-hot metal when CO
2
emissions of blast furnace reach
the minimum. In contrast, the CO
2
emissions of blast furnace are decreased 24.57% with plastic
injection. This is due to the fact that plastic contains high hydrogen content and has no metal oxide.
Thus, one can conclude that plastic injection will decrease CO
2
emissions of a blast furnace, while
pulverized coal injection will increase CO
2
emissions of a blast furnace. While from the perspective of
economics, burning coke only is not practical while plastic injection is economical. Thus, plastic
injection has significance for both emission reduction and economic considerations.
4.2 Analyses of influence factors
4.2.1 Influence of injected fuel rate on optimization results
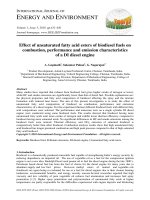
Figures 2-5 show the relationships among the minimum CO
2
emission (
min
F
) and the corresponding fuel
rate (
fuel
m
), coke rate (
coke
m
), direct reduction degree of iron (
d
r
) and injected fuel rate (
fuel,injected
m
),
respectively.
0 20 40 60 80 100
1000
1050
1100
1150
1200
1250
1300
plastic injection
pulverized coal injection
F
min
/(kg·t
-1
)
m
fuel,injected
/(kg·t
-1
)
Figure 2. The minimum CO
2
emission (F
min
) versus injected fuel rate (
fuel,injected
m
)
0 20 40 60 80 100
350
375
400
425
450
plastic injection
pulverized coal injection
m
fuel
/(kg·t
-1
)
m
fuel,injected
/(kg·t
-1
)
Figure 3. The fuel rate (
fuel
m
) versus injected fuel rate (
fuel,injected
m
) corresponding to the minimum CO
2
emission (F
min
)
International Journal of Energy and Environment (IJEE), Volume 6, Issue 2, 2015, pp.175-190
ISSN 2076-2895 (Print), ISSN 2076-2909 (Online) ©2015 International Energy & Environment Foundation. All rights reserved.
185
0 20 40 60 80 100
250
275
300
325
350
375
400
425
plastic injection
pulverized coal injection
m
coke
/(kg·t
-1
)
m
fuel,injected
/(kg·t
-1
)
Figure 4. Coke rate (m
coke
) versus injected fuel rate (
fuel,injected
m
)corresponding to the minimum CO
2
emission (F
min
)
0 20 40 60 80 100
0.40
0.44
0.48
0.52
0.56
plastic injection
pulverized coal injection
r
d
m
fuel,injected
/(kg·t
-1
)
Figure 5. Direct reduction degree of iron (
d
r
) versus injected fuel rate (
fuel,injected
m
) corresponding to the
minimum CO
2
emission (F
min
)
From Figures 2 and 3, one can see that the minimum CO
2
emission (
min
F
) and its corresponding fuel rate
(
fuel
m
) decrease when the plastic injection rate (
plastic
m
) increases. In contrast, the minimum CO
2
emission
(
min
F
) and its corresponding injected fuel rate (
fuel,injected
m
) increase when pulverized coal rate (
coal
m
)
increases. The reason is that the content of hydrogen in plastic is relatively high and the amount of
hydrogen takes the place of carbon to take part in reduction, and thus the carbon consumption is
decreased. Then, the minimum CO
2
emission (
min
F
) and fuel rate (
fuel
m
) decrease. In contrast, as the
content of hydrogen in coal is lower than that in plastic and a certain amount of metal oxide exist in coal,
the carbon consumption increases. Then, the minimum CO
2
emission (
min
F
) and fuel rate (
fuel
m
) decrease.
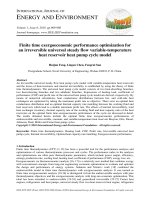
From Figures 4 and 5, one can see that the corresponding coke rate (
coke
m
) and direct reduction degree of
iron (
d
r
) decrease when injected fuel rate (
fuel,injected
m
) increases. However, the downtrend of both direct
reduction degree of iron (
d
r
) and coke rate (
coke
m
) with plastic injection is more obvious than that with
pulverized coal injection. As a certain amount of carbon is replaced by the injected fuel, the coke rate
(
coke
m
) with plastic injection or pulverized coal injection decreases. As part of hydrogen in the injected
fuel takes part in direct reduction of iron (
d
r
), the direct reduction degree of iron (
d
r
) decreases. In
International Journal of Energy and Environment (IJEE), Volume 6, Issue 2, 2015, pp.175-190
ISSN 2076-2895 (Print), ISSN 2076-2909 (Online) ©2015 International Energy & Environment Foundation. All rights reserved.
186
addition, as hydrogen content of plastic is higher than that of pulverized coal, the downtrend of direct
reduction degree of iron (
d
r
) with plastic injection is more obvious than that with pulverized coal
injection.
From Figures 2-5, one can see that plastic injection is more efficient in both coke conservation and
decrease of direct reduction degree of iron (
d
r
) when the hydrogen content of plastic is higher than that
of pulverized coal.
4.2.2 Influence of carbon-hydrogen mass ratio of plastic on optimization results
The carbon-hydrogen mass ratio of plastic (
C/H,plastic
n
) means the ratio of the mass of carbon to the mass of
hydrogen in plastic. Figures 6 and 7 show the relationships among the minimum CO
2
emission (
min
F
), its
corresponding direct reduction degree of iron (
d
r
), coke rate (
coke
m
) and the carbon-hydrogen mass ratio
of plastic (
C/H,plastic
n
), respectively.
5 6 7 8 9
352
356
360
364
368
m
coke
/(kg·t
-1
)
n
C/H,plastic
Figure 6. Coke rate (m
coke
) versus carbon-hydrogen mass ratio of plastic (
/,C H plastic
n
)corresponding to the
minimum CO
2
emission (F
min
)
5 6 7 8 9
1170
1180
1190
1200
1210
1220
1230
1240
n
C/H,plastic
F
min
/(kg·t
-1
)
0.48
0.50
0.52
0.54
r
d
F
min
r
d
Figure 7. The minimum CO
2
emission (F
min
) and the corresponding direct reduction degree of iron (r
d
)
versus carbon-hydrogen mass ratio of plastic (n
C/H,plastic
)
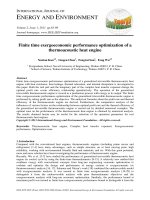
Figure 6 shows that the coke rate (
coke
m
) corresponding to the minimum CO
2
emission (
min
F
) decreases
with the decrease of carbon-hydrogen mass ratio of plastic (
C/H,plastic
n
). This is due to the fact that the mass
International Journal of Energy and Environment (IJEE), Volume 6, Issue 2, 2015, pp.175-190
ISSN 2076-2895 (Print), ISSN 2076-2909 (Online) ©2015 International Energy & Environment Foundation. All rights reserved.
187
of hydrogen getting into blast furnace increases with the decreases of carbon-hydrogen mass ratio of
plastic (
C/H,plastic
n
), as well as the mass of hydrogen involved in direct reduction of iron. As a result, the
mass of carbon involved in direct reduction of iron (
d
r
) decreases. Thus, the coke rate (
coke
m
) decreases
with the decrease of carbon-hydrogen mass ratio of plastic (
C/H,plastic
n
).
Figure 7 shows that both the minimum CO
2
emission (
min
F
) and its corresponding direct reduction degree
of iron (
d
r
) decrease with the decrease of carbon-hydrogen mass ratio of plastic (
C/H,plastic
n
). As has been
noted, coke rate decreases with the decrease of carbon-hydrogen mass ratio of plastic (
C/H,plastic
n
). The
injected fuel rate (
fuel,injected
m
), however, is not changed. Therefore, both fuel rate (
fuel
m
) and carbon
consumption decrease, and the minimum CO
2
emission (
min
F
) decreases. As a result of decreasing
carbon-hydrogen mass ratio of plastic (
C/H,plastic
n
), the mass of hydrogen involved in reduction increases
and the level of indirect reduction are improved. Thus, the direct reduction degree of iron (
d
r
) decreases.
From Figures 6 and 7, one can conclude that injecting plastic with a low carbon-hydrogen mass ratio
(
C/H,plastic
n
) is more beneficial to coke conservation, emission reduction and strengthening smelting than
injecting plastic with a high carbon-hydrogen mass ratio (
C/H,plastic
n
).
4.2.3 Influences of blast parameters on optimization results
Figures 8-10 show the relationships among the minimum CO
2
emission (
min
F
) and its corresponding coke
rate (
coke
m
), blast temperature (
b
T
), blast oxygen enrichment degree (
f
), and blast humidity (
),
respectively.
From Figure 8, one can see that the minimum CO
2
emission (
min
F
) and its corresponding coke rate
(
coke
m
) decrease when blast temperature (
b
T
) increases. The calculations show that the minimum CO
2
emission (
min
F
) and its corresponding coke rate decrease about 3.35 kg/t-hot metal and 1.07 kg/t-hot
metal, when blast temperature (
b
T
) increases about 10
°C
. Figure 9 shows that both the minimum CO
2
emission (
min
F
) and its corresponding coke rate (
coke
m
) increase when blast oxygen enrichment degree
(
f
) increases. Figure 10 shows that the minimum CO
2
emission (
min
F
) and its corresponding coke rate
(
coke
m
) increase when blast humidity (
) increases.
From Figures 8 and 10, one can conclude that the technology of improving blast temperature (
b
T
) or
dehumidifying blast are beneficial for coke conservation and emission reduction. From Figure 9, one can
conclude that blast oxygen enrichment degree (
f
) should be controlled within a proper range as
emission can be increased by a high blast oxygen enrichment degree (
f
).
1080 1120 1160 1200 1240
1005
1020
1035
1050
1065
1080
T
b
/
o
C
F
min
/(kg·t
-1
)
m
coke
F
min
270
275
280
285
290
m
coke
/(kg·t
-1
)
Figure 8. The minimum CO
2
emission (F
min
) and the corresponding coke rate (m
coke
) versus
blast temperature (T
b
)
International Journal of Energy and Environment (IJEE), Volume 6, Issue 2, 2015, pp.175-190
ISSN 2076-2895 (Print), ISSN 2076-2909 (Online) ©2015 International Energy & Environment Foundation. All rights reserved.
188
0 1 2 3 4 5 6
1118
1120
1122
1124
1126
1128
1130
f/%
F
min
/(kg·t
-1
)
F
min
m
coke
271.0
271.5
272.0
272.5
273.0
273.5
274.0
274.5
275.0
m
coke
/(kg·t
-1
)
Figure 9. The minimum CO
2
emission (F
min
) and the corresponding coke rate (m
coke
) versus blast oxygen
enrichment degree (f)
0.0 0.5 1.0 1.5 2.0
1014
1017
1020
1023
1026
1029
1032
1035
F
min
/(kg·t
-1
)
/%
270.0
271.5
273.0
274.5
276.0
277.5
m
coke
/(kg·t
-1
)
F
min
m
coke
Figure 10. The minimum CO
2
emissions (F
min
) and the corresponding coke rate (m
coke
) versus blast
humidity (
)
5. Conclusions
Base on material balance and energy balance of blast furnaces, an optimization model for blast furnace
iron-making with the CO
2
emission reduction as optimization objective is established by using nonlinear
programming method. The calculation program is compiled on the MATLAB, and the model is solved
by using SQP algorithm in the optimization toolbox of the MATLAB. Comparative analyses for the
effects of plastic injection and pulverized coal injection on the CO
2
emissions of the blast furnace are
performed. The effects of carbon-hydrogen mass ratio of plastic, blast temperature, blast oxygen
enrichment degree of blast and blast humidity on coke rate and direct reduction degree of iron are
analyzed. The results show that plastic injection is beneficial for decreasing coke rate, fuel rate and direct
reduction degree of iron when injecting plastic with a low carbon-hydrogen mass ratio. The CO
2
emission with plastic injection is less than that with pulverized coal injection. Plastic injection with a low
carbon-hydrogen mass ratio can do more to decrease coke rate and emission.
Acknowledgments
This paper is supported by the National Key Basic Research and Development Program of China (973)
(Project No. 2012CB720405).
International Journal of Energy and Environment (IJEE), Volume 6, Issue 2, 2015, pp.175-190
ISSN 2076-2895 (Print), ISSN 2076-2909 (Online) ©2015 International Energy & Environment Foundation. All rights reserved.
189
References
[1] Sen P K. CO2 accounting and abatement: an approach for iron and steel industry. J. Trans. Indian
Inst. Met., 2013, 66(5-6): 711-721.
[2] Sarker T, Coahan M. Energy sources and carbon emissions in the iron and steel industry sector in
South Asia. J. IJEEP, 2013, 3(1): 30-42.
[3] Kundak M, Lazic L, Crinko J. CO2 emissions in the steel industry. J. Metalurgija, 2009, 3(48):
193-197.
[4] Hasanbeigi A, Lynn K, Marlene A. Emerging Energy-Efficiency and Carbon Dioxide Emissions-
Reduction Technologies for the Iron and Steel Industry. Berkeley: Lawrence Berkeley National
Laboratory, 2013.
[5] Ghanbari H, Helle M, Saxen H. Process integration of steelmaking and methanol production for
decreasing CO2 emissions - A study of different auxiliary fuels. J. Chem. Eng. Processing, 2012,
61: 58-68.
[6] Ghosh A, Majumdar S K. Modeling blast furnace productivity using support vector machines. J.
Int. J. Adv. Manuf. Techno, 2011, 52(9-12): 989-1003.
[7] Gao C H, Zhou Z M, Chen J M. Assessing the predictability for blast furnace system through
nonlinear time series analysis. J. Ind. Eng. Chem. Res., 2008, 47(9): 3037-3045.
[8] Hussain M M. Ore Reduction Kinetics and Simulation of a Lead Blast Furnace. The University of
New Brunswick, 1987.
[9] Chu M. Study on super high efficiency operations of blast furnace based on multi-fluid model. D.
Sendai: Tohoku University, 2004.
[10] Han Y H, Wang J S, Lan R Z. Kinetic analysis of iron oxide reduction in top gas recycling oxygen
blast furnace. J. Iron-making and Steelmaking, 2012, 39(5): 313-317.
[11] Rasul M G, Tanty B S, Mohanty B. Modeling and analysis of blast furnace performance for
efficient utilization of energy. Appl. Therm. Eng., 2007, 27(1): 78-88.
[12] Emre E M, Gürgen S. Energy balance analysis for Erdemir blast furnace number one. Appl.
Therm. Eng., 2006, 26(11-12): 1139-1148.
[13] Ziebik A, Stanek W. Energy and exergy system analysis of thermal improvements of blast-furnace
plants. Int. J. Energy Res., 2006, 30(2): 101-114.
[14] Ziebik A, Lampert K, Szega M. Energy analysis of a blast-furnace system operating with the
Corex process and CO2 removal. Energy, 2008, 33(2): 199-205.
[15] Helle H, Helle M, Saxen H. Mathematical optimization of iron-making with biomass as auxiliary
reductant in the blast furnace. ISIJ Int., 2009, 49(9): 1316-1324.
[16] Helle H, Helle M, Saxen H. Nonlinear optimization of steel production using traditional and novel
blast furnace operation strategies. Chem. Eng. Sci., 2011, 66(24): 6470-6481.
[17] Yang T J, Gao B, Lu H S. Optimization aimed at the lowest coke consumption by model and
analysis of the application. J. University. Sci. Techn. Beijing, 2001, 23(4): 305-307 (in Chinese).
[18] Zhang Q, Yao T, Cai J, Shen M. On the multi-objective optimal model of blast furnace iron-
making process and its application. J. Northeastern(Nature Sci.), 2011, 32(2): 270-273 (in
Chinese).
[19] Minoru A, Tasturo A, Michitaka S. Development of waste plastics injection process in blast
furnace. ISIJ. Int., 2000, 40(3): 244-251.
[20] Dongsu K, Sunghye S, Seungman S. Waste plastics as supplemental fuel in the blast furnace
process: improving combustion efficiencies. J. Hazard. Mater., 2002, 94(3): 213-222.
[21] Minoru A, Masahiko K, Hidekazu T. Evaluation of waste plastics particle for blast furnace
injection. J. Japan Inst. Energy, 2012, 91(2): 127-133.
[22] Biswas A K. Principles of blast furnace iron-making: Theory and practice. Brisbane: Cootha,
1981.
[23] Kieatv B I, Yaroshenko Y G, Suchkov V D. Heat Exchange in Shaft Furnace. Oxford: Pergamon
Press, 1967.
[24] Ding J, Gao B, Wang S, Zhang Q. Effect of silicon content in molten iron on carbon emission in
blast furnace. J. Res. Iron Steel, 2011, 39(5): 1-3 (in Chinese).
[25] Na S R. Differentiation and Analyses of Iron-Making Calculations. Beijing: Metallurgical Industry
Press, 2010 (in Chinese).
[26] Wang S L. Metallurgy of Iron and Steel (Iron-Making Part). Beijing: Metallurgical Industry Press,
2013 (in Chinese).
International Journal of Energy and Environment (IJEE), Volume 6, Issue 2, 2015, pp.175-190
ISSN 2076-2895 (Print), ISSN 2076-2909 (Online) ©2015 International Energy & Environment Foundation. All rights reserved.
190
[27] Venkataraman P. Applied Optimization with MATLAB Programming (2nd ed.). Hoboken: John
Wiley & Sons, Inc., 2009.
[28] Zhu Z B, Zhang K C. A new SQP method of feasible directions for nonlinear programming. Appl.
Math. Comput., 2004(148): 121-134.
Xiong Liu received his BS Degree in 2011 from the Changsha University of Science and Technology
and his MS Degree in 2013 from the Naval University of Engineering, P R China. He is pursuing for his
PhD Degree in power engineering and engineering thermophysics from Naval University of
Engineering, P R China. His work covers topics in engineering thermodynamics and optimization for
iron and steel process. Dr Liu is the author or coauthor of 4 peer-refereed articles.
Xiaoyong Qin received all his degrees (BS, 2000; PhD, 2005) in power engineering and engineering
thermophysics from the Naval University of Engineering, P R China. His work covers topics in finite
time thermodynamics, technology support for propulsion plants and optimization for iron and steel
process. Associate Professor Qin is the author or coauthor of over 40 peer-refereed articles (over 20 in
English journals).
Lingen Chen received all his degrees (BS, 1983; MS, 1986, PhD, 1998) in power engineering and
engineering thermophysics from the Naval University of Engineering, P R China. His work covers a
diversity of topics in engineering thermodynamics, constructal theory, turbomachinery, reliability
engineering, technology support for propulsion plants and optimization for iron and steel process. He had
been the Director of the Department of Nuclear Energy Science and Engineering, the Superintendent of the
Postgraduate School, and the President of the College of Naval Architecture and Power. Now, he is the
Direct, Institute of Thermal Science and Power Engineering, the Director, Military Key Laboratory for
Naval Ship Power Engineering, and the President of the College of Power Engineering, Naval University of
Engineering, P R China. Professor Chen is the author or co-author of over 1430 peer-refereed articles (over
635 in English journals) and nine books (two in English).
E-mail address: ; , Fax: 0086-27-83638709 Tel: 0086-27-83615046
Fengrui Sun received his BS Degrees in 1958 in Power Engineering from the Harbing University of
Technology, P R China. His work covers a diversity of topics in engineering thermodynamics,
constructal theory, reliability engineering, and marine nuclear reactor engineering. He is a Professor in
the College of Power Engineering, Naval University of Engineering, P R China. Professor Sun is the
author or co-author of over 850 peer-refereed papers (over 440 in English) and two books (one in
English)