THE MECHANISM OF PPARN3 MEDIATED DOWN REGULATION OF SODIUM HYDROGEN EXCHANGER 1 (NHE1) GENE EPXRESSION AND ITS INHIBITION BY ESTROGEN RECEPTOR n1 2
Bạn đang xem bản rút gọn của tài liệu. Xem và tải ngay bản đầy đủ của tài liệu tại đây (6.14 MB, 42 trang )
68
3. RESULTS
3A PPARγ-MEDIATED REGULATION OF NHE1
3A.1 PPARγ AND THE EXPRESSION OF NHE1
It has been shown that activation of peroxisome proliferator-activated receptor γ
(PPARγ) inhibits proliferation of multiple cancer cells both in vitro and in vivo;
however, the downstream targets responsible for this anti-tumorigenic effect
remain unidentified. Our group previously identified a putative peroxisome
proliferator response element (PPRE) in the promoter region of the Na
+
/H
+
transporter gene NHE1. The first aim of this study was to investigate the role of
NHE1 in PPARγ-mediated anti-proliferative effect in breast cancer cells and the
mechanism by which PPARγ regulates NHE1 expression.
3A1.1 Identification of putative PPRE on NHE1 promoter
As a classical nuclear receptor, PPARγ has been shown to be involved in
transcription regulation of various target genes. The binding of the PPARγ to
Peroxisome Proliferator Response Element (PPRE) either represses (Ricote et al.,
1999) or activates (Barak et al., 1999) the target gene, depending on the cofactors
recruited.
To establish NHE1 as a bona fide target gene of PPARγ, we first examined the 5’-
proximal promoter region of human NHE1 for any presence of potential
Peroxisome Proliferator Response Element (PPRE). The DNA sequence of NHE1
promoter 5 kb upstream of the transcription start site was extracted from NCBI
69
. (Accession number: L25272). Consensus PPRE
typically consists of Direct Repeat (DR) of AGGTCA spaced by one nucleotide
(DR1). However, binding of PPAR to direct repeat of AGGTCA spaced by two
nucleotides (DR2) has also been found in the promoter of myeloperoxidase (MPO)
gene (Kumar et al., 2004). DNA sequence analysis for potential DR1 and DR2
revealed a putative PPRE in the human NHE1 promoter region between –977 to –
990 upstream of TATA box (Figure 1A). The putative PPRE is located in a
primate-specific Alu reporter response element (AluRRE), which is reported to be
recognized by different nuclear receptors (Vansant and Reynolds, 1995).
Sequence alignment of AluRRE in NHE1 with that found in MPO revealed high
sequence similarity (Figure 1B). The putative PPRE in NHE1 contains only one
mismatch in nucleotide sequence compared to PPRE of MPO. Though not
optimal, binding of PPARγ to DR2 was previously demonstrated on MPO
promoter (Kumar et al., 2004). High sequence similarity between MPO and
NHE1 PPRE predicts possibility of PPARγ binding to DR2 in NHE1 promoter,
and subsequent regulation of NHE1 gene expressions in a similar manner as MPO
gene. Besides high sequence similarity to DR2 in MPO, the hexamer sequence on
NHE1 is identical to the first half of the consensus PPRE. Alignment with
consensus PPRE (Figure 1B) highlights the exact match in the first hexamer
sequence of identified NHE1 PPRE to that in classical PPRE.
A list of known PPAR target genes containing the sequence of their
corresponding PPRE was compiled in Table 1. As shown, majority of PPRE from
literature composes of general DR1 consensus of AGGTCA N AGGTCA with a
70
few mismatches in nucleotides. This general pattern of 6-N-6 is relatively
conserved in all PPREs, and the identified NHE1 PPRE bears high sequence
similarities to these PPREs.
In this section, we identified a putative PPRE –977 to –990 upstream of TATA
box, after searching through NHE1 promoter for potential motifs of DR1 or DR2.
(A)
-1344
GGAATCGCATATCAAGCTTTCCAGTGATTCCATTGTACAGCCATGATCCCTTGAACCTCACCAA
-1280
TTTCAACCAAACTATAGGTTCAAATTTAAGTTCCACTACTTAAAGCATGCCACTGTTGTGGGTT
-1216
GAATTGTGTCCCGGCAAAAGAAGTTGAAGTCCTAATGCCCAGTGCCTATGAAGATGGACTAATT
-1152
AGGATGCAGTCTTTGAAGATGTTCAGGTTAAGATGAGGTAATTACGTTGGATTTCTAATCCAAT
-1088
GACTGGTGTCCTTATAAAAAGGGGAAATCTGGCTGGGGGTTGTGGCTTACCCCTGTAATCCCAG
-1024
CACTTTGGGAGGCCGAGGCGGGTGGATCACCTGAGGTCAGGAGTTCGAGACCAGCCTGACCAAC
-0960
ATGGTGAAACCCCATCTCTACTAAAAATACAAAAATTAGCTGGACGTGGTGGTGGGTGCCAGTA
-0896
ATCCCAGCTACTCTGGAGGCTGAGGCAGGAGAATCGCTTGAATCCAGGAGGCAGAGGTTGCATT
-0832
GAGCTGAGATGGCGCCACCGCACTCCAGCCTGGGCAACAAGAGCCAGACTCTATCTCAAAAAAA
-0768
ATAAAAATAAAAATAAAGTGTGGGCGGGGAATCTGGACGCAGAGACAGAGACACCAGGAGAACT
-0704
CCATGGAATACCAGATAGTCCTAACAAACCACTGGAAGGTAGGAGAAAGGCATGGGACAGATTC
-0640
TCCCTCATAGCTCTCAGCTGAAACCAACCCTGCCAACACCTAGATCCGACCTCCAGCCTCCAGA
-0576
ACTGTGAGACAATCAATTTCTGTTGTTGCAGCCACCCAGTTTGGGGTGATACTTTGTTACGGCA
-0512
GCCCTAGTAAGCAATACAACTACTTGCATAGTAGCCAGGGGACTCTCTTCACCTGTTTCCTCAT
-0448
CTGTAAAAGTGGAATTGTAATAATGTGCCAGGGTGCATTCCAAATAGTTTACACGGATTGTCTC
-0384
AGTCATTACATCATCCCTCTGACATAGTCACTATTACTGTCTCTACTTAACAGATGAGAAAGTT
-0320
GTGAAACAGGTTAAGTAACTTGCTCAAGGTCACACGGTAACTAAATACATAAACTAATAATACA
-0256
TTCTTCACAGGATTATTCGAAAGCCCTTATGAGACTGCAGATGTGGACGTGAAATCGTTTTGTA
-0192
AGTAGTCGGCATTTTACTCGCGTTAGTGAGGTTCTCTGTATATTCAGGACTTTTTTTTTTTTTT
71
-0128
TTTTTTGTCATCTCTGACTCTCCTTCCTCTTCCTACGCGATACTTCTTTCCCTCGGCGACAGGG
-0064
GCCGCTGCGCTGGGCGGGTGCCGACGGTCTCTCTAGCCCGCCGCACCGGCTGCTCGCTGGTGCC
-0000 TATAAGTGACAGCGCCGGGCTCAGCTAGGCTTCAGTCTGCTGCGGCC
(B)
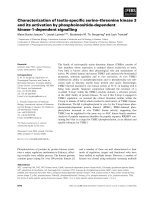
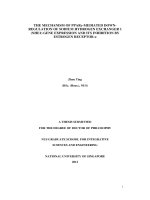
Figure 1: Sequence Analysis of NHE1 Promoter
(A) Sequence of 5’ proximal promoter region 1344bp upstream of human NHE1
gene was retrieved from NCBI (Accession # L25272). Bold denotes Alu element
(Alusq) whereas TATA signal denotes start of gene. The underlined sequences are
four hexamer repeats that are present in AluRRE. (B) The AluRRE of NHE1
promoter is aligned with AluRRE of myeloperoxidase (MPO) (Kumar et al.,
2004).The putative PPRE in 5’ proximal promoter region of NHE1 is aligned with
PPRE of PTEN (Patel et al., 2001) and the consensus PPRE.
Gene name
Consensus
Species
PubMED ID
Cytochrome P450 A1
AGGGTA A
AGTTCA
Rat
7887901
Fatty acid binding protein(L
-
FABP)
GGGGCA A
AGGGCA
Mouse
9933587
HMG
-
CoA synthase
AGGCCA T
Rat
1487072
72
AGGTCA
Peroxisomal enoyl-CoA hydratase/3-
hydroxyacyl-CoA dehydrogenase
AGGTCC T
AGTTCA
Rat
1502166
Cytochrome P450 A6
AGGGCA A
AGTTGA
Rat
1326542
Malic enzyme
GGGTCA A
AGTTGA
Rat
7929410
Phosphoenolpyruvate
carboxykinse(PEPCK2)
GGGTGA A
ATGTGC
Mouse
7799943
Phosphoenolpyruvate
carboxykinse(PEPCK1)
CGGCCA A
AGGTCA
Mouse
7799943
Acyl
-
CoA oxidaseA
AGGACA A
AGGTCA
Rat
1537328
Adipocyte lipid binding protein
(ALBP/aP27)
GGATCA G
AGTTCA
Mouse
7926726
Acyl
-
CoA oxidaseB
AGGTAC A
AGGTCA
Mouse
1537328
Acyl
-
CoA synthase
AGGGCA T
CAGTCA
Rat
7642600
Muscle
-
type carnitine
palmitolytransferase
AGGGAA A
AGGTCA
Human
9535828
c
-
Cbl
-
associating protein
AGGCTA A
AGGTCA
Mouse
10734046
Fatty
acid transport protein
GGGCCA A
AGGTCT
Rat
7913466
Lipoprotein lipase
GGGGGA A
AGGGCA
Human
8895578
Uncoupling protein I
TGGTCA A
GGGTGA
Mouse
8668156
Table 1: PPRE sequences from literature (Adapted from Venkatachalam et.
al., 2009) (Venkatachalam et al., 2009)
73
3A1.2 Down-regulation of NHE1 by PPARγ ligands.
Intrigued by the presence of putative PPRE on NHE1 promoter, we next assessed
the effect of PPARγ ligands on NHE1 expression both at protein level and mRNA
level. To this end, three human breast cancer cell lines, MCF-7, MDA-MB-231
and T47D were selected to be exposed to various PPARγ ligands at different
doses. The three cell lines express different levels of endogenous PPARγ receptor
(Figure 2D).
Prostaglandin J
2
and its derivatives are reported to be activators of peroxisome
proliferator-activated receptors α and γ (Kliewer et al., 1995). Among them, the
PGJ
2
metabolite 15-deoxy-12,14-PGJ
2
has been identified to be the most potent
endogenous ligand for PPARγ. It is found to bind directly to PPARγ receptor and
elicit efficient differentiation of C3H10T1/2 fibroblasts to adipocytes (Lehmann
et al., 1995). The effect of 15d-PGJ
2
on NHE1 protein expression was analyzed
using Western blot. The result showed that after 24h of exposure to 1µM, 3µM
and 5µM of 15d-PGJ
2
, the NHE1 protein decreased in a dose-dependent manner
in MCF-7 cells (Figure 2A).
Besides the endogenous PPARγ ligand, thiazolidinedione (TZD) is a class of
synthetic PPARγ ligands which are clinically available for treatment of type 2
diabetes. Members of TZDs include troglitazone, rosiglitazone, and pioglitazone,
marketed as Rezulin, Avandia and Actos respectively. Ciglitazone though not
available in market, is a prototypical compound for the TZD class. To investigate
74
if these synthetic PPARγ ligands produce similar effect of repressing NHE1
protein expression, MCF-7 cells were treated with troglitazone at increasing doses
for 24h. Immunoblotting of the NHE1 protein showed similar dose-dependent
decrease in NHE1 protein level (Figure 2B). These data suggest that the effect of
PPARγ ligands on NHE1 protein is not drug specific, but is conserved in both the
endogenous and synthetic PPARγ ligands.The difference in extent of NHE1
repression by 15d-PGJ
2
and synthetic PPARγ ligands may be attributed to the
different affinities of these ligands for PPARγ receptor (Boitier et al., 2003).
To further demonstrate that the down-regulation of NHE1 protein expression was
not cell type specific, MDA-MB-231 and T47D were treated with 3µM and 5µM
of 15d-PGJ
2
for 24h. In agreement with the results obtained for MCF-7, Western
blot analysis of NHE1 protein showed similar dose-dependent down-regulation of
NHE1 protein level in both cell lines (Figure 2E). Interestingly, the levels of
PPARγ protein in these three cell lines are ranked in the order of MDA-MB-231>
MCF-7> T47D (Figure 2D). This difference in PPARγ expression correlated well
with the repressive efficacy of 15d-PGJ
2
on NHE1. In T47D cells that contain
lowest level of PPARγ receptor, 15d-PGJ
2
showed the least pronounced effect on
NHE1 repression, while in MDA-MB-231 cells which express the highest amount
of PPARγ, the same drug induced the most significant down-regulation of NHE1.
To further verify that the reduction in NHE1 protein level was a result of
transcriptional repression of NHE1 gene, we quantified the mRNA expression of
NHE1 using real-time PCR. Cells were treated with various PPARγ ligands for
16h, before the total RNA was extracted and analyzed for its mRNA content.
75
Consistent with the results obtained for NHE1 protein expression, mRNA
expression of NHE1 decreased in a concentration-dependent manner in MCF-7
cells treated with various PPARγ ligands. It is noteworthy that 15d-PGJ
2,
as in the
case of NHE1 protein expression, remained to be the most efficacious in down-
regulating NHE1 mRNA compared to troglitzone and ciglitazone: 3µM of 15d-
PGJ
2
induced 55% decrease from the vehicle control (Figure 3A), whereas the
similar extent of reduction was only achieved at 15µM of troglitazone and at
10µM of ciglitazone respectively (Figure 3B, C). In agreement with the result of
NHE1 protein, NHE1 mRNA in MDA-MB-231 cells was also more sensitive to
repression by 15d-PGJ
2
-induced PPARγ activation compared to MCF-7 cells. In
MCF-7 cells treated with 5µM of 15d-PGJ
2
, NHE1 mRNA level decreased to 40%
of the vehicle control, while the same concentration reduced NHE1 mRNA to 20%
of the vehicle control in MDA-MB-231 cells (Figure 3D). These data again
demonstrated that the repressive efficacy of PPARγ ligand on NHE1 expression
in different cell lines mirror-imaged the endogenous level of PPARγ receptor
present.
Together, these results confirm that PPARγ agonists down-regulate NHE1 protein
as well as mRNA in three breast cancer cell lines.
76
77
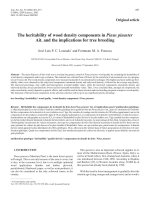
Figure 2: PPARγ ligands down-regulate NHE1 protein levels in human
breast cancer cells.
MCF-7 (3 X10
5
cells/6-well dishes) were exposed to different PPARγ ligands:
(A) 15d-PGJ
2
, (B) troglitazone for 24h, and the protein expression of NHE1 was
analyzed by Western blot. (C) MDA-MB-231 (2X10
5
cells/6-well dishes), and
T47D cells (3 X10
5
cells/6-well dishes) were treated with increasing doses of 15d-
PGJ
2
. NHE1 protein expression was then determined by Western blot, NHE1
band intensity was normalized to β-actin. (D) MCF-7 (3 X10
5
cells/6-well dishes),
MDA-MB-231 (2X10
5
cells/6-well dishes) and T47D cells (3 X10
5
cells/6-well
dishes) were subjected to nuclear-cytosol fractionation as described in Materials
and Methods. The PPARγ levels in nuclear lysates were analyzed by Western
blot, using PARP as a loading control.
78
79
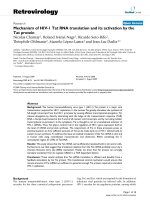
Figure 3: PPARγ ligands down-regulate NHE1 mRNA levels in human
breast cancer cells.
MCF-7 (3 X10
5
cells/6-well dishes) cells were exposed to increasing doses of
PPARγ ligands: (A) 15d-PGJ
2
, (B) ciglitazone, (C) troglitazone for 16h, and the
fold change of NHE1 mRNA expression was determined by Taqman real-time
PCR, normalized to the endogenous control: human 18s. Relative NHE1 mRNA
expression is expressed as percentage of control. Results denote means +/-SD
80
computed from two experiments done in duplicate. (D) MCF-7 (3 X10
5
cells/6-
well dishes), MDA-MB-231 (2X10
5
cells/6-well dishes) and T47D cells (3 X10
5
cells/6-well dishes) were exposed to increasing doses of 15d-PGJ
2
for 24h, and
the mRNA expression of NHE1 was analyzed by real-time PCR, normalized to
the endogenous control: human 18s. Relative NHE1 mRNA expression is
expressed as percentage of control. Results denote means +/-SD computed from
two experiments done in duplicate. *, p<0.05, **, p<0.01, treated versus untreated
control.
3A1.3 Down-regulation of NHE1 by PPARγ ligands is PPARγ-dependent.
The data so far demonstrated that cells that have higher level of PPARγ are more
sensitive to PPARγ ligands both at protein and mRNA level. As shown previously
in figure 2, In T47D cells, where PPARγ receptor was present at low level, the
inhibitory effect of 15d-PGJ
2
on NHE1 expression was significantly weaker as
compared to MDA-MB-231 cells which express higher level of PPARγ receptor.
These results suggest that PPARγ could be responsible for ligand-induced down-
regulation of NHE1 expression.
PPARγ ligands were reported to have both PPARγ dependent and independent
effects. For instance, it was shown that PPARγ was required for positive effects of
its ligands on lipid metabolism in macrophage, but not for its repressive effects on
cytokine production and inflammation (Chawla et al., 2001). To further confirm
that the inhibitory effect of PPARγ ligands on NHE1 was indeed due to the
function of PPARγ receptor, we over-expressed murine PPARγ in T47D cells
which expressed low endogenous level of PPARγ. The effect of 15d-PGJ
2
on
NHE1 expression in T47D transfected with plasmid encoding murine PPAR
81
(mPPARγ) or with empty parent vector was assessed both at protein and mRNA
level. As expected, overexpression of PPARγ in T47D induced a more significant
reduction in NHE1 protein expression compared to cells transfected with the
vector control (Figure 4A of published paper) (Kumar et al., 2009). Consistent
with the result obtained from Western blot of NHE1 protein, real-time PCR assay
of NHE1 mRNA also demonstrated a more pronounced decrease in NHE1 mRNA
in cells overexpressing PPARγ compared to cells transfected with the parent
vector (Figure 4A). Interestingly, the NHE1 protein and mRNA level decreased
upon PPARγ overexpression even in the absence of exogenous ligand treatment.
This could be explained by the presence of endogenous PPARγ ligands activating
exogenous PPARγ in transfected cells, hence repressing the NHE1 transcription
even in the absence of exogenous ligands.
Our previous results demonstrated that both synthetic and endogenous ligands of
PPARγ were capable of inducing down-regulation of PPARγ NHE1 and mRNA.
Among them, the inhibitory effect was the most pronounced in cell lines
expressing higher level of PPARγ receptor. These observations lead to the
speculation of PPARγ receptor’s involvement in PPARγ ligand-induced down-
regulation of NHE1. The data obtained from PPARγ- overexpressing T47D
further confirmed the important role of functional PPARγ receptor in PPARγ
ligand-induced repression of NHE1 protein and mRNA.
82
Figure 4: Overexpression of PPARγ enhances the inhibition of 15d-PGJ
2
on
NHE1 expression.
(A) T47D (2 X10
5
cells/6-well dishes) were transfected with 5µg plasmid
encoding mouse PPARγ (mPPARγ) or empty pCMX (vector) as described in
Materials and Methods. 48h after transfection, cells were treated with increasing
doses of 15d-PGJ
2.
Overexpression of PPARγ after 48h of transfection is shown at
top panel. After 16h of drug treatment, the mRNA expression of NHE1 was
analyzed by real-time PCR, normalized to the endogenous control: human 18s.
Relative NHE1 mRNA expression is expressed as percentage of control. Results
denote means +/-SD computed from two experiments done in duplicate. *,
p<0.05.
3A1.4 Silencing PPARγ abrogates the effect of PPARγ ligand on NHE1.
83
Another means to assess whether the observed down-regulation of NHE1
expression was mediated by PPARγ receptor was by silencing PPARγ protein.
PPARγ silencing was performed in MDA-MB-231 cells as described in Materials
and Methods with scrambled si RNA as a negative control or with PPARγ si RNA.
These two cell lines were chosen because they express higher level of endogenous
PPARγ and showed greater sensitivity to PPARγ ligands on NHE1 repression.
After 48h of silencing, the cells were assayed using Western blot to verify PPARγ
level. In both cell lines, there was effective reduction in PPARγ receptor level
(Figure 5). Transfected cells were then exposed to increasing dose of 15d-PGJ
2
for 24h before they were harvested and checked for NHE1 expression using
Western blot. As expected, the cells silenced with negative si RNA showed down-
regulation of NHE1 in both cell lines. This observation was consistent with
previous findings in figure 1 that PPARγ ligands repressed NHE1 in a
concentration-dependent manner. Interestingly, silencing PPARγ receptor
drastically abrogated the inhibitory effect of 15d-PGJ
2
on NHE1 expression in
both MDA-MB-231 cells (Figure 5). However, the reversal of the down-
regulation of NHE1 by silencing was more significant at 3µM than 5µM of 15d-
PGJ
2
. In silenced cells, exposure to 3µM of 15d-PGJ
2
showed no significant
reduction in NHE1 protein level from the untreated control. On the other hand,
3µM of 15d-PGJ
2
drastically down-regulated NHE1 protein in cells transfected
with negative si RNA. It should also be noted that silencing PPARγ could not
completely block the effect of 15d-PGJ
2
on NHE1 expression at higher
concentration of 5µM. This phenomenon could be explained by incomplete
84
knocking down of PPARγ receptor and its stronger activation at higher
concentration of the ligand, leading to the observed reduction in NHE1 protein
from the untreated control. The inhibition on NHE1 protein in PPARγ-silenced
cells at higher concentration of 15d-PGJ
2
could also be attributed to PPARγ-
independent effect of the ligand. The PPARγ-indepedent mechanism of PPARγ
ligand-mediated inhibition on NHE1 will be further discussed in later sections.
Figure 5: Silencing PPARγ attenuates the inhibition of 15d-PGJ
2
on NHE1
expression.
MDA-MB-231 (1.5 X 10
5
cells/6-well dishes) cells were transfected with 200ng
of PPARγ Si RNA or control Si RNA as described in Materials and Methods. 48h
after transfection, cells were treated with increasing doses of 15d-PGJ
2.
Reduced
PPARγ expression after 48h of transfection is shown at top panel. After 24h of
drug treatment, NHE1 protein expression was then determined by Western blot.
NHE1 band intensity was normalized to β-actin.
3A1.5 Pharmacologcial PPARγ antagonist abrogates the effect of PPARγ
ligand on NHE1 gene expression.
85
To further test whether PPARγ activity is required for the ligand-induced down-
regulation of NHE1 gene, PPARγ agonist, 2-chloro-5-nitrobenzanilide (GW9662)
was used. GW9662 functions as an antagonist of PPARγ by covalently modifying
cysteine
286
of the ligand binding domain, and hence preventing ligand-induced
activation of PPARγ receptor. Because the modification is irreversible, GW9662
is considered to be a non-competitive antagonist of PPARγ. Although GW9662
was reported to bind to all three PPAR subtypes, its inhibition on PPARγ is 100-
1000 times more than on PPARα and β (Leesnitzer et al., 2002). Henceforth,
GW9662 is considered as a specific PPARγ antagonist.
In order to confirm GW9662’s ability to inhibit PPARγ activation, MCF-7 cells
were transfected with 3X PPRE-Luc or pTA-luc (control plasmid) together with
Renilla plasmid as a control for transfection efficiency. Luciferase reporter assay
was then performed on transfected MCF-7 cells which were exposed to different
doses of 15d-PGJ
2
with or without 2h preincubation with GW9662. As expected,
15d-PGJ
2
significantly up-regulated PPRE reporter activity in cells that were not
exposed to GW9662 (Figure 6A), showing that the ligand was able to
transactivate PPARγ in MCF-7. However, the presence of GW9662 prior to
treatment of 15d-PGJ
2
successfully attenuated PPARγ activity in MCF-7 cells.
Although 15d-PGJ
2
was still able to activate PPRE reporter in the presence of
GW9662, the magnitude of activation was significantly lower than that without
the PPARγ antagonist (Figure 6A). This result confirms GW9662’s ability to
inhibit PPARγ-mediated luciferase reporter activity, and its role as a
pharmacological PPARγ antagonist. Furthermore, the specificity of GW9662 as a
86
PPARγ antagonist also implies that PPRE reporter activity is largely driven by
PPARγ but not other PPAR subtypes.
After establishing the function of GW9662 as a PPARγ antagonist, we tested its
ability to rescue the inhibitory effect of PPARγ ligand on NHE1 expression.
MDA-MB-231 cells were pre-incubated with GW9662 for 2h, before they were
exposed to increasing doses of 15d-PGJ
2
. Western blot and real-time PCR assays
were then performed to assess the NHE1 protein and mRNA level respectively. In
accordance with our previous findings, treatment with 15d-PGJ
2
resulted in a
dose-dependent down-regulation of NHE1 protein and mRNA. However, this
inhibitory effect by PPARγ ligand was abrogated when cells were pre-incubated
with 10µM of GW9662 (Figure 6B, C). In cells treated with 15d-PGJ
2
alone, 5µM
of the drug substantially reduced NHE1 mRNA expression. The same
concentration albeit was not able to produce a significant decrease from the
control in the presence of the PPARγ antagonist (Figure 6C).
Taken together, the above data conclusively demonstrated that GW9662 blocked
PPARγ activation and transcriptional activity by functioning as a PPARγ
antagonist. Furthermore, the suppressive effect of PPARγ ligand on NHE1
expression could be rescued by the presence of the functional PPARγ antagonist
GW9662.
87
88
Figure 6: PPARγ inhibitor abrogates the effects of 15d-PGJ
2
on PPARγ
activity and on NHE1 expression.
(A) MCF7 cells (7.5 X 10
4
cells/12-well dishes) were co-transfected with 3µg of
reporter plasmid 3XPPRE-luc and 0.3µg of renilla as described in Materials and
Methods. 48h after transfection, cells were exposed to increasing doses of 15d-
PGJ
2
for 5h with or without 2h preincubation with 15µM GW9662. The activity
of PPARγ was then determined using luciferase assay and the result was
calculated as luciferase RLU/renilla/µg total. Data represents the average +/- SD
of three experiments. (B) MDA-MB-231 (2X10
5
cells/6-well dishes) cells were
treated with increasing doses of 15d-PGJ
2
for 24h with or without 2h
preincubation with 10µM GW9662. NHE1 protein expression was then
determined by Western blot. NHE1 band intensity was normalized to β-actin. (C)
MCF-7 (3X10
5
cells/6-well dishes) cells were treated with increasing doses of
15d-PGJ
2
for 16h with or without 2h preincubation of 15µM GW9662. The
mRNA expression of NHE1 was analyzed by real-time PCR, normalized to the
endogenous control: human 18s. Relative NHE1 mRNA expression is expressed
as percentage of control. Results denote means +/-SD computed from two
experiments done in duplicate. *, p<0.05, **, p<0.01, treated versus untreated
control.
3A.2 THE MECHANISM OF PPARγ-MEDIATED DOWN-
REGULATION OF NHE1
After establishing the crucial role of activated PPARγ receptor in down-regulating
NHE1 expression, we set out to investigate the mechanism involved in the
repression of NHE1 by PPARγ.
3A2.1 Transcription-defective PPARγ abrogates the effect of PPARγ ligand
on NHE1 gene expression.
From previous sections, we used PPARγ overexpression, PPARγ silencing and
PPARγ antagonist to confirm the role of PPARγ receptor in PPARγ ligand-
89
mediated down-regulation of NHE1 gene expression. Besides, the presence of the
putative PPRE on NHE1 promoter and PPARγ ligands’ ability to down-regulate
NHE1 mRNA further implied NHE1 as a transcriptional target of PPARγ.
To test the involvement of transcriptional activity of PPARγ in its inhibitory
effect on NHE1 expression, we overexpressed a dominant-negative form of
PPARγ in breast cancer cells. Contrary to wild type PPARγ, the DNA binding
domain of dominant-negative PPARγ contains mutations of C126A and E127A,
rendering it unable to bind to DNA. As a result, this form of PPARγ retains its
ability to bind ligands but is devoid of its transcriptional activity. Luciferase
reporter assay on PPRE was performed to validate whether dominant-negative
PPARγ would lose its transcriptional activity. As expected, the dose-dependent
up-regulation in PPRE luciferase reporter activity by 15d-PGJ
2
was completely
blocked in cells transfected with dominant-negative PPARγ (Figure 7A).
As a transcription factor, PPARγ must bind to DNA for its transcriptional
activation/repression of PPRE-containing genes. We went on to test the effect of
dominant-negative PPARγ on NHE1 expression in MCF-7 cells. Our result
showed that overexpression of this dominant-negative form of PPARγ rescued the
receptor-mediated reduction in NHE1 protein expression (Figure 7B). In
agreement with the NHE1 protein expression, overexpression of dominant-
negative PPARγ equally alleviated the suppression of PPARγ on NHE1 mRNA in
MCF-7 cells (Figure 7C).
These data suggested that the mechanism involved in the repression of NHE1 by
PPARγ requires its ability to bind to the promoter region of the NHE1 gene.
90
91
Figure 7: Transfection of DNA-binding defective PPARγ abrogates the
effects of 15d-PGJ
2
on NHE1 expression.
(A) MCF-7 (7.5 X 10
4
cells/12-well dishes) cells were co-transfected with 2.5µg
of plasmid encoding DNA-binding defective PPARγ or empty vecctor, 3µg of
reporter plasmid 3XPPRE-luc and 0.3µg of renilla as described in Materials and
Methods. 48h after transfection, cells were treated with increasing doses of 15d-
PGJ
2.
The activity of PPARγ was then determined using luciferase assay and the
result was calculated as luciferase RLU/renilla/µg total. Overexpression of
PPARγ after 48h of transfection is shown at top panel. Data represents the
average +/- SD of three experiments. (B) MCF-7 (2X10
5
cells/12-well dishes),
cells were transfected with 5µg of plasmid encoding DNA-binding defective
PPARγ or empty vector as described in Materials and Methods. 48h after
transfection, cells were treated with increasing doses of 15d-PGJ
2.
After 24h of
drug treatment, NHE1 protein expression was then determined by Western blot.
NHE1 band intensity was normalized to β-actin. Overexpression of PPARγ after
48h of transfection is shown at top panel. (C) MCF-7 (2 X10
5
cells/12-well
dishes) cells were transfected with 5µg of plasmid encoding DNA-binding
defective PPARγ or empty vector as described in Materials and Methods. 48h
after transfection, cells were treated with increasing doses of 15d-PGJ
2.
After 16h
of drug treatment, the mRNA expression of NHE1 was analyzed by real-time
PCR, normalized to the endogenous control: human 18s. Relative NHE1 mRNA
expression is expressed as percentage of control. Results denote means +/-SD
92
computed from two experiments done in duplicate. *, p<0.05, **, p<0.01, treated
versus untreated control.
3A2.2 Activated PPARγ binds to the identified PPRE on NHE1 promoter.
Sequence analysis of 5’ proximal region of NHE1 gene promoter revealed a
putative PPRE present within the Alu element. The non-consensus DR2 motif is
highly similar to AGGTCAnAGGTCA found in classical PPREs. We also
confirmed PPARγ activation and translocation into nucleus upon ligand activation.
To verify the physical binding of active PPARγ to this putative PPRE in vitro, we
performed Noshift Transcripiton Factor assay.
Nuclear extract was prepared from MCF-7 and MDA-MB-231 cells treated with
or without 3µM of 15d-PGJ
2
as described in Materials and Methods. Nuclear
lysate was then incubated with biotinylated double-stranded oligonucleotides
containing NHE1 PPRE sequence of 5’-
CACCTGAGGTCAGGAGTTCGAGACCA-3’ in the presence or absence of
competitive non-biotinylated double-stranded oligonucleotides of the same
sequence. To correct for the non-specific binding of PPARγ antibody to
biotinylated double-stranded oligonucleotide itself, a negative control containing
only nuclear lysis buffer and biotinylated double-stranded oligonucleotides was
included. The fluorescence intensity corresponded to the amount of PPARγ bound
to biotinylated double-stranded PPRE. As shown in Figure 8A, 3µM of 15d-PGJ
2
significantly increased the amount of PPARγ bound to NHE1 PPRE
oligonucleotides in both MCF-7 and MDA-MB-231 cells (Figure 8A). However,