Ferroelectric gating of graphene 8
Bạn đang xem bản rút gọn của tài liệu. Xem và tải ngay bản đầy đủ của tài liệu tại đây (443.85 KB, 9 trang )
Chapter 8
Ongoing experiments
The combination of graphene with ferroelectric substrate presents an intriguing path
towards graphene based nanoelectronics, optoelectronics and photonics with non-
volatile characteristics. We have demonstrated its potential applications in memory
devices, flexible transparent electrodes and novel types of nanotransistors in chapter 4,
chapter 6 and chapter 7, respectively. In this chapter, we describe experiments which
are still in progress and could not be published within time. Section 8.1 discusses
non-volatile graphene p-n junctions; Section 8.2 demonstrates the study of optical
transmittance as a function of applied strain in graphene and the polarized light
angle.
8.1 Non-volatile p-n junctions
Research in graphene p-n junctions is an important subtopic in the graphene commu-
nity [19, 160]. Recently, we noticed that graphene p-n junctions have also been rec-
ognized for novel optoelectronics and plasmonics applications. Utilizing ferroelectric
dielectric, here we show a non-volatile graphene p-n junction by partially sandwiching
thin HSQ dielectric in ferroelectric gated graphene field-effect transistors (GFET). By
100
101
(e)
(f)
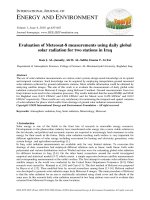
Figure 8.1: (a) Sample geometry of a finished ferroelectric gated non-volatile graphene
p-n junction device. (b) Optical image of graphene sample showing the four-terminal
geometry of the bottom electrodes. (c) Dark field image of graphene sample after
partially define HSQ layer. (d) AFM image of graphene sample after P(VDF-TrFE)
spin coating. (e) R vs. V
BG
of graphene samples before patterning HSQ layer. (f) R
vs. V
BG
of graphene samples before polarize P(VDF-TrFE) thin film.
fine tuning the HSQ layer thickness, we show that the two adjacent regimes in the
graphene working channel can be tuned independently in terms of carrier density and
polarity. The photovoltaic effect is going to be further studied using this non-volatile
graphene p-n junction device.
The sample geometry of a typical non-volatile graphene p-n junction device is
shown in Fig. 8.1a. Our graphene flakes used in this work are exfoliated from bulk
natural graphite crystals by the micromechanical cleavage. 300 nm thick SiO
2
is
underneath a graphene flake which is grown by thermal oxidation. The substrate
consists of a highly-doped, p-type Si (100) wafer, which served as a global back gate.
We define metal contacts on the graphene flake using electron beam lithography
102
(EBL) followed by thermal evaporation of Cr/Au (5/30 nm), as shown in Fig. 8.1b.
Note that in order to avoid heavy residuals of HSQ, PMMA resist is coated firstly
following EBL process to partially open a window on GFET, then HSQ is coated
on top of PMMA resist, followed by another EBL step to define the same window
region and followed by the lift-off process. After successfully defining HSQ with a
proper thickness partially on graphene field effect transistor (GFET), a ferroelectric
thin film of poly(vinylidene fluoride-trifluoroethylene 72:28) (P(VDF-TrFE)) was then
spin-coated with a thickness of approximately 0.5 µm and followed by evaporation
of the top gate by metal mask approach. From atomic force microscopy, the bright
squares are patterned HSQ region and we conclude that both HSQ and P(VDF-TrFE)
form a continuous thin film on graphene devices with slightly different crystallizations
on SiO
2
, graphene and Au areas, as shown in Fig. 8.1d. After thermally evap orating
the top gate electrodes, samples were electrically characterized at ro om temperature
in a vacuum probe station by a four contact configuration using a lock-in amplifier
with an AC excitation current of 10 nA, as shown in Fig. 8.1e. The number of
graphene layers is confirmed by Raman spectroscopy. In total, we have successfully
studied 6 samples, and all of our devices show similar results.
We first show the transport results obtained when the thickness of HSQ is 50 nm.
Fig. 8.1f shows R vs. V
BG
characteristic (Fig. 8.1f). Compared to the typical GFET
devices, two Dirac peaks were observed, which were corresponding to P(VDF-TrFE)
and HSQ doping in graphene, respectively. Fig. 8.2 shows the evolution of resistivity
of graphene as a function of applied external top gate voltage (V
T G
). Compared to
the two hysteresis peak structure obtained from ferro electric gating (Chapter 4, Fig.
4.10), an additional two more hysteresis peaks are emerging with the increase in the
103
Figure 8.2: R vs. V
T G
of graphene samples at different top gate voltages. The
thickness of HSQ is 50 nm.
external electric field. At 20 Volts, the four peak structure is still developing. These
two additional peaks are most likely due to the insufficient thickness of HSQ, which
can not effectively screen the ferroelectric gating. Consequently, the HSQ covered
regime also gets polarized. When V
T G
reaches 35 Volts, the four peak structure is
clearly seen.
To verify our speculation, we did the independent polarization measurements. Fig.
8.3a shows the 2D mapping of resistivity of graphene as a function of V
T G
and V
BG
, re-
spectively. From this, we can clearly see the dynamic evolution of the resistance peaks
as a function gate voltage. Fig. 8.3b shows the independent polarization measure-
ments. The blue colored polarization loop represents electrode/ferroelectric/electrode
device structure. As we expected, the typical hysteresis polarization loop is clearly
104
a b
Figure 8.3: a: 2D mapping of R vs. V
T G
and V
BG
. b: Corresponding
polarization measurement of the metal/P(VDF-TrFE)/metal and metal/P(VDF-
TrFE)/HSQ//metal configuration.
105
Figure 8.4: R vs. V
T G
of graphene samples at different top gate voltages. The
thickness of HSQ is 150 nm.
seen. On the contrary, we also fabricated electrode/ferroelectric/HSQ/electrode de-
vice structures for comparison and the corresponding polarization curves are colored
pink. The latter is much harder to fully polarize as compared to the former due to
the charge screening from the inserted HSQ thin layer. However, with the increase of
the external electric field, the ferroelectric thin film can also become polarized, with
a much larger coercive field in compromise.
Now we increased the thickness of HSQ layer from 50 nm to 150 nm and the
corresponding resistivity of graphene as a function of V
T G
is shown in Fig. 8.4. The
two peak structure remains, even when the top gate voltage approaches 30 Volts.
This indicates that the HSQ covered regime does not polarize with an increase of the
top gate strength. Thus, the HSQ covered regime is mainly controlled by the back
gate voltage.
Fig. 8.5 shows the summarized data of non-volatile graphene p-n junction when
106
Figure 8.5: a: R vs. V
BG
of graphene samples before PVDF coating. b: R vs. V
BG
of graphene samples after PVDF coating. c: a: R vs. V
BG
of graphene samples at
+P
r
and -P
r
dipole orientations, respectively. d: R vs. V
T G
of graphene p-n junction
devices. e: QHE of graphene p-n junction devices at cryogenic temperature. f: Single
trace of QHE of graphene p-n junction devices at zero top gate voltage.
HSQ thickness is 150 nm. At this thickness, the HSQ covered regime can effectively
depolarize the ferroelectric gating over a large external voltage range, yielding an
independent charge carrier density controlled by the V
BG
. Thus, we successfully
demonstrated a prototype non-volatile graphene p-n junction. In addition, we also
studied its charge behavior at the QHE regime (Fig. 8.5d).
8.2 Optical transmittance of strained or gated graphene
The utilization of graphene in flexible electronics and optoelectronics is expected to be
the most forthcoming. Before that, systematic studies for a thorough understanding of
the interplay between optical transmittance with electrostatic gating and mechanical
107
Force
(a) (b) (c) (d)
Figure 8.6: Illustration of device structure and systematic application of strain to
graphene.
straining are sorely needed. This is because these two aspects will be unavoidable in
such devices and hold the potential to influence the device’s performances.
To study the optical transmittance of strained graphene, the device structure and
bending measurement setup was constructed as illustrated in Fig. 8.6. A single layer
of large-scale CVD graphene was transferred onto transparent PET substrate. After
that, the sample was mounted onto the house-produced bending setup. The optical
transmittance measurement setup was illustrated in Fig. 8.7a. Fig. 8.7b shows the
pure PET substrate signal.
108
Transmittance
Transmittance
(a)
(b)
Figure 8.7: a: Optical transmittance of graphene as a function of strain and polar-
ization angle of incoming light. b: The signal from pure PET substrate.