On multi zone tracking and non gaussian noise filtering for model predictive control
Bạn đang xem bản rút gọn của tài liệu. Xem và tải ngay bản đầy đủ của tài liệu tại đây (4.11 MB, 154 trang )
ON MULTIZONE TRACKING AND NON-GAUSSIAN NOISE
FILTERING FOR THE MODEL PREDICTIVE CONTROL
WANG XIAOQIONG
(B.Eng.(Hons.),NUS)
A THESIS SUBMITTED
FOR THE DEGREE OF DOCTOR OF PHILOSOPHY
DEPARTMENT OF ELECTRICAL & COMPUTER
ENGINEERING
NATIONAL UNIVERSITY OF SINGAPORE
2014
DECLARATION
I here by declare that this thesis is my original work and it has been
written by me in its entirely.
I have duly acknowledged all the sources of information which have b een
used in the thesis.
This thesis has also not been submitted for any degree in any university
previously.
WANG XIAOQIONG
30 Mar 2014
ON MULTIZONE TRACKING AND NON-GAUSSIAN NOISE
FILTERING FOR THE MODEL PREDICTIVE CONTROL
Copyright 2014
by
WANG XIAOQIONG
Acknowledgments
I would like to thank several people who have guided, helped, assisted,
accompanied, or supported me throughout my PhD course.
Foremost, I would like to express my deepest gratitude to my supervi-
sors Prof. Ho Weng Khuen and Prof. Ling Keck Voon for the continuous
support of my Ph.D study and research, for their patience, motivation,
enthusiasm, and immense knowledge. Their guidance helped me in all the
time of research and writing of this thesis. Without their guidance and
persistent help, this dissertation would not have been possible.
My sincere thanks also goes to Prof. Tan Kok Kiong and Prof. Arthur
Tay Ee Beng, for their time and efforts in assessing my research work, the
valuable suggestions and critical questions during my qualification exami-
nation.
I would like to thank my colleagues and lab mates, Jose Vu, Qu Yifan,
Yu Chao, and Vathi for the stimulating discussions, for the accompany
when we were working together, and all the fun we have had in the last
four years. Many thanks also goes to my dearest friends, Xie Yanxi, Sun
Wen, and Li suchun, accompanied me through the happiness and sadness.
Finally, I am deeply indebted to my parents and my sister, for their
love and support, which provide me the motivation for everything.
i
Contents
Contents ii
List of Figures iv
List of Tables vii
1 Introduction 1
1.1 An Overview of Model Predictive Control . . . . . . . . . . 1
1.2 Motivation of the Thesis . . . . . . . . . . . . . . . . . . . . 3
1.3 Contribution of the Thesis . . . . . . . . . . . . . . . . . . . 7
1.4 Scope of the Thesis . . . . . . . . . . . . . . . . . . . . . . . 10
2 Model Predictive Control for Uniform Output 12
2.1 Introduction . . . . . . . . . . . . . . . . . . . . . . . . . . . 13
2.2 Algorithm of UMPC . . . . . . . . . . . . . . . . . . . . . . 15
2.2.1 Formulation of UMPC . . . . . . . . . . . . . . . . . 18
2.2.2 Control Law of UMPC . . . . . . . . . . . . . . . . . 20
2.2.3 Cost Function Comparison of UMPC and SMPC . . 24
2.3 Bake Plate Thermal Modeling . . . . . . . . . . . . . . . . . 25
2.4 Experimental Results . . . . . . . . . . . . . . . . . . . . . . 28
2.4.1 UMPC Uniformity Validation Experiments . . . . . . 33
2.4.2 UMPC Robustness Experiments . . . . . . . . . . . . 40
2.5 Conclusion . . . . . . . . . . . . . . . . . . . . . . . . . . . . 54
3 Filtering of the ARMAX process with Generalized t-
Distribution Noise: The Influence Function Approach 57
3.1 Introduction . . . . . . . . . . . . . . . . . . . . . . . . . . . 57
3.2 Maximum Likelihood Estimation of the ARMAX Process
with GT Noise . . . . . . . . . . . . . . . . . . . . . . . . . 60
3.2.1 The ARMAX Process . . . . . . . . . . . . . . . . . 60
3.2.2 The Diophantine Equation . . . . . . . . . . . . . . . 61
3.2.3 Maximum Likelihood Estimation . . . . . . . . . . . 64
3.3 Influence Function Approximation . . . . . . . . . . . . . . . 65
3.3.1 The Recursive Algorithm . . . . . . . . . . . . . . . . 66
ii
3.3.2 Mean, Variance and Outlier . . . . . . . . . . . . . . 68
3.4 Examples . . . . . . . . . . . . . . . . . . . . . . . . . . . . 69
3.4.1 Example 1: The Kalman Filter Connection . . . . . . 70
3.4.2 Example 2: Variance . . . . . . . . . . . . . . . . . . 80
3.4.3 Example 3: Outlier . . . . . . . . . . . . . . . . . . . 84
3.4.4 Example 4: Liquid Level Estimation Experiment . . . 87
3.5 Conclusion . . . . . . . . . . . . . . . . . . . . . . . . . . . . 95
4 MPC Closed-Loop Control with ARMAX and Kalman
Filter 97
4.1 Introduction . . . . . . . . . . . . . . . . . . . . . . . . . . . 97
4.2 MPC Examples . . . . . . . . . . . . . . . . . . . . . . . . . 98
4.2.1 Outlier . . . . . . . . . . . . . . . . . . . . . . . . . . 100
4.2.2 Variance . . . . . . . . . . . . . . . . . . . . . . . . . 104
4.3 Conclusion . . . . . . . . . . . . . . . . . . . . . . . . . . . . 107
5 Computational Load Comparison of Multiplexed MPC
and Standard MPC 108
5.1 Introduction . . . . . . . . . . . . . . . . . . . . . . . . . . . 109
5.2 The Experimental Setup . . . . . . . . . . . . . . . . . . . . 111
5.3 Controller Design . . . . . . . . . . . . . . . . . . . . . . . . 114
5.4 Experimental Results . . . . . . . . . . . . . . . . . . . . . . 116
5.5 Conclusion . . . . . . . . . . . . . . . . . . . . . . . . . . . . 122
6 Conclusion and Future Works 124
Bibliography 129
A Derivation of Equation (3.14) 141
iii
List of Figures
1.1 Receding-horizon control implementation of Model Predictive
Control. . . . . . . . . . . . . . . . . . . . . . . . . . . . . . . . 2
1.2 Model Predictive Control structure. . . . . . . . . . . . . . . . . 3
1.3 The maximum likelihood criterion was used to fit a Gaussian
distribution (dotted-line, µ = 0, σ = 28.5nm) and GT distri-
bution (solid-line, p = q = 2, σ = 29.5nm) to the thickness
measurement distribution. . . . . . . . . . . . . . . . . . . . . . 6
1.4 Thickness measurements on 24 semiconductor wafers after Chem-
ical Mechanical Polishing. . . . . . . . . . . . . . . . . . . . . . 6
2.1 SMPC Temp erature response of 3-zone bake-plate with room
temperature wafer placed on. . . . . . . . . . . . . . . . . . . . 15
2.2 UMPC Temperature response of 3-zone bake-plate with room
temperature wafer placed on. . . . . . . . . . . . . . . . . . . . 16
2.3 A photograph of the multizone bake plate. . . . . . . . . . . . . 26
2.4 UMPC Uniformity ISE trend with q
1
= 1. . . . . . . . . . . . . 35
2.5 Output and Control singals of SMPC (left) with q
1
= q
2
= q
3
=
1 and UMPC (right) with q
1
= 1, q
2
= 3, q
3
= 3. . . . . . . . . . 36
2.6 Zone 1 block diagram of bake-plate. . . . . . . . . . . . . . . . . 39
2.7 Output performance and input Signals of UMPC with q
1
= 1:
upper from left to right are with q
2
= q
3
= 1, q
2
= q
3
= 5
respectively; lower from left to right are with q
2
= q
3
= 10,
q
2
= q
3
= 20 respectively. . . . . . . . . . . . . . . . . . . . . . . 42
2.8 Output performance and input Signals of SMPC (left) with q
1
=
q
2
= q
3
= 1 and UMPC (right) with q
1
= 1, q
2
= 20, q
3
= 20. . . 44
2.9 Output performance and input Signals when the gain of the
identified plant model is artificially increased by 2 times: SMPC
with q
1
= q
2
= q
3
= 1 (left), and UMPC with q
1
= 1, q
2
= 20,
q
3
= 20(right). . . . . . . . . . . . . . . . . . . . . . . . . . . . . 45
2.10 Output performance and input Signals when the gain of the
identified plant model is artificially increased by 5 times: SMPC
with q
1
= q
2
= q
3
= 1 (left), and UMPC with q
1
= 1, q
2
= 20,
q
3
= 20(right). . . . . . . . . . . . . . . . . . . . . . . . . . . . . 46
iv
2.11 Output performance and input Signals when the gain of the
identified plant model is artificially decreased by 2 times: SMPC
with q
1
= q
2
= q
3
= 1 (left), and UMPC with q
1
= 1, q
2
= 20,
q
3
= 20(right). . . . . . . . . . . . . . . . . . . . . . . . . . . . . 47
2.12 Output performance and input Signals when the gain of the
identified plant model is artificially decreased by 5 times: SMPC
with q
1
= q
2
= q
3
= 1 (left), and UMPC with q
1
= 1, q
2
= 20,
q
3
= 20(right). . . . . . . . . . . . . . . . . . . . . . . . . . . . . 48
2.13 Output performance and input Signals when the time constant
of the identified plant model is artificially increased by 2 times:
SMPC with q
1
= q
2
= q
3
= 1 (left), and UMPC with q
1
= 1,
q
2
= 20, q
3
= 20(right). . . . . . . . . . . . . . . . . . . . . . . . 50
2.14 Output performance and input Signals when the time constant
of the identified plant model is artificially increased by 5 times:
SMPC with q
1
= q
2
= q
3
= 1 (left), and UMPC with q
1
= 1,
q
2
= 20, q
3
= 20(right). . . . . . . . . . . . . . . . . . . . . . . . 51
2.15 Output performance and input Signals when the time constant
of the identified plant model is artificially decreased by 2 times:
SMPC with q
1
= q
2
= q
3
= 1 (left), and UMPC with q
1
= 1,
q
2
= 20, q
3
= 20(right). . . . . . . . . . . . . . . . . . . . . . . . 52
2.16 Output performance and input Signals when the time constant
of the identified plant model is artificially decreased by 5 times:
SMPC with q
1
= q
2
= q
3
= 1 (left), and UMPC with q
1
= 1,
q
2
= 20, q
3
= 20(right). . . . . . . . . . . . . . . . . . . . . . . . 53
2.17 Comparison of Uniformity ISE of UMPC(left) and SMPC(right)
when modeling error is presence. . . . . . . . . . . . . . . . . . 54
3.1 Different choices of the GT distribution shape parameters p and
q can give different well-known distributions. . . . . . . . . . . . 61
3.2 Simulation results of Example 2. . . . . . . . . . . . . . . . . . 81
3.3 ARMAX filter output ˆy(N). . . . . . . . . . . . . . . . . . . . . 85
3.4 Kalman filter output ˆy(N). . . . . . . . . . . . . . . . . . . . . 85
3.5 Photo of the coupled-tank. . . . . . . . . . . . . . . . . . . . . . 87
3.6 Measurement y(N) for the liquid level estimation experiment. . 88
3.7 The maximum likelihood criterion was used to fit a GT distribu-
tion (solid-line) and Gaussian distribution (dashed-line) to the
noise distribution. . . . . . . . . . . . . . . . . . . . . . . . . . . 89
3.8 ARMAX filter estimate ˆy(N). . . . . . . . . . . . . . . . . . . . 91
3.9 Kalman filter estimate ˆy(N). . . . . . . . . . . . . . . . . . . . . 91
3.10 Outlier analysis. (x) measurement; (—)ARMAX filter estimate;
(- - -) Kalman filter estimate. . . . . . . . . . . . . . . . . . . . 95
4.1 Block diagram of the closed-loop system. . . . . . . . . . . . . . 98
v
4.2 Silumation results of MPC Outlier Example. . . . . . . . . . . . 101
4.3 Simulation results of MPC Variance Example. . . . . . . . . . . 106
5.1 Patterns of input moves for Standard MPC (solid), and for the
Multiplexed MPC (dashed). . . . . . . . . . . . . . . . . . . . . 109
5.2 Zone 1 Disturbance impulse response of experiment and esti-
mated model respectively. . . . . . . . . . . . . . . . . . . . . . 113
5.3 Plot of MMPC and SMPC maximum computational time v.s.
control horizon by experiment. . . . . . . . . . . . . . . . . . . . 117
5.4 Comparison of the computational time of MMPC (dashed) and
SMPC (solid) with similar performance, N
u
= 5. . . . . . . . . . 118
5.5 Comparison of the computational time of MMPC (dashed) and
SMPC (solid) with similar performance, N
u
= 20. . . . . . . . . 119
5.6 Comparison of the computational time of MMPC (dashed) and
SMPC (solid) with similar performance, N
u
= 25. . . . . . . . . 120
vi
List of Tables
2.1 Tuning results: ISE of uniformity (sum of ||y
1
−y
2
||
2
and etc.),
q
1
= 1 . . . . . . . . . . . . . . . . . . . . . . . . . . . . . . . . 34
2.2 ISE of uniformity (sum of ||y
1
− y
2
||
2
and etc.) when modeling
error is presence . . . . . . . . . . . . . . . . . . . . . . . . . . . 56
3.1 Parameters of the ARMAX process and ARMAX filter in the
Examples . . . . . . . . . . . . . . . . . . . . . . . . . . . . . . 70
3.2 Mean and Variance of ˆy(N) in Figure 3.2 . . . . . . . . . . . . . 81
3.3 Variance (×10
−3
) of ˆy(N) in Figures 3.8 and 3.9. . . . . . . . . 90
4.1 Parameters for ARMAX models and ARMAX filters in Exam-
ples 4.2.1 and 4.2.2 . . . . . . . . . . . . . . . . . . . . . . . . . 99
4.2 Mean and Variance of the simulation output in Figure 4.2 . . . 102
4.3 Mean and Variance of the simulation output in Figure 4.3 . . . 105
vii
Abstract
Model Predictive Control (MPC) has been widely studied and adopted in
industrial applications because the actual control objectives and operating
constraints can be represented explicitly in the optimization problem that
is solved at each control instant [1–3]. Some attempts have been done for
temperature uniformity control [4–6]. But these studies on temperature
uniformity usually focused on the set-point tracking uniformity from batch
to batch, not the uniformity of the zone-to-zone temperature trajectories.
In this thesis, we proposed a method called Uniformity Model Predictive
Control (UMPC) to achieve output uniformity. The idea of UMPC is to
reconstruct the cost function of the Standard MPC. Simulations and bake-
plate experiments were carried out to show that UMPC gives better out-
puts uniformity than SMPC. Moreover, most of MPC control designs use
Kalman filter to filter the measurement noise which is assumed to be Gaus-
sian distributed. This might be a limitation in the case of non-Gaussian
noise as Kalman filter is well-known to be sensitive to outliers [7]. We pro-
posed a filter called ARMAX filter for MPC by modeling noise with the
GT distribution, as it can model other distributions (e.g. t-distribution),
instead of the usual Gaussian distribution. Moreover, the computational
load is also a problem when applying the MPC designs to the industrial
viii
applications. We provide one of the first experimental verification of the
computational load reduction property of MMPC.
ix
Chapter 1
Introduction
1.1 An Overview of Model Predictive
Control
The general design objective of Model Predictive Control (MPC) is to com-
pute a trajectory of a future manipulated input u to optimize the future
behavior of the plant output y. Figure 1.1 shows the receding-horizon con-
trol implementation of MPC. The control horizon represents the number
of parameters used to capture the future control trajectory. The predictive
horizon represents the number of samples we want to predict. Although the
optimal trajectory of future control signal is completely described within
the length of control horizon, the actual control input to the plant only
takes the first sample of the control signal, while neglecting the rest of the
1
trajectory.
Figure 1.1: Receding-horizon control implementation of Model Predictive
Control.
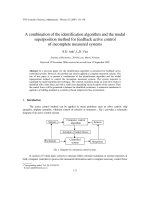
Figure 1.2 shows the structure of MPC. At each time instant, MPC uses
a current measurement of the process output, and an internal model of the
process, to compute and implement a new control input, which minimises
some cost function, while guaranteeing that constraints are satisfied. In de-
termining the MPC control, one needs a process model to predict the future
plant outputs, and an optimization criterion which is the cost function.
MPC could well handle the highly complex, non-linear, uncertain, and
constrained dynamics. The multi-variable cases can be easily dealt with by
MPC. The resulting controller is an easy-to-implement control law. With
2
Figure 1.2: Model Predictive Control structure.
these advantages MPC has, therefore, been widely applied in practical in-
dustries. However, MPC also has disadvantages. The derivation of the
control law is more complex than that of classical PID controllers. The
amount of computation required is high when constraints are considered.
And an appropriate model of the process needs to be available to implement
MPC controller.
1.2 Motivation of the Thesis
Model Predictive Control (MPC) has been well studied in the literature
[8–10]. MPC designs have the ability to yield high performance control sys-
tems that is capable of operating without expert intervention for long peri-
ods of time. Hence, the MPC concept has been widely studied by academia
[2, 11] and adopted in a wide range of practical applications [12–15], such
as ships [16], aerospace [17], road vehicles [18], Unmanned helicopter [19],
and building cooling systems [20]. However, MPC for multi-zone tracking
3
is not fully studied. Some attempts have been done for temperature uni-
formity control [4–6]. But these studies on temperature uniformity usually
focused on the set-point tracking uniformity from batch to batch, not the
uniformity of the zone-to-zone temperature trajectories. Moreover, most
of MPC control designs use Kalman filter to filter the measurement noise
which is assumed to be Gaussian distributed. This might be a limitation
in the case of non-Gaussian noise as Kalman filter is well-known to be
sensitive to outliers [7].
For the convenience of differentiating the conventional MPC among oth-
er newly developed MPCs, the conventional MPC is referred to as the Stan-
dard MPC (SMPC) in this thesis. The objective of SMPC is to obtain the
optimal performance so that the output follow the pre-set reference [21].
The general aim of SMPC cost function is that the future output with-
in the considered horizons should follow a pre-determined reference signal
and, at the same time, the control effort necessary for doing so should
be penalized [11]. However, in some practical applications, e.g. semicon-
ductor manufacturing baking processes, the uniformity of the outputs is
crucial [22–24]. Disturbances added onto each output need not necessarily
to be the same. The model of each output is different. The trajectory of
how each output reaches the reference could be very different compared to
each other [25]. Even when the references for each output are the same, the
good outputs uniformity may not be obtained. SMPC does not explicitly
4
guarantee the output uniformity. Hence, an innovative MPC should be
developed to handle the uniformity cases.
The accuracy of the measurement is important when implementing the
MPC system. However, in practical system the measurement is usually con-
taminated by the noise. Hence, a good filter is necessary to enhance the ac-
curacy of output measurement. A commonly made assumption of Gaussian
noise is an approximation to reality. The occurrence of outliers, transient
data in steady-state measurements, instrument failure, human error, pro-
cess nonlinearity, etc. can all induce non-Gaussian process data [7]. Indeed
whenever the central limit theorem is invoked — the central limit theorem
being a limit theorem can at most suggest approximate normality for real
data [26]. However, even high-quality process data may not fit the Gaus-
sian distribution and the presence of a single outlier can spoil the statistical
analysis completely. Take the example of the chemical-mechanical polish-
ing of semiconductor wafers [27–29]. The histogram of the distribution
of 576 thickness measurements (see Figure 1.3) after chemical-mechanical
polishing of twenty-four 200mm semiconductor wafers and after subtract-
ing the mean are plotted in Figure 1.4. Using the maximum likelihood
criterion, a Gaussian distribution was fitted to the histogram. It is evident
in Figure 1.3 that the Gaussian curve does not give a good fit. Hence, a
capable observer is required to reduce the effect of the non-Gaussian noise.
The computational load is also a problem when applying MPC to real-
5
−150 −100 −50 0 50 100 150
0
0.005
0.01
0.015
0.02
0.025
ε (nm)
Probability density
Gaussian curve
GT curve
Figure 1.3: The maximum likelihood criterion was used to fit a Gaussian
distribution (dotted-line, µ = 0, σ = 28.5nm) and GT distribution (solid-
line, p = q = 2, σ = 29.5nm) to the thickness measurement distribution.
0 100 200 300 400 500
200
250
300
350
400
450
500
k
y(k)
Figure 1.4: Thickness measurements on 24 semiconductor wafers after
Chemical Mechanical Polishing.
time applications [30–33]. The operating principle of MPC is to solve a
finite-time constrained optimization problem on-line, in real-time, in order
to decide how to update the control inputs at the next update instant.
6
This results in demanding on-line computational load and can be a limiting
factor when applying MPC to complex systems with fast dynamics or to
embedded applications where computational resources are limited [34]. As
a strategy to reduce computational complexity of MPC, Multiplexed Model
Predictive Control (MMPC) has been proposed [35]. Results for MMPC
have also been established [36]. A robust version of MMPC which ensure
satisfaction of hard constraints in the presence of unknown but bounded
disturbances is also available [37]. However, the computational advantage
of MMPC has only been proven by MATLAB simulation. This thesis
provides the first experimental verification.
1.3 Contribution of the Thesis
In this thesis, first we proposed a method called Uniformity Model Pre-
dictive Control (UMPC) as a strategy to ensure good output uniformity.
The algorithm of UMPC could be implemented by using the already exist-
ing MPC software. Simulations and experiments were carried out to show
that UMPC gives better output uniformity than SMPC. SMPC solves the
optimization problem with the cost function which minimizes the errors
between the outputs and the references. With SMPC method applied, the
performances of each outputs could reach the reference, but the trajectories
could be very different. SMPC method could not ensure good uniformity
7
of the outputs. However, UMPC solves the optimization problem with a
different cost function. The cost function of UMPC minimizes one error
between one output and its reference, and errors between this output and
the other outputs. In order to have good output uniformity, only one out-
put follows the setpoint, while this output becomes the references of the
other outputs.
Work on applications of MPC as a feedback controller for bake-plate
temperature control can be found in [38], and feed-forward control was
reported in [39]. In addition, a Linear Quadratic Gaussian (LQG) con-
troller has been applied to a state-of-the-art 49-zone bake-plate [40]. LQG
and SMPC are optimal control strategies. In this thesis, we derived the
algorithm of UMPC. The detailed derivation will be discussed in chapter
2. Bake-plate experiments were conducted. We compared the load distur-
bance performance of UMPC and SMPC. The experimental results show
that when the set-points are the same, UMPC has better output unifor-
mity compared to SMPC. We also show that when the plant modelling
error exists, the UMPC maintains the uniformity performance whereas the
SMPC does not.
We then proposed a filter called ARMAX filter for MPC by modelling
noise with the GT distribution instead of the usual Gaussian distribution.
The Generalized t (GT), by being a distribution superset encompassing
Gaussian, uniform, t and double exponential distributions, has the flexi-
8
bility to characterize data with non-Gaussian statistical properties [41–43].
It is evident in Figure 1.3 that the GT distribution fit the experimental
data better than the Gaussian curve. In this work, we use the Influence
Function (IF) to analyse the state estimation problem with GT noise. The
analysis is further generalized to the case where the estimator designed with
probability density function f(ε) is applied to noise with different proba-
bility density function g
k
(ε) at different sampling instance, k, to provide
a framework for the analysis of outliers. Influence Function (IF) is also
used to formulate a recursive algorithm that gives an approximate solution
making it suitable for real-time and on-line implementation. Specifically
the problem is formulated as the filtering of the ARMAX process with GT
noise. We also show how the IF can be used to analyse the filter, specifi-
cally how it can predict the filter output due to outliers and the variance
of the output. To put things in perspective, it will be shown through an
example that if the noise is Gaussian then the proposed ARMAX filter is
equivalent to the Kalman filter [44]. Otherwise the ARMAX filter has the
extra degrees of freedom to model the noise.
In Chapter 5, we provided one of the first exp erimental verification of
the computational load reduction property of MMPC. SMPC updates al-
l the control signals simultaneously. However, MMPC only updates one
control signal at a time (see Fig. 5.1). The main idea of MMPC is to
partition the entire system into smaller subsystems, solve each subsystem
9
sequentially, and update subsystem controls as soon as the solution be-
comes available [45]. This is in contrast to SMPC, which solves the entire
optimisation problem in one go. An estimate of the computational com-
plexity of SMPC (or quadratic programming) is O((m × N
u
)
3
), where m
is the numb er of control inputs and N
u
the control horizon, i.e., the com-
putational complexity increases as a cubic function of the total number of
decision variables (m × N
u
). In MMPC, only one control is updated at a
time and the process is repeated sequentially, the computational complexi-
ty of MMPC is roughly m ×O(N
3
u
). In other words, for each control move,
MMPC solves a smaller optimisation problem, and resulting in reduced
computational complexity and hence computational load. Simulation work
has been done to show the MMPC computational advantage [33]. However,
in the real practical application, real measurement includes the necessary
overhead. Hence, exp eriments need to be conducted to consolidate the
theory.
1.4 Scope of the Thesis
This thesis is organised as follows. In chapter 2, we propose the algorithm
of UMPC which can deal with the output tracking problem. Simulation-
s and experiments on wafer bake-plate are demonstrated to illustrate the
proposed UMPC theory. To handle non-Gaussian noise, we derive the AR-
10
MAX filter in chapter 3. The derived ARMAX filter can be used as an
effective observer as well. In chapter 4, simulations of the closed-loop M-
PC control system with ARMAX filter as an observer are given to show
the advantage of the ARMAX filter when the output measurement is con-
taminated by non-Gaussian noise. In chapter 5, practical experiments are
conducted on wafer bake-plate to support the computational load advan-
tage of MMPC compared to SMPC. The conclusion chapter summarises
the work of this thesis.
11
Chapter 2
Model Predictive Control for
Uniform Output
For applications where uniformity among the outputs are critical, this chap-
ter demonstrates that UMPC formulation is a possible candidate. In this
chapter, we compare the load disturbance performance of UMPC and SM-
PC. We show that when the plant modeling error exists, the UMPC main-
tains the uniformity performance whereas the SMPC does not. We formu-
late the UMPC such that the weighting parameter tuning is related to the
uniformity performance whereas the SMPC does not have this property.
12
2.1 Introduction
In manufacturing, maintaining product uniformity is important. For ex-
ample, in semiconductor manufacturing, current photoresist processes in
advanced lithography system are especially sensitive to temperature. The
key output in photolithography is the linewidth of the photoresist pattern
or critical dimension (CD) and the CD is significantly impacted by several
variables that must also be monitored to ensure quality [46, 47]. Thermal
processing of semiconductor substrate is common and critical in the pho-
tolithography sequence. Temperature uniformity control is an important
issue with stringent specifications and has a significant impact on the CD
[38, 48, 49]. The most temperature sensitive step in the photolithography
sequence is the post-exposure bake step. As the photolithography industry
moves to bigger substrate and smaller CD, the stringent requirements for
post-exposure bake processing still persist [50, 51]. Beyond year 2013, the
post-exposure bake resist sensitivity is expected to be less than 1 nm/
◦
C,
making temperature control even more critical [52]. A number of recent
investigations also showed the importance of proper bake-plate operation
on CD control [53–55]
Thermal processing of semiconductor wafers is commonly performed by
placement of the wafer on a heated plate for a given period of time. The
heated plate is of large thermal mass relative to the wafer and is held at
13