Metal assisted chemically etched silicon nanowire systems for biochemical and energy storage applicationvs
Bạn đang xem bản rút gọn của tài liệu. Xem và tải ngay bản đầy đủ của tài liệu tại đây (9.03 MB, 215 trang )
!
1
THE DEVELOPMENT AND COMPARISON OF THE NOVEL
FORWARD OSMOSIS MEMBRANE BIOREACTOR IN THE
AEROBIC AND ANAEROBIC CONFIGURATION
TANG KAI YIN, MELVIN
B.Eng. (Hons.), NUS
A THESIS SUBMITTED!FOR THE DEGREE OF PhD OF
ENGINEERING
DEPARTMENT OF CIVIL AND ENVIRONMENTAL
ENGINEERING
NATIONAL UNIVERSITY OF SINGAPORE
2014
!
2
DECLARATION
I hereby declare that the thesis is my original work and it has been written by me in its
entirety. I have duly acknowledged all the sources of information that have been used
in the thesis.
This thesis has also not been submitted for any degree in any university previously.
_________________
Tang Kai Yin, Melvin
August 2014
!
3
ACKNOWLEDGEMENTS
First and foremost, I would like to offer my deepest gratitude to my scholarship board
- Environment and Water Industry Council (under Public Utilities Board) whom is
administering the funds from the National Research Foundation of Singapore. The
financial support and opportunities that I had the privilege to enjoy has helped me
greatly to attain a holistic Ph.D. experience and advance my future career.
I also wish to express my sincerest appreciation and gratitude to my Ph.D. advisor,
Associate Professor Ng How Yong, as his invaluable insights, advices and
encouragements have been instrumental in helping me prevail against the challenges
of my doctoral thesis.
Furthermore, I would like to extend my heartfelt appreciation to all the faculty
members, research staffs and students in the department, especially, Professor Ong
Say Leong, Associate Professor Hu Jiang Yong, Associate Professor He Jian Zhong,
Dr. George Zhou Zhi, Dr. Lee Lai Yoke, Dr. Albert Ng Tze Chiang, Dr. James Tan
Chien Hsiang, Dr. Koh Lee Chew, Dr. Low Siok Ling, Dr. Ng Kok Kwang, Dr.
Venketeswari Parida, Mr. Zhang Jun You, Ms. Yi Xinzhu, Mr. Shailesh Kharkwal,
Mr. Pooi Ching Kwek and Mr. Lim Chong Tee, for their treasured advices and kind
assistances along the journey. Additionally, I am deeply appreciative of the aid and
cooperation from the following students, Ms. Emily Seow, Ms. Zou Qing Yuan and
Ms. Dong Danping (FYP students), Ms. Guo Si, Ms. Vivian Leow and Mr. Vincent
Loka (UROP students). I also would like to accord special thanks to all the laboratory
officers in the Water Science and Technology Laboratory, namely, Mr. S.G.
Chandrasegaram, Ms. Tan Xiaolan and Ms. Lee Leng Leng, for their technical
!
4
assistance and outstanding expertise in laboratory work and safety knowledge.
Above all, I would like to thank all my friends and family members, especially my
parents and my wife, Daphne, for bestowing upon me the privilege to work hard
without worries about domestic commitments, and sharing my sorrows and joys along
the journey.
!
5
TABLE OF CONTENTS
DECLARATION 2
ACKNOWLEDGEMENTS 3
TABLE OF CONTENTS 5
AWARDS AND PUBLICATIONS 7
AWARDS 7
JOURNAL PUBLICATIONS 7
BOOK CHAPTERS 8
CONFERENCE ORAL PRESENTATION PROCEEDINGS 8
SUMMARY 9
ABBREVIATIONS 14
LIST OF TABLES 16
LIST OF FIGURES 18
CHAPTER ONE- INTRODUCTION 22
1.1.1 BACKGROUND 22
1.1.1 FORWARD OSMOSIS (FO) AND FORWARD OSMOSIS MEMBRANE BIOREACTOR
(FOMBR) 23
1.2 PROBLEM STATEMENT 25
1.2.1 LACK OF UNDERSTANDING ON THE IMPACTS OF HRT AND SRT ON FOMBR 26
1.2.2 LACK OF UNDERSTANDING OF FOMBR FOULING PHENOMENON 27
1.2.3 LACK OF UNDERSTANDING OF FOMBR FROM MICROBIOLOGICAL PERSPECTIVES 28
1.3 RESEARCH OBJECTIVES 28
1.4 ORGANIZATION OF THESIS 32
CHAPTER TWO- LITERATURE REVIEW 34
2.1 BASIC PRINCIPLES OF FO 34
2.2 FO MEMBRANES 37
2.3 CONCENTRATION POLARIZATION PHENOMENON IN FO PROCESSES 39
2.3.1 EXTERNAL CONCENTRATION POLARIZATION (ECP) 42
2.3.2 INTERNAL CONCENTRATION POLARIZATION (ICP) 43
2.3.3 CP PHENOMENON 43
2.4 APPLICATION OF THE FO TECHNOLOGY FOR WASTEWATER TREATMENT 44
2.4.1 ACTIVATED SLUDGE PROCESS AND MEMBRANE BIOREACTORS 44
2.4.2 MBRS AND FOMBRS 45
2.4.3 AEROBIC FOMBRS AND ANAEROBIC FOMBRS 46
2.5 FOMBR CONFIGURATIONS 50
2.5.1 SIDE-STREAM VERSUS SUBMERGED CONFIGURATIONS 50
2.5.2 INSIDE/OUTSIDE MBR CONFIGURATION 51
2.5.3 TWO-STAGE ANAEROBIC SYSTEMS 52
2.6 FOMBR OPERATIONAL CHALLENGES 54
2.6.1 INFLUENCE OF HRT AND SRT ON FOMBRS 54
2.6.2 INFLUENCE OF SALINITY LEVELS 57
2.6.3 FOULING IN FOMBRS AND ANFOMBRS 62
!
6
CHAPTER THREE- MATERIALS AND METHODS 70
3.1 FOMBR AND ANFOMBR SETUP AND OPERATIONAL CONDITIONS 70
3.2 REACTOR PERFORMANCE ANALYSIS METHODS 81
3.2.1 SAMPLE COLLECTION AND PREPARATION 81
3.2.2 TREATMENT PERFORMANCE ANALYSIS AND SLUDGE CHARACTERIZATION 81
3.2.3 MEMBRANE FOULING ANALYSIS 85
3.2.4 FLUORESCENT IN-SITU HYBRIDIZATION (FISH) TECHNOLOGY 89
CHAPTER FOUR- RESULTS AND DISCUSSION 93
4.1 RESULTS AND DISCUSSION – IMPACTS OF DRAW SOLUTION SELECTION 95
4.1.1 IMPACTS OF NA
2
SO
4
AS DRAW SOLUTE (AEROBIC VS. ANAEROBIC FOMBR) 95
4.1.2 IMPACTS OF NACL AS DRAW SOLUTE (AEROBIC VS. ANAEROBIC FOMBR) 106
4.1.3 EVALUATION OF THE BEST PERFORMING SALT-RESPIRATION COMBINATION 120
4.2 RESULTS AND DISCUSSION – IMPACTS OF THE HRT PARAMETER 125
4.2.1 FLUX PERFORMANCE AND INEFFECTIVENESS OF HRT AS A CONTROL 125
4.2.2 TREATMENT PERFORMANCE 129
4.2.3 BIOGAS PRODUCTION AND SRB DOMINANCE 132
4.2.4 MEMBRANE FOULING 136
4.2.5 MICROSCOPY DATA 139
4.3 RESULTS AND DISCUSSION – IMPACTS OF THE SRT PARAMETER 141
4.3.1 FLUX PERFORMANCE 141
4.3.2 TREATMENT PERFORMANCE 144
4.3.3 NITRIFICATION AND MICROBIAL COMMUNITY ANALYSIS 147
4.3.4 MEMBRANE FOULING 155
4.3.5 MICROSCOPE DATA 159
4.4 RESULTS AND DISCUSSION – DEVELOPMENT AND TROUBLESHOOTING OF ANFOMBR
162
4.4.1 DETRIMENTAL EFFECTS OF SULPHATES AS DRAW SOLUTES FOR ANFOMBRS 162
4.4.2 SALINITY CONTROL AND INEFFECTIVENESS OF TFC MEMBRANES 171
4.5 RESULTS AND DISCUSSION – NOVEL APPLICATION OF FOMBR: DEVELOPMENT OF
MICROBIAL FORWARD OSMOSIS CELL 185
4.5.1 EXPLORATORY MFOC PERFORMANCE EVALUATION 186
4.6 RESULTS AND DISCUSSION – DEVELOPMENT OF A NOVEL, AUTOMATED FO
RECONCENTRATION SYSTEM 191
CHAPTER FIVE- CONCLUSIONS AND RECOMMENDATIONS 199
5.1 CONCLUSIONS 199
5.1.1 GENERAL IMPACTS OF NACL AND NA
2
SO
4
AS DRAW SOLUTION 199
5.1.2 IMPACTS OF HRT PARAMETER ON FOMBR 200
5.1.3 IMPACTS OF SRT PARAMETER ON FOMBR 201
5.1.4 LACK OF DECOUPLING BETWEEN HRT AND SRT FOR FOMBRS 202
5.1.5 CHALLENGES IN DEVELOPING THE ANFOMBR 203
5.1.6 EXCITING APPLICATIONS OF FO TECHNOLOGY 205
5.2 RECOMMENDATIONS 207
5.2.1 NEED FOR A NON-BIODEGRADABLE FO MEMBRANE 207
5.2.2 AVOIDANCE OF SULPHATE-BASED DRAW SOLUTES FOR ANFOMBRS 207
5.2.3 NEED TO CONTROL FEED SALINITIES FOR MFOC SYSTEM 207
CHAPTER SIX- REFERENCES 209
!
7
AWARDS AND PUBLICATIONS
AWARDS
1. Rising HydroPreneuer Star Award (Public Utilities Board’s HydroPreneur
Programme, June 2014)
2. Winner of Ceraflo’s Humanitarian Water Filtration Design Challenge (May
2014)
3. Winner of 4th IWA Young Water Professional Workshop Future City
Planning Competition (International Water Association, September 2013)
4. Outstanding Oral Presentation Award (21st KKNN Symposium on
Environmental Engineering, July 2012)
5. National Research Foundation (Environment and Water Technologies) Ph.D.
Scholarship (June 2010)
JOURNAL PUBLICATIONS
1. Ng, K.K., Shi, X., Tang, M.K.Y., Ng, H.Y., 2014. A novel application of
anaerobic bio-entrapped membrane reactor for the treatment of chemical
synthesis-based pharmaceutical wastewater. Separation and Purification
Technology, doi: http//dx.doi.org/10.1016/j.seppur.2014.06.021
2. MKY Tang and HY Ng (2014), Impacts of different draw solutions on a
novel anaerobic forward osmosis membrane bioreactor (AnFOMBR), Water
Science and Technology 69(10), 2036-2042.
!
8
BOOK CHAPTERS
3. Membrane Biological Reactors: Theory, Modeling, Design, Management and
Applications to Wastewater Reuse, Chapter 12: Hybrid processes, new
generation membranes and MBR designs (O Lefebvre, KK Ng, KY Tang and
HY Ng, IWA Publishing 2014).
CONFERENCE ORAL PRESENTATION PROCEEDINGS
4. Melvin Tang, HY Ng, “Impacts of different membrane materials on the novel
anaerobic forward osmosis membrane bioreactor, Conference on The
AWWA/AMTA 2014 Membrane Technology Conference & Expo, March 10-
14, 2014, Las Vegas, Nevada.
5. Melvin Tang, HY Ng, “Impacts of different draw solutions on a novel
anaerobic forward osmosis membrane bioreactor”, Conference on The 5th
IWA-ASPIRE Conference & Exhibition, September 8-12, 2013, Daejeon,
Korea.
6. Melvin Tang, HY Ng, “Feasibility of a novel anaerobic forward osmosis
membrane bioreactor based on the hybrid FO-NF configuration”, Conference
on The 4th IWA Asia-Pacific Young Water Professionals Conference,
December 7-10, 2012, Tokyo, Japan.
7. Melvin Tang, HY Ng, “Application of novel bench scale reconcentration
system on a novel anaerobic forward osmosis membrane bioreactor (AnFO-
MBR)”, Conference on The 21st KKNN Symposium on Environmental
Engineering, July 13-14, 2012, Kuala Lumpur, Malaysia.
!
9
SUMMARY
The forward osmosis membrane bioreactor (FOMBR) is a wastewater treatment
system integrating forward osmosis (FO) within a biological process and was a
novelty introduced back in 2009 (Achilli et al., 2009). However, since the successful
conceptualization and realization of the FOMBR, several unknowns remained and
inadequacies surfaced. The impacts of hydraulic and solids retention times (HRT and
SRT) on the treatment performance, microbiological communities and membrane
fouling remain undetermined. Furthermore, while the utilization of osmotic pressures
for water extraction does lead to lower fouling potentials and energy consumption, the
assertion becomes doubtful when evaluated holistically as drinking water can only be
obtained when the diluted draw solution (DS) goes through a pressurized filtration
recovery stage using reverse osmosis (RO) or nanofiltration (NF). In this light, the
likelihood for FOMBRs to be more energy saving than conventional MBRs is not
optimistic.
With the aforementioned backdrop, it is clear that the FOMBR system is still a very
new concept with plentiful unknowns present currently. Thus, this thesis sets off to
address these knowledge gaps by embarking on an innovative and comprehensive
study on the FOMBR, illuminating the impacts of parameters such as HRT, SRT,
membrane types and microbial respiration pathways on FOMBR feasibility and
performance. Broadly speaking, this investigation is a comparative study between the
aerobic and novel anaerobic configurations of the FOMBR to determine the better
performing system, given the current standards of (membrane) technology. The
studied reactor operating conditions were as summarized in Table 1.
!
10
!
11
Table 1: Tabulated summary of all reactor runs
Phase
Reactor
Type
Metabolism
Draw Solution
Membrane
Feed Type
Feed COD (mg/L)
SRT (d)
HRT (h)
1A
A
FOMBR
Aerobic
Na
2
SO
4
CTA-FO
Synthetic
550
30
8
B
FOMBR
Anaerobic
Na
2
SO
4
CTA-FO
Synthetic
550
30
8
1B
C
FOMBR
Aerobic
NaCl
CTA-FO
Synthetic
550
30
8
D
FOMBR
Anaerobic
NaCl
CTA-FO
Synthetic
550
30
8
2A
E
FOMBR
Anaerobic
Na
2
SO
4
CTA-FO
Synthetic
550
30
10
3
F
FOMBR
Anaerobic
NaCl
TFC-RO
Synthetic
550
30
8
2B
G
FOMBR
Aerobic
Na
2
SO
4
CTA-FO
Synthetic
550
20
8
H
FOMBR
Aerobic
Na
2
SO
4
CTA-FO
Synthetic
550
10
8
4
I
FOMBR
Aerobic
NaCl
CTA-FO
Domestic
225
3
6
J
MFC
Anaerobic
-
Nafion
Domestic
225
Infinite
0.64
K
MFOC
Aerobic
NaCl
CTA-FO
Domestic
225
3
6
!
12
In a bid to allow the use of lower energy-consuming NF (over RO) for DS recovery,
Na
2
SO
4
had been chosen over the commonly used NaCl because of the better ionic
size and charge exclusion that NF allows. Comparative studies based on microbial
respirational pathways (aerobic and anaerobic metabolism) and DS types were studied
between Reactors A and B, and Reactors C and D. Anaerobic reactors were found to
be inferior to aerobic versions in both investigations. In particular, sulphate DS was
detrimental to methane production for it encouraged outcompetition of methanogens
by sulphate reducers. On the other hand, NaCl DS also led to impaired biological
activities due to elevated salinities from aggravated reverse salt transportation for all
runs. As Reactor A had the best performance, it was concluded that the aerobic
arrangement is generally superior for current levels of technology. Consequently, the
aerobic configuration was chosen to further elucidate the impacts of SRT on FOMBR
performance and microbiological aspects (Reactors G and H). On the other hand,
results for Reactor E (in comparison with Reactor B) found that HRT did not have
significant impacts on FOMBR performance and future HRT studies were ignored. In
detail, the non-constant flux and OLR was an intrinsic trait of FO-based systems that
made HRT studies less meaningful as it can never be kept constant. Also, while
anaerobic FOMBRs (AnFOMBRs) were not feasible using the originally planned
conditions, further efforts were made to troubleshoot and improve the biogas
production. Reactor F reflected the endeavor at solving the high salinity, where thin
film composite membranes were utilized to remove the matrix biodegradability issue
from FOMBR operation.
In short, FOMBRs are complex novelties that do not show clear trends as in the case
of conventional MBRs when certain operational parameters like HRT and SRT were
varied systematically. This is because HRTs and SRTs are not decoupled for FO
!
13
processes and the observed phenomenon becomes the result of a ‘tug of war’ between
competing factors during actual operation.
!
14
ABBREVIATIONS
AnFOMBR Anaerobic Forward Osmosis Membrane Bioreactor
AnMBR Anaerobic Membrane Bioreactor
ASP Activated Sludge Process
CASP Conventional Activated Sludge Process
CTA Cellulose Triacetate
DNA Deoxyribonucleic Acid
DO Dissolved Oxygen
DS Draw Solution
EDX Energy-Dispersive X-ray (Spectroscopy)
EPS Extracellular Polymeric Substances
FISH Fluorescent In-Situ Hybridization
FO Forward Osmosis
FOMBR Forward Osmosis Membrane Bioreactor
HRT Hydraulic Retention Time
MBR Membrane Bioreactor
MF Microfiltration
!
15
MFC Microbial Fuel Cell
MLSS Mixed Liquor Suspended Solids
MLVSS Mixed Liquor Volatile Suspended Solids
NF Nanofiltration
OLR Organic Loading Rate
PBS Phosphate Buffer Saline
rRNA Ribosomal Ribonucleic Acid
RNA Ribonucleic Acid
RO Reverse Osmosis
SEM Scanning Electron Microscope
SMP Soluble Microbial Product
SRT Sludge Retention Time
TDS Total Dissolved Solids
TFC Thin Film Composite
TMP Transmembrane Pressure
UF Ultrafiltration
!
16
LIST OF TABLES
CHAPTER ONE- INTRODUCTION
• Table 1.1. Summary of FO applications
CHAPTER THREE- MATERIALS AND METHODS
• Table 3.1. Chemical composition and concentration of the synthetic feed
solution.
• Table 3.2. Tabulated volumes for the various components involved in the mass
balance modeling.
• Table 3.3. Summary of operational conditions for all 11 reactors studied and
reported in the thesis.
• Table 3.4. Standard curve of BSA for protein quantification.
• Table 3.5. Glucose standard curve for carbohydrate quantification.
• Table 3.6. Oligonucleotide sequences and specificities of the FISH probes
used.
CHAPTER FOUR- RESULTS AND DISCUSSIONS
• Table 4.1. Recap of the operational conditions for Reactors A and B.
• Table 4.2. Tabulated performance parameters for Reactors A and B.
• Table 4.3 Tabulated fouling parameters for Reactors A and B.
• Table 4.4. Tabulated data demonstrating the protein and carbohydrate levels
within the SMP and EPS samples extracted from Reactors A and B.
• Table 4.5. Recap of the operational conditions for Reactors C and D.
• Table 4.6. Tabulated performance parameters for Reactors C and D.
• Table 4.7. Tabulated fouling parameters for Reactors C and D.
• Table 4.8. Tabulated data demonstrating the protein and carbohydrate levels
within the SMP and EPS samples extracted from Reactors C and D.
• Table 4.9. Summary of the four FOMBRs that had been discussed and
analyzed in preceding sections of the thesis.
• Table 4.10. Summary of the main operational parameters of the four
FOMBRs.
• Table 4.11. Recap of the operational conditions for Reactors B and E.
• Table 4.12. Tabulated summary of actual HRTs that Reactors A to E were
operating at during steady state.
!
17
• Table 4.13. Biogas composition at steady state.
• Table 4.14. FISH probe sequences, fluorescent labels and conditions used.
• Table 4.15. Tabulated fouling parameters for Reactors B and E.
• Table 4.16 Tabulated data demonstrating the protein and carbohydrate levels
within the SMP and EMPS samples extracted from Reactors B and D.
• Table 4.17. Recap of the operational conditions for Reactors A, G and H.
• Table 4.18. Tabulated performance parameters for Reactors A, G and H.
• Table 4.19. Tabulated NH
4
+
and NO
3
-
concentrations for Reactors A, G and H.
• Table 4.20. Probes and hybridization conditions used for detection of nitrifiers
within the sludge samples.
• Table 4.21. Tabulated fouling parameters for Reactors A, G and H.
• Table 4.22. Tabulated data demonstrating the protein and carbohydrate levels
within the SMP and EPS samples extracted from Reactors A, G and H.
• Table 4.23. Recap of the operational conditions for Reactors B and D.
• Table 4.24. Biogas composition at steady state.
• Table 4.25. FISH probe sequences, fluorescent labels and conditions used.
• Table 4.26. Recap of the operational conditions for Reactors D and F.
• Table 4.27. Biogas composition at steady state.
• Table 4.28. Tabulated fouling parameters for Reactors D and F.
• Table 4.29. Tabulated data demonstrating the protein and carbohydrate levels
within the SMP and EPS samples extracted from Reactors D and F.
• Table 4.30. Recap of the operational conditions for Reactors I, J and K.
• Table 4.31. Mass balance model predicting reconcentration performance and
accuracies.
!
18
LIST OF FIGURES
CHAPTER ONE- INTRODUCTION
• Figure 1.1. Water flow in (a) forward osmosis and (b) reverse osmosis.
• Figure 1.2. Structure of the various research phases.
CHAPTER TWO- LITERATURE REVIEW
• Figure 2.1. Movement of water molecules across the FO membrane via
osmosis.
• Figure 2.2. Illustration of the FO, PRO and RO concepts in terms of water
flow direction and pressure application. (a) FO, (b) PRO and (c) RO.
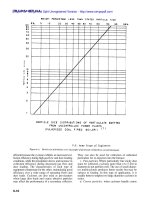
• Figure 2.3. Direction and magnitude of flux as a function of applied pressure.
Figure adapted from Lee et al. (1981) and Cath et al. (2006).
• Figure 2.4. SEM micrograph illustrating the internal structure of the FO
membrane from HTI (McCutcheon, McGinnis et al. 2005).
• Figure 2.5. Categorization of the various types of CP.
• Figure 2.6. Mechanisms of fouling for MBR operating at constant TMP.
• Figure 2.7. Three-stage fouling mechanisms for constant flux MBR
operations.
CHAPTER THREE- MATERIALS AND METHODS
• Figure 3.1. Schematics of the anaerobic FOMBR system (AnFOMBR).
• Figure 3.2. Diagram showing the design of the 6-channel FO membrane
module.
• Figure 3.3. Schematics of a microbial forward osmosis cell (MFOC) setup. (a)
MFC control setup. (b) FOMBR control setup.
• Figure 3.4. Schematic of the novel bench scale automated draw solution
reconcentration system.
!
19
CHAPTER FOUR- RESULTS AND DISCUSSIONS
• Figure 4.1. Plot of permeate flux comparison between Reactor A (aerobic) and
B (anaerobic).
• Figure 4.2. Plot of salinity accumulation for Reactor A (aerobic) and B
(anaerobic).
• Figure 4.3. Digital photo of the fouled membranes at shutdown. (a) Reactor A
(b) Reactor B.
• Figure 4.4. Sludge particle size distribution for Reactors A and B.
• Figure 4.5(a) SEM micrographs and EDX analytical results of the cake layer
attachments on the membrane surfaces of Reactor A.
• Figure 4.5(b) SEM micrographs and EDX analytical results of the cake layer
attachments on the membrane surfaces of Reactor B.
• Figure 4.6. Plot of permeate flux comparison between Reactor C (aerobic) and
D (anaerobic).
• Figure 4.7. Plot of salinity accumulation for Reactor C (aerobic) and D
(anaerobic).
• Figure 4.8. Digital photographs of the interior of the FO membrane module
taken at reactor shutdown. (a) An overall view of the draw side of the
membrane module that was cut open. (b) A close up image of the attached
growth found on the draw side of the membrane.
• Figure 4.9. Different micrograph images of the unknown brown gel-like layer.
(a) SEM micrograph of a piece of the unknown gel layer that was extracted
from Figure 4.8. (b) Crystal violet staining of a vortexed unknown gel layer
sample.
• Figure 4.10. Sludge particle size distribution for Reactors C and D.
• Figure 4.11(a) SEM micrographs and EDX analytical results of the cake layer
attachments on the membrane surfaces of Reactor C.
• Figure 4.11(b) SEM micrographs and EDX analytical results of the cake layer
attachments on the membrane surfaces of Reactor D.
• Figure 4.12. Plot of permeate flux comparison between Reactor B and E.
• Figure 4.13. Plot of salinity accumulation for Reactor B and E.
• Figure 4.14. Various AnFOMBR performance parameters with respect to
operational time, (a) MLVSS values with respect to time, (b) Secondary TOC
removal efficiencies with respect to time, (c) VFA concentrations within the
mixed liquor with respect to time, (d) Ion Chromatography data for the
sulphate ions present in the mixed liquor supernatant of the Reactors B and E.
• Figure 4.15. Results of FISH analysis at a 100x magnification. Top row: FISH
results for Reactor B. Bottom row: FISH results for Reactor E. From left to
right: (a) DAPI staining (b) Cy3-SRB385 probe staining (c) FITC-ARC915
probe staining.
• Figure 4.16. Changes in colloidal particle sizes with respect to time for
Reactor B and E.
• Figure 4.17. Sludge particle size distribution for Reactors B and E.
!
20
• Figure 4.18. SEM Micrographs and EDX analytical results of the cake layer
attachments on the membrane surfaces of Reactor E.
• Figure 4.19. Plot of permeate flux comparison between Reactor A, H and G.
• Figure 4.20. Plot of salinity accumulation for Reactor A, H and G.
• Figure 4.21. SOUR data for Reactors A, G and H.
• Figure 4.22 (a) Results of FISH analysis at a 20x magnification. Top row:
FISH results for Reactor A. Middle row: FISH results for Reactor G. Bottom
row: FISH results for Reactor H From left to right: (i) DAPI staining (ii) Cy3-
SRB385 probe staining (iii) FITC-ARC915 probe staining. White bar
represents 100 μm. Figure 4.22 (b) Tabulated quantitative pixel analysis of the
FISH micrographs in Figure 4.22 (a).
• Figure 4.23. SEM Micrographs and EDX analytical results of the cake layer
attachments on the membrane surfaces. (a) Reactor H, (b) Reactor G and (c)
Reactor A.
• Figure 4.24. Various AnFOMBR performance parameters with respect to
operational time, (a) MLVSS values with respect to time, (b) Secondary TOC
removal efficiency with respect to time, (c) VFA concentration within mixed
liquor with respect to time.
• Figure 4.25. Results of FISH analysis at a 100x magnification. Top row: FISH
results for Reactor B. Bottom row: FISH results for Reactor D. From left to
right: (a) DAPI staining (b) Cy3-SRB385 probe staining (c) FITC-ARC915
probe staining. White bar represents 100 μm.
• Figure 4.26. Digital images of the interior of FO membrane modules that had
been cut open. (a) Reactor B membrane module with unknown white ppt on
the draw side (b) Reactor D membrane module with unknown gel layer on the
draw side.
• Figure 4.27. SEM-EDX analysis on the white precipitate found of the draw
side of the FO membrane from Reactor B.
• Figure 4.28. Various AnFOMBR parameters with respect to operational time,
(a) Flux values with respect to time, (b) Mixed liquor salinity levels with
respect to time.
• Figure 4.29. Digital images of the delaminated TFC-RO membrane module.
(a) Presence of numerous “blemishes” on the membrane surface due to
localized areas of active layer delamination, (b) A “blemish” that was cut
open, demonstrating full delamination of the active layer from the support
fabric. (c) Slimy biofilm layer on the draw side of the TFC-RO membrane.
• Figure 4.30. Plot of various performance parameters with respect time. (a)
MLVSS values with respect to time (b) GC-VFA values within Reactor F
mixed liquor samples.
• Figure 4.31 Results of FISH analysis at a 100x magnification. Top row; FISH
results for Reactor D. Bottom row: FISH results for Reactor F. From left to
right: (a) DAPI staining (b) Cy3-SRB385 probe staining (c) FITC-ARC915
probe staining. White bar represents 100 μm.
• Figure 4.32. Digital images of the interior of the membrane modules that had
been cut open. (a) Reactor D FO membrane with biofilm layer on the draw
side. (b) Delaminated Reactor F TFC-RO membrane with biofilm layer on the
draw side (c) Replacement membrane for Reactor F at the end of a 100 d
operation.
!
21
• Figure 4.33. Sludge particle size distribution for Reactors D and F.
• Figure 4.34. SEM micrographs and EDX analytical results of the cake layer
attachments on the membrane surfaces of Reactor F.
• Figure 4.35. Various comparisons of performance parameters between the
MFOC (Reactor K) with the control reactors- FOMBR control (Reactor I) and
MFC control (Reactor J). (a) Comparison of mixed liquor salinities between
Reactor K and Reactor I (b) Comparison of permeate flux between Reactor K
and Reactor I (c) Comparison of secondary TOC removal efficiencies between
Reactor K and Reactor I (d) Comparison of voltage production between
Reactor K and Reactor J.
• Figure 4.36. SEM micrograph of membrane damage due to biodegradation in
FOMBR control setup.
• Figure 4.37. Tapwater flux performance of an abiotic FOMBR with respect to
time.
• Figure 4.38. Permeate flux performance of an abiotic FOMBR using the novel
bench scale reconcentration system.
!
22
CHAPTER ONE- INTRODUCTION
1.1.1 Background
The future holds for increasing stringency on drinking water qualities as a result of
several water quality forums (WHO, 2011). In view of such trends, membrane
bioreactors (MBRs) are becoming increasingly popular in replacement of
conventional activated sludge processes (CASP), providing for higher effluent
qualities with the use of membranes for retention of undesirable substances. By doing
away the need for secondary sedimentation tanks for solid-liquid separation, MBRs
are compact systems comprising of a biological and a membrane filtration unit,
producing permeates via the application of a vacuum suction force through a
microfiltration (MF) or ultrafiltration (UF) membrane. The mixed liquor suspended
solids (MLSS) are retained and separated from the treated effluent without
dependence on gravitational settling, giving better product water and greater process
control.
An outcome of attempts at tackling water quality issues is the increasing
attractiveness for high retention membrane systems. Membrane systems that possess
high total dissolved solids (TDS) rejection include the forward osmosis (FO),
membrane distillation (MD) and nanofiltration (NF) processes, and this classification
of membrane processes coupled with bioreactors is commonly known as high
retention membrane bioreactors (HRMBRs). HRMBRs are superior over conventional
MBRs for water reclamation because of their effectiveness in retention and
!
23
subsequent biodegradation of low molecular weight contaminants (Lay et al., 2010).
1.1.1 Forward osmosis (FO) and forward osmosis membrane bioreactor
(FOMBR)
On the other hand, closely tied to this issue are the global anxieties of energy and
climate where adverse climate changes threaten the sustainability of life. This
backdrop created an emphasis towards a greener and more sustainable future across
all industries with an ironclad certainty. Also, running parallel to the preference for
HRMBRs is the escalating interest in the application of forward osmosis (FO) for
wastewater treatment (Lay et al., 2011), offering congruence to the present emphasis
on greener alternatives. Interestingly, FO is not a new process and is just simply
osmosis that has been renamed by the industry and academia to help differentiate it
from the currently more popular counterpart - reverse osmosis (RO). FO processes are
long in existence and their extensive applications are summarized in Table 1.1.
Table 1.1. Summary of FO applications
Application
Examples
References
Wastewater Treatment
• FO-MBR
• Centrate concentration
• Industrial wastewater concentration
• Achilli et al. (2009)
• Cornelissen et al. (2008)
• Childress et al. (2005)
• Anderson et al. (1974)
Food Processing
• Concentration of sucrose
• Concentration of fruit juices
• Elimelech et al. (2009)
• Cassano et al. (2004)
• Petrotos et al. (2001)
• Beaudry et al. (1993)
Electricity Generation
• Pressure-retarded Osmosis
• Loeb et al. (1998)
• Loeb et al. (1990)
Desalination
• Desalination using Ammonia-
Carbon Dioxide Forward Osmosis
Process
• Elimelech et al. (2006)
• Elimelech et al. (2005)
Thus, FO is based on the natural phenomenon of diffusion (where particles move
!
24
from a region of higher concentration to a region of lower concentration) that
leverages on the water chemical potential differences between water bodies separated
by a partially permeable membrane. In practice, the water chemical potential
difference (for FO process) is generated from the osmotic pressure differences (Δπ)
that are established across the highly selective FO membrane, between the feed
stream (wastewater, seawater etc) and a draw solution (DS), which is a highly
concentrated salt solution. The DS, having higher osmotic pressures, will draw water
molecules across the membrane from the feed streams. On the contrary and in a self-
explanatory manner, RO operates in a directly opposite manner, involving the
application of a pressure, Δp, on the water body with higher solute concentration,
forcing water to flow across the RO membrane into the water body with higher water
potential, against their natural thermodynamic tendencies. Figure 1.1 below
demonstrates the concept of FO and RO graphically.
(a) FO (b) RO
Figure 1.1. Water flow in (a) forward osmosis and (b) reverse osmosis.
Fundamentally, FO process utilizes osmotic pressure for permeate production instead
of conventional pressurized suction/filtration. Consequently, the absence of hydraulic
pressures as driving forces permitted for decreased energy requirements and reduced
!
25
membrane-fouling propensities (Achilli et al., 2009; Cornelissen et al., 2008;
McGinnis et al., 2007). The forward osmosis membrane bioreactor (FOMBR) is one
such system, integrating FO within a biological process. FOMBR was a novelty
introduced back in 2009 (Achilli et al., 2009) and was a system that has potential to
address the aforementioned global concerns.
FOMBRs utilize FO membranes, which possess very tight pores and are thus
considered as HRMBRs. As mentioned, an attraction of FOMBRs is that the
utilization of osmotic pressures for water extraction leads to lower membrane-fouling
potentials and energy consumption. However, the assertion becomes doubtful when
appraised from a holistic perspective, i.e., while water extraction at the FO membrane
portion requires minimal energy input, drinking water permeate was not directly
obtainable downstream of the FO process (unlike for conventional MBRs) as the
product of the FO process is a diluted DS. Clearly, this is very dissimilar as compared
to the conventional MBRs that produces excellent permeate as the direct product of
the filtration process. To produce drinking water from the diluted DS, a downstream
recovery (or reconcentration) process such as reverse osmosis (RO) or nanofiltration
(NF) is required. Drinking water is collected from the permeate stream while the
reject stream is channeled back into the DS storage tank to reconcentrate the diluted
DS back to the original concentration. Taking the recovery phase into consideration, it
becomes apparent that the energy consumption of such highly pressurized processes
could well offset the savings from the preceding FO segment of the system.
1.2 Problem Statement
With the aforementioned challenges, it is clear that the FOMBR system is still a very
new concept with plentiful of unknowns present currently. Thus, this thesis sets off to