Developing an integrated quantity and quality approach for improving the performance of multistage manufacturing systems
Bạn đang xem bản rút gọn của tài liệu. Xem và tải ngay bản đầy đủ của tài liệu tại đây (1.52 MB, 185 trang )
DEVELOPING AN INTEGRATED QUANTITY AND
QUALITY APPROACH FOR IMPROVING THE
PERFORMANCE OF MULTISTAGE
MANUFACTURING SYSTEMS
CAO YONGXIN
(M. Eng.)
A THESIS SUBMITTED
FOR THE DEGREE OF DOCTOR OF PHILOSOPHY
DEPARTMENT OF MECHANICAL ENGINEERING
NATIONAL UNIVERSITY OF SINGAPORE
2012
Acknowledgments
It is beyond doubt that the work in this thesis cannot be completed without the support,
advice, and encouragement of teachers, colleagues, friends, and family members. In
this acknowledgement, I wish to express my sincere appreciation and thanks to their
support.
First and foremost, I would like to gratefully and sincerely thank my supervisor, Profes-
sor Velusamy Subramaniam, for his invaluable guidance, insightful comments, patience,
strong encouragement and personal concerns both academically and otherwise through-
out the course of my research. By meeting and discussing with Professor Subramaniam
every week during the past five years, his comments, critiques and attitude towards re-
search were deeply engraved into this thesis, and also significantly improved the quality
of this research.
I would like to express my special thanks to my colleagues and closest friends Chen
Ruifeng, Chanaka D. Senanayake and Lin Yuheng, who have given me valuable sugges-
tions for this research.
My gratitude is also extended to other friends in Control and Mechatronics Lab: Yu
Deping, Feng Xiaobing, Ganesh Kumar Meenashisundaram, Kok You Cheng, Huang
Weiwei, Fu Yong, Yang Jianbo, Zhao Guoyong, Wan Jie, Weng Yulin, Zhao Meijun,
Zhu Kunpeng, Wang Qing, Albertus Adiwahono, Zhou Longjiang, Dau Van Huan, Chao
Shuzhe, Wu Ning and many others. They have provided me with helpful comments,
great friendship and a warm community during the past few years in NUS.
i
I gratefully acknowledge that my PhD study and this research are financially supported
by the research scholarship provided by the National University of Singapore.
To my family, in particular, I would like to thank my parents for their unwavering faith
in me, and my sisters for their strong support, of which I’m truly grateful.
Finally, my deepest thanks to my wife Yun Li for her support, understanding and en-
couragement through these years.
ii
Table of Contents
Acknowledgments i
Summary vii
List of Tables x
List of Figures xiii
1 Introduction 1
1.1 Motivation . . . . . . . . . . . . . . . . . . . . . . . . . . . . . . . . . 1
1.1.1 Quality failures . . . . . . . . . . . . . . . . . . . . . . . . . . 4
1.1.2 Sampling plans . . . . . . . . . . . . . . . . . . . . . . . . . . 5
1.1.3 Rework loops . . . . . . . . . . . . . . . . . . . . . . . . . . . 6
1.2 Performance improvement of manufacturing systems using the proposed
integrated quantity and quality approach . . . . . . . . . . . . . . . . . 8
1.2.1 Determining suitable continuous sampling plans . . . . . . . . 8
1.2.2 Allocating appropriate buffer capacities in the system . . . . . . 9
1.2.3 Identifying bottleneck machines of multistage systems . . . . . 10
1.2.4 Positioning of inspection machines in multistage systems . . . . 11
1.3 Thesis outline . . . . . . . . . . . . . . . . . . . . . . . . . . . . . . . 12
2 Performance analysis of manufacturing systems: state of the art 13
2.1 Fundamental modeling approaches . . . . . . . . . . . . . . . . . . . . 14
2.2 Analytical studies on manufacturing systems with sampled inspection . 18
2.3 Performance analysis of systems with both operational and quality failures 21
iii
2.4 Analysis of manufacturing systems with rework loops . . . . . . . . . . 23
2.5 Chapter summary . . . . . . . . . . . . . . . . . . . . . . . . . . . . . 26
3 Analysis of manufacturing systems with continuous sampling plans 28
3.1 Overview . . . . . . . . . . . . . . . . . . . . . . . . . . . . . . . . . 28
3.2 Modeling a single stage manufacturing system with continuous sam-
pling plans . . . . . . . . . . . . . . . . . . . . . . . . . . . . . . . . . 29
3.3 Modeling two stage systems: building blocks for decomposition analy-
sis of multistage systems . . . . . . . . . . . . . . . . . . . . . . . . . 36
3.3.1 Performance evaluation using single failure mode model . . . . 38
3.3.2 Performance evaluation using multiple failure mode model . . . 39
3.3.3 Validation of the proposed methods for evaluating the perfor-
mance of two stage systems . . . . . . . . . . . . . . . . . . . 40
3.3.4 Quantitative analysis on the effects of sampling plans on system
performance . . . . . . . . . . . . . . . . . . . . . . . . . . . 44
3.4 Determining the best sampling plan of multistage systems . . . . . . . . 47
3.4.1 Decomposition of multistage systems with sampling plans . . . 47
3.4.2 Determining the best sampling plan for maximizing profit . . . 51
3.4.3 Case studies . . . . . . . . . . . . . . . . . . . . . . . . . . . . 53
3.5 Chapter summary . . . . . . . . . . . . . . . . . . . . . . . . . . . . . 56
4 Analysis of systems with machines having both operational and quality fail-
ures 58
4.1 Overview . . . . . . . . . . . . . . . . . . . . . . . . . . . . . . . . . 58
4.2 Modeling of two-machine, one-buffer lines with both operational and
quality failures . . . . . . . . . . . . . . . . . . . . . . . . . . . . . . 59
4.2.1 Inspection machine model . . . . . . . . . . . . . . . . . . . . 61
4.2.2 Processing machine model . . . . . . . . . . . . . . . . . . . . 61
4.2.3 Machine-buffer-inspection model . . . . . . . . . . . . . . . . 63
4.2.4 A method for solving the balance equations . . . . . . . . . . . 67
iv
4.2.5 Performance measures . . . . . . . . . . . . . . . . . . . . . . 70
4.2.6 Model validation . . . . . . . . . . . . . . . . . . . . . . . . . 71
4.3 Decomposition of multistage systems with both operational and quality
failures . . . . . . . . . . . . . . . . . . . . . . . . . . . . . . . . . . 74
4.3.1 Decomposition model . . . . . . . . . . . . . . . . . . . . . . 76
4.3.2 Validation . . . . . . . . . . . . . . . . . . . . . . . . . . . . . 81
4.4 Applications . . . . . . . . . . . . . . . . . . . . . . . . . . . . . . . . 89
4.5 Chapter summary . . . . . . . . . . . . . . . . . . . . . . . . . . . . . 92
5 Analysis of manufacturing systems with rework loops 94
5.1 Overview . . . . . . . . . . . . . . . . . . . . . . . . . . . . . . . . . 94
5.2 A 3M1B Markov model for rework systems . . . . . . . . . . . . . . . 95
5.3 Decomposition of multistage systems with rework loops . . . . . . . . 103
5.3.1 Quality of material flow . . . . . . . . . . . . . . . . . . . . . 103
5.3.2 Decomposition analysis of multistage rework systems . . . . . 109
5.4 Results and Discussion . . . . . . . . . . . . . . . . . . . . . . . . . . 117
5.4.1 Model validation . . . . . . . . . . . . . . . . . . . . . . . . . 117
5.4.2 Applications of the model . . . . . . . . . . . . . . . . . . . . 121
5.5 Extending of the model to systems with inspection errors . . . . . . . . 130
5.6 Chapter summary . . . . . . . . . . . . . . . . . . . . . . . . . . . . . 132
6 Conclusions and future research work 134
6.1 Conclusions . . . . . . . . . . . . . . . . . . . . . . . . . . . . . . . . 134
6.2 Future research work . . . . . . . . . . . . . . . . . . . . . . . . . . . 137
6.2.1 Incorporating vendor selection into performance analysis of im-
perfect production systems . . . . . . . . . . . . . . . . . . . . 138
6.2.2 Manufacturing systems with machines having multiple quality
failures . . . . . . . . . . . . . . . . . . . . . . . . . . . . . . 139
6.2.3 Workforce planning . . . . . . . . . . . . . . . . . . . . . . . 140
v
6.2.4 Integrated quantity and quality analysis of flexible systems . . . 142
6.2.5 Developing a single model for studying real systems with vari-
ous issues such as sampling plans, rework and quality failures . 143
Author’s Publications 145
Bibliography 147
Appendices 160
Appendix A: Balance equations for the single stage model with sampling
plans . . . . . . . . . . . . . . . . . . . . . . . . . . . . . . . . . . . 160
Appendix B: Balance equations for the machine-buffer-inspection model . . . 164
Appendix C: Balance equations for the 3M1B model . . . . . . . . . . . . . 167
vi
Summary
The fierce competition in the global market pressurizes manufacturers to improve pro-
ductivity, quality and other performance for financial survival. Improving manufactur-
ing performance is a challenging task due to the complex configurations of multistage
systems and the existence of various uncertainties. Uncertainties such as machine break-
downs and random processing times substantially undermine the performance. Quality
failures, the scrap of defects, inspection strategies, and rework loops further compli-
cate system modeling and performance prediction. This thesis incorporates the study of
these uncertainties into the analysis of multistage manufacturing systems, and proposes
an integrated quantity and quality approach for evaluating the performance. Using the
proposed approach, several managerial problems, which are often encountered in manu-
facturing plants, are solved for improving both quantitative and qualitative performance
simultaneously.
This thesis first investigates manufacturing systems with continuous sampling plans.
This is a critical inspection strategy often adopted in industrial factories. An analytical
method is proposed for modeling single-stage, two-stage and multistage systems and
predicting both quantitative and qualitative performance. Using the proposed method,
the effects of sampling parameters pertaining to various performance measures are stud-
ied quantitatively in numerical experiments. This method is further used as a mathe-
matical tool in determining the best sampling plan for maximizing the performance of
manufacturing systems. Experimental results also demonstrate the computational effi-
ciency of the proposed method compared to simulation.
vii
Analysis of manufacturing systems with uncertainties in both operational and quality
failures is another major study of this thesis. Using Markov chains to represent both
types of failures, an integrated quantity and quality method is proposed for evaluating
the performance of such systems. This model also characterizes the roles of an inspec-
tion station in real manufacturing systems, i.e., to detect defective parts as well as to
monitor the quality status of a processing machine. Manufacturers may use this model
to optimize system configurations such as buffer capacities.
In systems with imperfect product quality, when defective parts are detected by inspec-
tion, these defects may then be delivered back to various stages for rework. Analytical
modeling of such multiple rework loop systems is lacking in the published literature.
This thesis proposes an analytical method for the performance analysis of rework sys-
tems. This model is capable of identifying various bottlenecks and studying bottleneck
migration characteristics in rework systems. Such bottleneck analysis benefits industrial
practitioners in continuously improving the system performance.
In addition, developing analytical models using Markov chains requires a large number
of states to characterize various uncertainties such as operational and quality failures
in manufacturing systems. Much computational effort is involved in solving the bal-
ance equations of these analytical models. The thesis also develops a mathematical
method for reducing the computational effort in obtaining the solution. Experimental
results demonstrate that this method leads to greater computational efficiency compared
to simulation.
Keywords: Multistage Manufacturing Systems; Performance Evaluation; Markov Chains;
Quantitative and Qualitative Performance; Decomposition; Continuous Sampling Plans;
Rework; Bottleneck Identification
viii
List of Tables
3.1 State transition for the continuous sampling plan . . . . . . . . . . . . . 34
3.2 Experiment parameters of two stage systems . . . . . . . . . . . . . . . 42
3.3 Simulation results of the two stage systems . . . . . . . . . . . . . . . 43
3.4 Parameters of multistage systems . . . . . . . . . . . . . . . . . . . . . 50
3.5 Comparison of results from the analytical model and simulation . . . . 51
3.6 The best sampling plans of cases 1 and 3 . . . . . . . . . . . . . . . . . 54
3.7 The best sampling plans of Cases 19 and 20 . . . . . . . . . . . . . . . 56
4.1 Balance equation groups . . . . . . . . . . . . . . . . . . . . . . . . . 64
4.2 CPU time comparison of analytical methods and simulation . . . . . . . 73
4.3 Parameters for a six-machine production line (group 1) . . . . . . . . . 82
4.4 Parameters of a twenty-machine production line (group 2) . . . . . . . 83
4.5 Comparison of decomposition and simulation results . . . . . . . . . . 84
4.6 Computational time against the number of machines in the production line 86
4.7 Comparison of simulation and decomposition . . . . . . . . . . . . . . 87
4.8 Parameters . . . . . . . . . . . . . . . . . . . . . . . . . . . . . . . . . 90
5.1 Blocked states of machine M
3
. . . . . . . . . . . . . . . . . . . . . . 99
5.2 Blocked states of machine M
1
. . . . . . . . . . . . . . . . . . . . . . 99
5.3 Balance equation groups . . . . . . . . . . . . . . . . . . . . . . . . . 100
5.4 Outgoing quality of each machine in the rework subsystem of M
J
. . . . 107
5.5 Experiment parameters . . . . . . . . . . . . . . . . . . . . . . . . . . 119
5.6 Comparison of results from the analytical model and simulation . . . . 120
5.7 Parameters of Cases A and B . . . . . . . . . . . . . . . . . . . . . . . 125
ix
5.8 Bottleneck identification of Cases A and B . . . . . . . . . . . . . . . . 125
5.9 Parameters of Cases C and D . . . . . . . . . . . . . . . . . . . . . . . 126
5.10 Bottleneck identification of Cases C and D . . . . . . . . . . . . . . . . 127
x
List of Figures
1.1 Integrated quantity and quality modeling of manufacturing systems . . . 4
2.1 Decomposition of multistage manufacturing systems . . . . . . . . . . 15
2.2 A 2M1B Markov model . . . . . . . . . . . . . . . . . . . . . . . . . . 16
2.3 A continuous sampling plan . . . . . . . . . . . . . . . . . . . . . . . 20
2.4 A multistage system with ubiquitous inspections . . . . . . . . . . . . . 23
2.5 Multistage manufacturing systems with a single rework loop . . . . . . 25
2.6 Multiple rework loop systems . . . . . . . . . . . . . . . . . . . . . . . 26
3.1 A single stage system with sampling inspection, where M
P
is a process-
ing machine and M
I
is an inspection machine . . . . . . . . . . . . . . 31
3.2 A multistage system with sampling inspections . . . . . . . . . . . . . 36
3.3 Single stage system simplification . . . . . . . . . . . . . . . . . . . . 36
3.4 Decomposition of multistage systems . . . . . . . . . . . . . . . . . . 37
3.5 State transition chart of M
i
using the multiple failure mode model . . . 39
3.6 Performance comparison of the analytical methods for two-stage sys-
tems with continuous sampling plans . . . . . . . . . . . . . . . . . . . 44
3.7 The effect of varying sampling fractions f
L
1
and f
L
2
on system performance 45
3.8 The effect of varying clearance numbers c
g
1
and c
g
2
on system performance 46
3.9 Decomposition of multistage systems with sampled inspection . . . . . 48
4.1 A machine-buffer-inspection system . . . . . . . . . . . . . . . . . . . 60
4.2 A Markov model for an unreliable machine, where p and r are the tran-
sition rates of operational failure and repair respectively. . . . . . . . . 61
4.3 State transition of a processing machine . . . . . . . . . . . . . . . . . 62
xi
4.4 Transition diagrams of Group 4 (α
1
= 1, α
2
= 1): (a) internal transition;
(b) lower boundary transition; (c) upper boundary transition . . . . . . . 65
4.5 Transition diagrams of Group 9 (α
1
= 0
1
α
2
= 1) . . . . . . . . . . . . 66
4.6 A flow chart of the lower-boundary-based solution method . . . . . . . 68
4.7 Performance error . . . . . . . . . . . . . . . . . . . . . . . . . . . . . 72
4.8 System performances as a function of buffer size . . . . . . . . . . . . 74
4.9 Decomposition process of a multistage production line . . . . . . . . . 75
4.10 An observer at buffer B
i
in the decomposed line segment and the long line 79
4.11 Flow rate and average inventory (Case 5) . . . . . . . . . . . . . . . . . 85
4.12 Flow rate and average inventory (Case 8) . . . . . . . . . . . . . . . . . 86
4.13 Performance measures against simulation time period . . . . . . . . . . 88
4.14 Sensitivity analysis of unit processing cost C
p
3
. . . . . . . . . . . . . . 91
5.1 Decomposition of multiple rework loop systems . . . . . . . . . . . . . 96
5.2 Two possible 3M1B lines . . . . . . . . . . . . . . . . . . . . . . . . . 96
5.3 Transition diagrams for Group 5 . . . . . . . . . . . . . . . . . . . . . 100
5.4 The rework subsystem of inspection machine M
J
. . . . . . . . . . . . 104
5.5 Material flow in the rework subsystem of inspection machine M
J
. . . . 105
5.6 The calculation of γ
i
. . . . . . . . . . . . . . . . . . . . . . . . . . . . 107
5.7 Outgoing quality of machine M
j+1
. . . . . . . . . . . . . . . . . . . . 108
5.8 3M1B and 2M1B models . . . . . . . . . . . . . . . . . . . . . . . . . 109
5.9 Decomposition of multistage rework systems where M
i
is a processing
machine . . . . . . . . . . . . . . . . . . . . . . . . . . . . . . . . . . 110
5.10 Decomposition of multistage rework systems where M
i
is an inspection
machine . . . . . . . . . . . . . . . . . . . . . . . . . . . . . . . . . . 114
5.11 Rework system configurations for the 16 cases (buffers exist between
machines and are not depicted in this figure) . . . . . . . . . . . . . . . 118
5.12 Performance of the rework system of Case 11 where an additional in-
spection machine is placed after the ith processing machine, i = 1,2, ,7 122
xii
5.13 The effects of the defective rate of M
5
on the bottlenecks for Case D . . 128
5.14 The effects of the defective rate of M
2
on the bottlenecks for Case D . . 129
5.15 Performance comparison of analytical model and simulation for systems
with inspection errors . . . . . . . . . . . . . . . . . . . . . . . . . . . 132
6.1 Multiple quality failure modes . . . . . . . . . . . . . . . . . . . . . . 140
6.2 Workforce planning for a production line . . . . . . . . . . . . . . . . . 141
xiii
Chapter 1
Introduction
1.1 Motivation
The effect of globalization and the easy accessibility of world markets has created tur-
bulence in the business environment, thereby pressurizing manufacturers to enhance
manufacturing performance for financial survival (Anand and Kodali, 2009). In the
past decades, manufacturers of many industries have made relentless efforts to improve
throughput and quality as well as manage inventory (Gerold, 2004). This industrial need
has also motivated many researchers in academia to study the performance of various
manufacturing systems. However, it is challenging to predict the performance of manu-
facturing systems as they are subjected to substantial uncertainties, such as:
• Machines in the system may fail after operating for some periods.
• Defects may be produced randomly.
• Processing times of each machine may vary.
• Delay in job arrival and departure may occur frequently.
These uncertainties significantly affect the performance of manufacturing systems. For
example, machine breakdowns cause much unwanted interruption to production thereby
1
leading to frequent delay in delivering finished products (Mok, 2009). These uncertain-
ties complicate modeling manufacturing systems and optimizing system configurations
for achieving the best performance.
Manufacturing systems with such uncertainties have been successfully studied using
stochastic theories such as Markov chains. Markov models have been proposed for
production lines with unreliable machines (Buzacott and Shanthikumar, 1993; Li and
Meerkov, 2009). These models are utilized as quick tools for estimating various per-
formance measures such as throughput and WIP. Such tools can also benefit industrial
practitioners in improving performance by reconfiguring manufacturing systems. For
example, these models have been used to determine appropriate buffer spaces (Shi and
Gershwin, 2009; Matta et al., 2005a) and allocate workforce (Altiok, 1997) in multi-
stage systems for maximizing throughput. These models have also been extended to
study production lines where the system WIP is monitored by various control policies,
viz., Kanban, CONWIP (CONstant Work-In-Process), etc. (Matta et al., 2005b; Bonvik
et al., 2000; Zhao et al., 2002; Gershwin, 2000).
Although much progress has been made in analytical research on throughput maximiza-
tion and WIP reduction, other important performance regarding quality has been studied
limitedly in the performance analysis of multistage manufacturing systems (Price et al.,
1994). It has been widely acknowledged that quality is critical to manufacturing in-
dustries, and losses of quality may significantly undermine profit and competitiveness
of manufacturers (Colledani and Tolio, 2006). For instance, the number of automo-
bile recalls due to quality problems has increased globally (Aoyama and Koga, 2009),
and recently Toyota Motors has recalled millions of vehicles at the loss of more than
$2 billion (Haq, 2010). In recent years it is becoming increasingly imperative to con-
trol and improve the quality in manufacturing systems. Unfortunately, it has been long
2
treated separately with throughput improvement and WIP control of manufacturing sys-
tems(Tempelmeier and Burger, 2001; Inman et al., 2003). Research indicates that quali-
tative performance measures, e.g., yield and outgoing quality of manufacturing systems
are highly coupled with quantitative performance measures, viz., production rate, inven-
tory, etc (Li and Meerkov, 2009). For example, in multistage manufacturing systems,
placing more inspection stations may improve quality but slow down production (Van
Volsem et al., 2007). Another example is that higher inventory in the line may increase
production rate but affect quality control (Khouja, 2003). It is necessary to incorporate
quality control into quantity control of manufacturing systems for simultaneously im-
proving performance measures. Therefore, this thesis proposes an integrated quantity
and quality approach for performance analysis of multistage manufacturing systems,
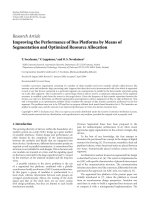
and the outline of this approach is described in Fig. 1.1.
As illustrated in this figure, this thesis investigates the performance of multistage manu-
facturing systems with various uncertainties. In addition to the uncertainties in machine
failures, processing times, etc., this research also characterizes the uncertainties in im-
perfect quality such as defects, inspection, etc., of manufacturing systems. This research
provides quantitative analysis of the impact of production reliability, quality failures,
inspection strategies, rework loops, etc., on the system performance. Based on the pro-
posed integrated quantity and quality approach, analytical methods are also explored
for improving the quantitative and qualitative performance of multistage systems. In
the following subsections, the author shall elaborate on the major quality characteristics
(which are also shown in Fig. 1.1) of manufacturing systems:
3
Manufacturing systems
Quantitative models
Qualitative models
Random machine failures and repairs
Varying processing times
Uncertain demands and supplies
Finite storage spaces
Multiple stations/machines
Defects
Sampling
Scrap
Rework
Throughput, WIP, Lead time,
Outgoing quality, yield,
Integrated quantity and quality models
(Performance evaluation tools)
Throughput improvement
WIP control
Quality improvement
….
Solving managerial problems
Planning inspection stations
Buffer allocation
Bottleneck Identification
Determining sampling plans
Workforce assignment
….
Modeling
Integration
Altering system configurations
Markov chains
Decomposition
Simulation
Statistical methods
Figure 1.1: Integrated quantity and quality modeling of manufacturing systems
1.1.1 Quality failures
Although the manufacturing philosophy ‘doing it right the first time’ is pursued in every
industry, real manufacturing systems are subjected to defects (Shina, 2002). After oper-
ating for a certain time period, a machine may experience quality failures and generate
4
defects. The defective boards found in PCB manufacturing industries range from 1-30%
of the total production (Agnihothri and Kenett, 1995). These defects significantly de-
crease the system throughput and thereby undermine the profitability of the system (Li
and Meerkov, 2009).
Manufacturing system with quality failures have been studied using statistical process
control (Montgomery, 2009). Usually only qualitative performance has been analyzed,
while throughput and WIP have seldom been studied in statistical quality control. How-
ever, as mentioned in the previous section, the quality of manufacturing systems are
highly coupled with quantitative performance measures (Li and Meerkov, 2009). For
example, the occurrence of quality failures not only cause reduction in throughput but
also lead to higher scrap rate (Colledani et al., 2010). Buffer capacities may increase
throughput but also affect quality improvement (Kim, 2005). Therefore, developing
an integrated quantity and quality approach for analyzing manufacturing systems with
quality failures is one of the major contributions of this thesis.
1.1.2 Sampling plans
In manufacturing systems with imperfect product quality, inspection machines are placed
in the system to detect defective parts. An inspection machine in multistage systems usu-
ally have two roles: one is to inspect and identify defective parts from flowing down-
stream, and the other is to trigger the stoppage and repair of a processing machine if
a part out of this processing machine is found to be defective (Cao and Subramaniam,
2009). An inspection machine may check all parts (i.e., screening inspection) in the
production line, and this leads to high accuracy in detecting defective parts. However,
screening inspection may significantly slow down the production and increase inspec-
5
tion cost. Industrial practitioners often adopt continuous sampling plans to reduce in-
spection efforts as well as monitor process quality (Veatch, 2000). A typical sampling
plan begins with screening inspection. When a certain number (i.e. clearance num-
ber) of consecutive parts are found clear of defects, screening inspection is discontinued
and only a fraction of the parts are inspected. Sampled inspection continues until a
defective part is detected, at which time screening inspection is resumed. Continuous
sampling plans have advantages over screening inspection in reducing inspection cost
and improving production rate. Therefore, continuous sampling plans have been used
in various manufacturing industries, e.g., wafer fabrication lines (Anthony, 2004), func-
tional board plants (Antila et al., 2008), etc.
Driven by industrial needs, much research has been devoted to finding the best sampling
plan for minimizing inspection costs with satisfactory requirements on quality (Chen
and Chou, 2003). Unfortunately, other performance measures such as throughput and
WIP which may be substantially affected by sampling plans, have not been considered
in the research works published in the literature. There is a lack of quantitative stud-
ies on the effects of sampling plans on throughput and WIP (Mandroli et al., 2006).
Few analytical models have been proposed for determining the best sampling plan to
simultaneously improve both quantitative and qualitative performance of a manufactur-
ing system. Therefore, analyzing manufacturing systems with sampling plans is another
major focus of this thesis.
1.1.3 Rework loops
Real manufacturing systems may experience substantial defects. These defects generate
waste in the form of yield loss, additional material handling costs, excessive produc-
6
tion delays, etc (Hadjinicola, 2010). The costs resulting from defects may amount to
10-25% of total sales in the electronics industry (Agnihothri and Kenett, 1995). These
defective parts may be either scrapped or reworked (Chern and Yang, 1999). Scrap
(scrapped items may also be returned to vendor) results in the removal of material from
the production system and thereby cause financial losses. To salvage the value of de-
fects, defective parts may be reworked in many industries such as semiconductor, steel,
pharmaceutical, food, etc (Liu et al., 2009; Lee et al., 2008). In a system with rework
loops, a defective part if detected, is delivered back to the station which caused the de-
fects and the station once again processes the defective part (Liu and Yang, 1996). In
a multistage system environment, multiple rework loops usually exist as one inspection
machine may be designed to detect defects produced by several machines (Sarker et al.,
2008; Kim, 2005). This is a common feature in garment production lines, automotive
paint shops, metal industries such as drill collar manufacturing (Vasudevan et al., 2008;
Li, 2004).
The existence of rework loops in manufacturing systems complicates performance anal-
ysis. For example, improving the performance of a bottleneck in rework systems may
lead to sophisticated phenomena such as bottleneck migration (Li and Meerkov, 2009).
The performance of rework systems vary significantly depending on the number and the
location of rework loops in the multistage system (i.e., inspection station allocation).
However, there are limited analytical studies on modeling manufacturing systems with
rework loops. Few research has addressed issues such as bottleneck identification and
inspection allocation for improving performance of rework systems (Cao et al., 2012).
Therefore, the development of a model for analyzing multiple rework loop systems and
evaluating various performance measures i.e., throughput, WIP and quality is also one
of major focuses of this thesis.
7
1.2 Performance improvement of manufacturing systems using the
proposed integrated quantity and quality approach
The analytical methods proposed in this thesis are capable of predicting both quantita-
tive and qualitative performance measures of multistage manufacturing systems. These
methods may be used as quick and viable tools for improving the performance by recon-
figuring manufacturing systems. As shown in Fig. 1.1, the applications of the proposed
methods are illustrated through solving the following managerial problems:
1.2.1 Determining suitable continuous sampling plans
As mentioned previously, a continuous sampling plan has several advantages over screen-
ing inspection (i.e., 100% inspection) (Montgomery, 2009). Continuous sampling plans
may reduce the inspection cost as well as improve the production rate, as there is less
inspection involved. In addition, when inspection activities may cause damage to the
product, a continuous sampling plan may also reduce the unnecessary damage.
Researchers have studied the economic design of sampling plans, i.e., finding the sam-
pling parameters to minimize total cost consisting mainly of inspection and penalty costs
due to delivering defects to customers (Chen and Chou, 2003; Haji and Haji, 2004).
However, these sampling plans are determined based on outgoing quality and average
inspection fraction. Quantitative performance such as throughput and WIP which may
be significantly affected by sampling plans, have not been explored in these researches.
In addition, to find the best sampling parameters, it is necessary to evaluate and compare
the performance of systems with a large number of sampling combinations, and thus a
quick mathematical tool is required for estimating the performance.
8
The proposed analytical method provides reliable estimates of both quantitative and
qualitative performance measures in a short time. It is applicable for performing quan-
titative analysis of the effects of sampling plans on throughput and WIP. Thus, it may
be used for determining the best sampling plans to meet system requirements on both
qualitative and quantitative performance.
1.2.2 Allocating appropriate buffer capacities in the system
Allocating buffer capacities in a production line is a way of improving the system perfor-
mance using structural reconfigurations (Colledani et al., 2010). As the material flow in
multistage systems may be disrupted by machine failures or variable processing times,
buffers are placed between machines to mitigate the propagation of disruptions through-
out the line and limit the effect of blockage and starvation phenomena. Inclusion of
buffers benefits manufacturers in improving system throughput, while it also leads to
higher WIP in the system. In addition, buffers require additional capital investment
and floor space, which may be expensive (Gershwin, 2000). If the capacities of buffers
are too large, the WIP holding and capital costs incurred will outweigh the benefit of
increased productivity. If the buffer capacities are too small, the machines in the sys-
tem will be underutilized or demand will not be met. It is essential to determine buffer
capacities to achieve the desired performance.
A number of methods have been proposed for solving buffer allocation problems for
maximizing throughput with limited total buffer spaces (Shi and Men, 2003; Nahas et
al., 2006; Shi and Gershwin, 2009). Recent research demonstrates that buffer capacities
not only affect the throughput and WIP of multistage systems but are also tightly related
with quality. Larger buffer capacities may increase throughput and WIP (Kim, 2005).
9
When quality issues are considered in the system, higher WIP may cause late detection
of defects which leads to a decline in outgoing quality (Khouja, 2003; Bulgak, 1992).
Therefore, solving buffer allocation problems of imperfect production system requires
an analytic model for evaluating both quantitative and qualitative performance measures.
The proposed model in this thesis provides an ideal tool for solving buffer allocation
problems.
1.2.3 Identifying bottleneck machines of multistage systems
The bottleneck machine of a multistage manufacturing system is the machine that im-
pedes the system’s performance (e.g., throughput) in the strongest manner (Lawrence
and Buss, 1995). Generally, improving performance of the bottleneck machine results
in a significantly higher system throughput as compared to improving the performance
of non-bottleneck machines (Li et al., 2009). When a machine is recognized as the bot-
tleneck, managers may then concentrate continuous improvement activities and allocate
resources for improving the performance of the bottleneck machine (Chiang et al., 1998;
Lawrence and Buss, 1995). For example, manufacturers may allocate more space for
the buffers before and after the bottleneck. However practitioners should be mindful that
any improvements to a bottleneck may result in new bottlenecks appearing in the system
(bottleneck shifting or migration). Therefore, bottleneck analysis is of high interest in
manufacturing operations.
Analytical methods have been proposed for identifying up-time and down-time bottle-
neck machines in a serial production line with perfect product quality (Kuo et al., 1996;
Chiang et al., 1998). For systems with imperfect quality, Li and Meerkov (2009) pro-
posed an analytical method for identifying the bottleneck in a production line with single
10
rework loop. The results of this research demonstrate that changes in quality of parts
may cause bottlenecks in the system to shift. However, the influences of inspection ma-
chines and multiple rework loops on the bottleneck in the system have not been analyzed
in the published literature.
As quality parameters such as defective rates of machines, may also significantly affect
the system throughput (Kim and Gershwin, 2005), it is also necessary to identify the
quality bottleneck in the system in addition to up-time and down-time bottlenecks. The
proposed integrated quantity and quality approach in this thesis is capable of detecting
these three types of bottlenecks. It also benefits manufacturers in studying bottleneck
migration characteristics of rework systems and improving system performance through
bottleneck analysis.
1.2.4 Positioning of inspection machines in multistage systems
In multistage manufacturing environments, each machine may generate defects ran-
domly, and this results in substantial yield losses, wasted machine resources, additional
material handling costs, etc (Heredia-Langner et al., 2002). It is common practice for
industrial practitioners to place inspection machines at different stages to detect these
defects and improve product quality. A suitable inspection allocation scheme also leads
to considerable reduction in the cost of production and is of benefit to the profitability
and competitiveness of manufacturers.
A number of analytical models have been proposed for determining the exact position of
inspection machines in imperfect production systems. In these research studies, inspec-
tion is usually allocated for minimizing the total cost per finished part (Lee and Unnikr-
ishnan, 1998; Shiau, 2002). The total cost (consisting mainly of processing, inspection,
11