Mechanisms and functions of lymphangiogenesis in regulating the immune response and inflammation resolution 2
Bạn đang xem bản rút gọn của tài liệu. Xem và tải ngay bản đầy đủ của tài liệu tại đây (8.99 MB, 135 trang )
!
106!
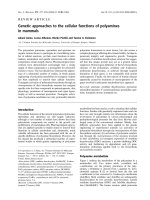
Figure 5.1. Spatial differences in VEGF-A distribution accompany the
differential remodeling of cortical and medullary sinuses during prolonged
inflammation (A) VEGF-A expression was largely confined to the subcapsular B cell
regions of the activated LNs at day 4 post-immunization but was also detected within
the T cell zone and LN medulla at day 14. Scale bar in represents 400 µm (B)
Confocal images revealed that while VEGF-A co-localized with subcapsular sinuses
on both day 4 and 14 after immunization, VEGF-A co-localization with the cortical
and medullary sinuses were detected only on day 14. Scale bars represent 50µm.
!
107!
Given the intricate relationship between FRC network and lymphatic channels, we
also examined VEGF-A distribution with respect to the ER-TR7
+
reticular fibers
associated with lymphatics. VEGF-A co-localized with the reticular network that
lined subcapsular sinuses (identified by presence of DCs within lymphatics in
previous sequential section, not shown) (dotted white lines demarcated subcapsular
lymphatics) on both day 4 and 14 post-immunization (Fig. 5.2A). Interestingly, while
VEGF-A was largely absent from the ER-TR7
+
network associated with cortical and
medullary sinuses (identified by absence of DCs in lumen of LYVE-1+ sinuses in
previous sequential section, not shown) (dotted while lines demarcate cortical and
medullary sinuses, lumen marked by L) on day 4 post-immunization, there was an
obvious association of VEGF-A with the ER-TR7
+
FRC fibers that lined cortical and
medullary sinuses at day 14 post-immunization (Fig. 5.2A). Association between
FRCs lining cortical and medullary sinuses and VEGF-A was ascertained to occur at
2 interfaces - VEGF-A was present at the surface and inside reticular fibers (Fig.
5.2B). While the observation of VEGF-A within and on the reticular fibers is
suggestive that VEGF-A is produced by FRCs and secreted into the LN parenchyma,
we cannot exclude the possibility that extra-nodal VEGF-A may be transported within
reticular conduits and subsequently displayed on FRCs.
To further explore the relationship between lymphatics and FRCs, we used VEGFR3
as another marker for lymphatics. We observed similar close spatial association
between lymphatics and FRCs (Fig 5.2C). Closer examination also revealed that
cortical and medullary sinuses, FRCs and VEGF-A in LNs from day 14 post-
immunization engaged in a tripartite interaction whereas such an interaction was not
observed at day 4 (Fig. 5.2C).
!
108!
Altogether, these data indicate that as the inflammation evolved, spatial differences in
the distribution of VEGF-A within DLNs may mediate the remodeling of cortical and
medullary sinuses.
!
109!
!
110!
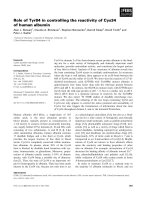
Figure 5.2. Association of VEGF-A with the FRCs lining lymphatics (A) VEGF-A
co-localized with FRCs that lined subcapsular sinuses on both day 4 and 14 after
immunization. VEGF-A association with FRCs that lined cortical and medullary
sinuses was detected only on day 14 post-immunization. Dotted while lines
demarcates lymphatics (B) Orthogonal plane view of how VEGF-A is aligned on the
FRCs lining cortical and medullary sinuses. Inset shows enlarged image of confocal
image stack of boxed region in E. VEGF-A can be found on the surface of as well as
inside FRCs; (C) The interaction between cortical-medullary lymphatics, FRCs and
VEGF-A in LNs on day 14 post-immunization. Scale bars represent 50µm. L = lumen
!
111!
5.2.2 Interstitial flow is required for the differential distribution of VEGF-A in
lymph node during inflammation
Interstitial flow acting in concert with lymphangiogenic factor has been reported to be
a key driving force of lymphangiogenesis (Boardman and Swartz, 2003; Goldman et
al., 2007). Moreover, alterations in interstitial flow have also been shown to be
important for the expression of chemokines by FRCs (Tomei et al., 2009). We
therefore considered the possibility that interstitial flow through the LNs during
inflammation might influence the expression and distribution of VEGF-A and,
thereby support differential LV remodeling. To address this, we designed a surgical
strategy to perturb LN interstitial flow by cutting the afferent lymphatics draining the
popliteal LN at day 10 post-immunization. Mice that received sham operations served
as controls (Fig. 5.3A). Mice were sacrificed 1 day after surgery. Patency or
obstruction of lymphatic flow to the popliteal LN was verified (Fig. 5.3B).
!
112!
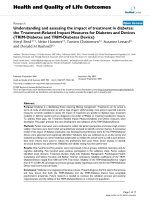
Figure 5.3. LV surgery to disrupt lymph flow to the popliteal lymph node. (A)
Afferent lymphatic vessels were cut on one side (‘LV resection’) while a sham
operation was performed on LVs on the contralateral side (‘sham’). FITC-dextran
uptake was used as a marker of lymphatic transport and flow. LV transport of FITC-
dextran to LN following ‘LV resection’ was cut off compared to the ‘sham’ LN. (B)
At sacrifice, FITC-dextran injected into footpads of mice verified that lymph flow to
the popliteal LNs was still functional in the ‘sham’ side and not patent in the side with
‘LV resection’. The popliteal LN with the intact LV was brightly fluorescent while
fluorescence of the popliteal LN drained by the severed LV was dim. Scale bar in (B)
represents 2mm.
!
113!
While VEGF-A expression was preserved in the sham-treated LNs, perturbation of
interstitial flow dramatically decreased expression of VEGF-A in LNs (Fig. 5.4A). In
addition, perturbation of interstitial flow altered VEGF-A distribution in LNs such
that it was markedly confined to the superficial cortex. This indicated that during late
inflammation, interstitial flow within LNs governed distribution of VEGF-A into the
paracortex and medulla. To further support this, disruption of interstitial flow was
noted to obliterate association of VEGF-A with cortical and medullary sinuses
compared to sham-treated LNs (Fig. 5.4B). This implies that lymph flow through the
LN could influence the spatial-temporal distribution of VEGF-A during the course of
inflammation and, as a consequence, modulate the remodeling of cortical and
medullary sinuses.
As other groups have described that interstitial flow can modulate FRC organization
and function (Tomei et al., 2009) and, in our model, extra-nodal VEGF-A may be
transported within FRC fibers and subsequently displayed and/or produced by FRCs ,
we next investigated what might be the repercussions of disrupting interstitial flow on
VEGF-A interaction with the fibroblastic reticular network. In contrast to sham-
treated LNs, perturbation of interstitial flow through LNs ablated VEGF-A co-
localization with ER-TR7
+
reticular fibers lining the cortical and medullary sinuses
(Fig 5.4C). This suggests that LN interstitial flow is an important regulator of both
VEGF-A production and presentation by the FRC network.
!
114!
!
115!
Figure 5.4. Disrupting interstitial flow through DLNS affected VEGF-A
localization (A) LV resection resulting in perturbation of interstitial flow, affected
VEGF-A expression and distribution in DLNs. Confocal images showed that
disruption of interstitial flow in DLNs abolished association of VEGF-A with
cortical-medullary sinuses (B) and with FRCs lining them (C). Scale bar in (A)
represents 400 µm. Scale bar in (B) and (C) represents 50µm. L = lumen
Images are representative of 3 independent experiments (n=3).
!
116!
5.3 Summary
Our data provide, to our knowledge, the first evidence that inflammation when it
evolves from early to late phases can induce a differential remodeling of lymphatics,
the subcapsular sinuses being expanded first followed by the cortical and medullary
sinuses. Our data supported a scenario whereby interplay between LN interstitial
flow, fibroblastic reticular network and spatial-temporal distribution of VEGF-A
formed coordinating forces to drive cortical and medullary sinuses remodeling during
late inflammation.
During early inflammation, VEGF-A may be transported from its primary site of
production, i.e the inflamed peripheral tissue, to the DLNs (Halin et al., 2007) and/or
produced by activated B cells or FRCs residing in the cortex of the DLNs (Angeli et
al., 2006). At this stage, VEGF-A expression was mainly confined to the subcapsular
region of the LN. The heparin-binding carboxyl-domain of the predominant VEGF-A
isoform, VEGF
164
may bound the molecule to the extracellular matrix and limit its
access deeper into the LN via the reticular network (Ferrara et al., 2003). In contrast,
at later phases of inflammation, VEGF-A expression was not restricted to the
subcapsular region of the LN but extended into the cortical and medullary regions.
This led us to suspect that differential remodeling of lymphatics may be attributed in
part to temporal-spatial changes in VEGF-A distribution in the inflamed LN. As
further proof, while VEGF-A was noted to co-localize with subcapsular sinuses on
both day 4 and 14 after immunization, VEGF-A co-localization with cortical and
medullary sinuses was only observed on day 14 post-immunization.
!
117!
We proceeded to show, using surgical experiments, that the temporal-spatial
distribution of VEGF-A within the activated LNs during inflammation was dependent
on interstitial flow. In addition, interstitial flow may also support the production of
VEGF-A by FRCs and/or combined with expansion of the FRC network increase
delivery of extra-nodal VEGF-A to the T cell zone. Regardless of its source, VEGF-A
may be displayed by cortical and medullary sinuses -lining reticular fibers to drive
expansion of the sinuses.
Chapter 6
Results
Neutrophils can drive lymph node
lymphangiogenesis in mice lacking
B cells
!
118!
Chapter 6. Neutrophils can drive lymph node
lymphangiogenesis in mice lacking B cells
6.1 Introduction
Many immune cells have been described to orchestrate lymphangiogenesis in
inflamed peripheral sites and the draining LNs. Macrophages, in particular, have been
demonstrated to be indispensable in driving lymphangiogenesis in the inflamed
periphery (Baluk et al., 2005; Cursiefen et al., 2004b; Cursiefen et al., 2011; Kang et
al., 2009; Kataru et al., 2009; Kim et al., 2009; Kubota et al., 2009; Maruyama et al.,
2005; Yao et al., 2010) and LNs draining the inflamed sites (Kataru et al., 2009). DCs
have been linked to the induction of lymphangiogenesis in various models of tissue
inflammation (Baluk et al., 2005; Hamrah et al., 2003; Kanao and Miyachi, 2006;
Muniz et al., 2011). T cells have also been reported to induce de novo
lymphangiogenesis when recruited into murine thyroids over-expressing CCL21
(Furtado et al., 2007). Although neutrophils have been described to express VEGF-C
in a murine model of chronic airway inflammation (Baluk et al., 2005), a possible
involvement in lymphangiogenesis has never been carefully examined. Our group
(Angeli et al., 2006) and others (Liao and Ruddle, 2006; Shrestha et al., 2010) have
shown that B cells are critical for LN lymphangiogenesis occurring early after
immunization and sensitization. In order to understand if B cells continue to be
important mediators of LN lymphangiogenesis during late inflammation, we
immunized transgenic mice that are unable to express the µ heavy chain hence lacking
B cells (µMT mice) with CFA/ KLH. Unexpectedly, this led to the serendipitous
finding that neutrophils play an overlooked but pivotal role in driving
lymphangiogenesis.
!
119!
6.2 Results
6.2.1 Lymph node lymphangiogenesis in µMT mice is greater than WT mice
during later phases of inflammation
Consistent with our earlier paper (Angeli et al., 2006), immunization of µMT mice
induced a smaller increase in LN cellularity and lymphangiogenesis compared to WT
mice at day 4 post-immunization (not shown). At 7 days post-immunization, we
continued to see a diminished increase in LN cellularity (Fig. 6.1A) and
lymphangiogenesis (Fig. 6.1B) in µMT compared to WT mice. By day 14 post-
immunization, we saw a paradoxical expansion in the LEC population in the µMT
mice (29-fold over control) that exceeded their WT counterparts (8-fold over control)
(Fig. 6.1B). This greater increase in LEC population in µMT mice was sustained until
90 days after immunization. Notably, this increase in the LEC population in µMT
mice was not dependent on LN cellularity but primarily associated with an increased
proportion of the LEC population (Fig. 6.1, A and B). Analysis of LN sections by
immunofluorescence staining for lymphatics was consistent with our flow cytometry
data. While early expansion of the lymphatic network was clearly greater in inflamed
WT compared to µMT LNs, this gave way to a greater growth of lymphatics in µMT
LNs by day 14 post-immunization (Fig. 6.1C).
Expansion of the BEC and FRC populations in inflamed µMT LNs occurred in a
manner similar to LECs. In the early phase of inflammation, expansion of the BEC
and FRC populations in µMT LNs was less compared to WT but the converse was
seen in the late phases of inflammation (Fig. 6.1, D and E).
!
120!
!
121!
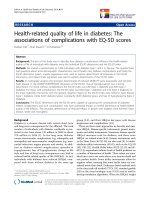
Figure 6.1. LN remodeling in WT and µMT mice following CFA/ KLH footpad
immunization. (A) Increase in LN cellularity in WT and µMT mice following
immunization (B) Expansion of LECs population in WT and µMT mice following
immunization. (C) Immunofluorescence analysis of WT and µMT LN sections . (D
and E) Expansion of the BEC (D) and FRC (E) populations in inflamed µMT LNs
mice following immunization.
Results are pooled from 3 independent experiments with 3-4 mice per group in each
experiment. Student’s t test, *: p<0.05. Error bars represent SD. Images are
representative of 3 independent experiments (n=3). Scale bar represent 200µm.
!
122!
1.2.2 Lymph node lymphangiogenesis in µMT mice is accompanied by
accumulation of neutrophils and monocytes
We next examined the T cell, DC and myeloid cell populations present in WT and
µMT LNs as this may provide clues as to what cells may drive lymphangiogenesis in
the absence of B cells. We found similar increases in the T cell and DC populations in
WT and µMT LNs at all time points after immunization (data not shown).
Coincidentally, we observed a greater increase in the absolute numbers of myeloid
cells (defined as CD11b
positive
CD11c
negative
cells
-
staining cells) in µMT LNs
compared to WT (Fig. 6.2A). These myeloid cells expressed intermediate to high
levels of Gr-1 (Fig 6.2A) and likely represent neutrophils and/ or monocytes. Indeed,
when we used Ly6G as a specific marker for neutrophils (Daley et al., 2008; Fleming
et al., 1993), we found that a good proportion of these myeloid cells in µMT LNs
were made up of neutrophils (defined as CD11b
positive
Ly6G
positive
staining cells) (Fig.
6.2B), although monocytes were also present. Increase in the absolute numbers of
neutrophils in the early days after immunization (days 4 and 7) were initially
comparable between WT and µMT LNs (Fig. 6.3A). However, by day 14 post-
immunization, the increase in neutrophils in µMT LNs (28-fold over control)
surpassed that of WT (5-fold over control) and was sustained for 90 days (Fig. 6.3A).
A similar scenario was seen when we examined the increase in monocytes (defined as
CD11b
positive
CD11c
negative
Gr-1
positive
Ly6G
negative
staining cells); increase in
monocytes in µMT LNs (18-fold over control) surpassed that of WT (5-fold over
control) (Fig. 6.3B) and was sustained for 90 days.
!
123!
Figure 6.2. Myeloid cells and neutrophil populations in WT and µMT LNs at baseline and day 14 after immunization as revealed
by flow cytometry. (A) Typical dotplots representing the myeloid cells population in WT and µMT LNs at day 14 after immunization.
(B) Typical dotplots representing the neutrophil population in WT and µMT LNs at day 14 after immunization. Numbers next to gates
indicate percent of cells relative to the total live single cells population.
Data shown are representative of 3 independent experiments with 3-4 mice per group in each experiment
!
124!
Figure 6.3. Myeloid cells and neutrophil populations in WT and µMT LNs after
immunization. (A) Increase in the neutrophil population in WT and µMT LNs
following immunization. (B) Increase in the monocyte population in WT and µMT
LNs following immunization.
Data shown are pooled from 3 independent experiments with 3-4 mice per group in
each experiment. Student’s t test, *: p<0.05. Error bars represent SD.
!
125!
Upon staining LN sections for CD11b, we verified that there was a striking
infiltration of CD11b
+
cells into the µMT compared to WT LNs (Fig. 6.4A). More
importantly, we noted that these CD11b
+
cells interacted very closely with the
growing lymphatics in the µMT LNs (Fig. 6.4A). Further immunostaining performed
on these same µMT LNs revealed that the CD11b
+
cells which interacted closely with
lymphatics, were also Ly6G
(Fig. 6.4B) and Gr-1 (Fig. 6.4C) expressing. This
suggested that the CD11b
+
cells that accumulated in µMT LNs at day 14 post-
immunization consisted mainly of neutrophils and monocytes. In addition, their close
proximity to the growing lymphatics suggested that these cells may functionally drive
lymphangiogenesis in the absence of B cells.
!
126!
Figure 6.4. Myeloid cells and neutrophil populations in WT and µMT LNs at day 4 and 14 after immunization. (A) Increased
infiltration of CD11b
+
cells in µMT compared to WT LNs on day 14 post-immunization. The CD11b
+
cells in µMT LNs were in close
interaction with lymphatics. (B and C) Immunostaining performed on LN sections in (A) revealed that the CD11b
+
cells present in µMT
LNs were also Ly6G
+
(B) and Gr-1
+
(C) expressing. Data shown are representative of 3 independent experiments (n=3). Scale bars
represent 100µm for (A) and 200µm for (B) and (C).
!
127!
6.2.3 Neutrophils are critical for lymph node lymphangiogenesis in the absence
of B cells
As expansion of neutrophils in µMT LNs at day 14 was the most dramatic amongst
the immune cells and this coincided with a surge in lymphangiogenesis, we
hypothesized that neutrophils may compensate for B cells to drive lymphangiogenesis
during late inflammation. In order to determine if neutrophils are truly important for
lymphangiogenesis in a model where B cells are absent, we treated µMT mice with
the neutrophil-depleting NIMP-R14 MAb or a control rat IgG for 2 weeks after
immunization (Fig. 6.5A). Blood profiles for both NIMP-R14 MAb and control rat
IgG-treated mice were performed on days 0, 7 and 14 to assess depletion of
neutrophils. Treatment with NIMP-R14 MAb effectively depleted neutrophils in the
peripheral blood for the 2 weeks after immunization (Fig. 6.5B) and attenuated
accumulation of neutrophils in µMT LNs at day 14 (Fig. 6.5D). Compared to the 16-
fold increase in LEC numbers in control rat IgG treated µMT mice at day 14,
treatment with NIMP-R14 MAb abrogated increase in LEC numbers to only 2.6-fold
(Fig 6.5C). Treatment of µMT mice with NIMP-R14 MAb also affected expansion of
the BEC and FRC populations compared to control rat IgG-treated mice. It is
noteworthy that attenuating neutrophil accumulation led to a paradoxical increase in
the population of non-granulocytic myeloid cells (defined as defined as CD11b
positive
CD11c
negative
Ly6G
negative
and either GR-1
intermediate
or F4/80
positive
staining cells by
flow cytometry) within µMT LNs. These non-granulocytic myeloid cells likely
consisting of both monocytes and macrophages, escalated from a 10-fold increase in
control rat IgG-treated mice to a 40-fold increase in NIMP-R14-treated mice (Fig.
6.5D). However, in spite of this increased accumulation of non-granulocytic myeloid
!
128!
cells in the µMT LNs, they were not able to compensate for neutrophils in driving
lymphangiogenesis.
!
129!