Structural and binding characterization of the antiviral host proteins, VIPERIN and VAPC
Bạn đang xem bản rút gọn của tài liệu. Xem và tải ngay bản đầy đủ của tài liệu tại đây (2.21 MB, 133 trang )
STRUCTURAL AND BINDING CHARACTERIZATION
OF THE ANTIVIRAL HOST PROTEINS,
VIPERIN and VAPC
SHAVETA GOYAL (M.Sc. Biotech)
A THESIS SUBMITTED
FOR THE DEGREE OF DOCTOR OF PHILOSOPHY
DEPARTMENT OF BIOCHEMISTRY
YONG LOO LIN SCHOOL OF MEDICINE
NATIONAL UNIVERSITY OF SINGAPORE
(2012)
I
Acknowledgments
The time period between Jan 2008 to Jan 2012 will be one of the most
memorable periods of my life. I have learnt a lot during this period. These four years
added into me the scientific temperament, which is the foremost requirement for
researchers. There are few important people for making this Ph.D. thesis possible and
I take this as an opportunity to thank them.
I would like to offer my most sincere gratitude to my supervisor, Dr. Song
Jianxing who gave me the opportunity to work as a Ph.D. student in his laboratory. He
gave me the freedom to explore my project on my own, yet he was always there for
discussions and valuable comments. His door was always open for the consultation.
His guidance, enthusiasm for science, support and giving me full independence for
my project is highly appreciated.
I am grateful to my co-supervisor Dr. Vincent T.K. Chow for his expert
advice, comments and suggestions. I thank him for his support throughout my Ph.D.
candidature. I appreciate and thank Dr. Tan Yee Joo for being a collaborator in HCV
project and helping me with the constructs and her guidance for the project. I am
thankful to Dr. Jingsong Fan for NMR experiment training and his help in collecting
NMR spectra on the 800 MHz and 500MHz spectrometer.
I would like to thank Dr. Shi Jiahai, an ex-Ph.D. from our lab, who made
me feel comfortable in the lab as well as with protein work during my initial days in
NUS. I want to say thanks to my lab mates for maintaining healthy work space. I
extend my gratitude to Dr. Qin Haina for being there whenever I needed help in NMR
experiments and data processing work. I thank Huan Xuelu, Garvita, Wang Wei and
Miao Linlin for their help and support.
II
I also want to thank Mr. Lim Ek Wang (Microbiology) for allowing me to use
anaerobic chamber, which was of great help for my first project. I thank Janarthan for
helping me with the chemicals.
I thank all the structure biology labs supervisors and lab members for helping
me with the chemicals or experiment related materials. I am thankful to NUS for
providing me the scholarship during my Ph.D. candidature, which was a great support
during all these years.
This thesis work would not have been possible without the support and
encouragement of my family. Their trust and my stubbornness, always kept me keep
going with my work. They are my life line and a pillar of support and have always
encouraged me to do good work.
This acknowledgment will be incomplete if I do not mention about my friends,
who have always been there for my help. I thank Chhavi, Suma, Hari, Atul, Karthik,
Priya and Mukesh. I also thank my house-mates Madhu, Asfa and Anusha for being
so much accommodating and keeping the environment healthy and lively, which have
always helped me to regain energy after the daylong work.
III
TABLE OF CONTENTS
ACKNOWLEDGEMENTS I
TABLE OF CONTENTS III
SUMMARY VII
LIST OF FIGURES VIII
LIST OF TABLES X
LIST OF SYMBOLS XI
CHAPTER 1 INTRODUCTION 1
1.1 Protein structure studies 2
1.2 Features of NMR spectroscopy 3
1.2.1 NMR for proteins 3
1.3 Principle of NMR 4
1.3.1 Larmor frequency 5
1.3.2 Chemical shift 6
1.3.3 Coupling 6
1.3.4 Free induction decay 7
1.3.5 Relaxation 8
1.3.5.1 Spin-spin relaxation time (T1) 8
1.3.5.2 Spin-spin relaxation time (T2) 8
1.3.5.3 NOE (Nuclear Overhauser Enhancement) 9
1.4 Structure details by NMR
1.4.1 1-Dimension NMR 9
1.4.2 The
1
H-
15
N coupling for the heteronuclear NMR analysis 11
1.4.3 Sequential assignment
1.4.3.1 Homonuclear
1
H-NMR spectroscopy 12
1.4.3.2 Heteronuclear sequential assignment 13
IV
1.4.4 Chemical shift analysis 14
1.5 Structure Determination by NMR 15
1.6 Outline of NMR experiment 16-17
1.7 Protein-ligand interaction by NMR 17
1.7.1 Mapping of Chemical Shifts 18-19
1.8 Circular Dichroism 19-21
CHAPTER 2 BIOLOGICAL SIGNIFICANCE OF VIPERIN
2.1 Introduction
2.1.1 Viperin sequence details 23-25
2.1.2 Viperin in Immune response 26-27
2.1.3 Viperin Induction and Action 27-28
2.1.4 Influenza virus inhibition by viperin 29-30
2.1.5 Radical SAM domain proteins 30-32
2.1.6 AIMS 33
2.2 MATERIALS AND METHODS
2.2.1 Vector Construction 35-36
2.2.2 Protein Expression and Purification
2.2.2.1 Expression and purification of insoluble proteins 37
2.2.2.2 Expression, Purification and Reconstitution of the [Fe
4
–S
4
]
cluster in Viperin (45–361) 38-39
2.2.3 Media prepration for NMR sample 39
2.2.4 UV–visible Spectroscopy 39
2.2.5 Circular dichroism (CD) 39-40
2.2.6 NMR sample prepration 40
V
2.3 RESULTS AND DISCUSSION
2.3 Structure details of Viperin
2.3.1 Structural characterization of the human viperin fragments 42-45
2.3.2 Reconstitution of the [4Fe–4S] cluster in Viperin (45–361) 45-49
and viperin (45-361) mutant
2.3.3 Structural characterization of the buffer-insoluble Viperin 49-51
(214–361)
2.3.4 Conclusion 52-53
2.3.5 Future work 53
CHAPTER 3 BIOLOGICAL SIGNIFICANCE OF VAPC
3.1 Hepatitis 56
3.1.1 Acute and Chronic Hepatitis 56-57
3.1.2 HCV genotype 57-58
3.1.3 Life cycle of HCV 58-59
3.1.4 Genome organization 60-61
3.1.5 NS5B (RNA dependent RNA polymerase, RdRp) 61-63
3.1.6 VAP Proteins 63-65
3.1.7 Interaction of VAP proteins with HCV proteins 65-67
3.1.8 Therapeutics for HCV 67-69
3.1.10 AIMS 70
3.2 MATERIALS AND METHODS
3.2.1 Vector Construction 72
3.2.2 Codon optimization 72-73
3.2.3 Preparation of Competent E.coli Cells 73
3.2.4 Transformation of E. coli Cells 73
3.2.5 Protein Expression and Purification
3.2.5.1 Expression and purification of full length VAPC and
VI
truncated constructs 73-74
3.2.5.2 Expression and purification of NS5B 74-75
3.2.6 Preparation of Isotope Labeled Proteins 76
3.2.7 Determination of Protein Concentration by Spectroscopy 76
3.2.8 Circular Dichroism Spectroscopy 76
3.2.9 NMR experiments 77
3.3 RESULTS AND DISCUSSION
3.3.1 Protein purification 79-80
3.3.2 Structure characterization of full length VAPC protein 81-85
3.3.3 Interaction of VAPC to HCV NS5B 86-88
3.3.4 VAPC C-terminal constructs 88-89
3.3.4.1 Structural characterization of VAPC43, VAPC31 and VAPC14 90-93
3.3.4.2 Interaction of VAPC43 with HCV NS5B 94-98
3.3.3.3 Interaction of VAPC14 with HCV NS5B 98-99
3.3.4 Determination of dissociation constant (K
d
) through HSQC titration 100-
102
3.3.5 Discussion 103-105
3.3.6 Future work 105
CHAPTER 4. PERSPECTIVE 107
4.1 Association of Viperin and VAP proteins 107-108
4.2 Other Cellular proteins as target for antiviral drugs 108-109
REFERENCES 110-119
PUBLICATION 120
VII
SUMMARY
Cellular proteins with antiviral properties have always been the priority area
for researchers. Recent advances in the structural characterization of the proteins have
provided a strong foundation towards these efforts. Human immune system act
strongly against viral infection by up-regulation of certain proteins which are active
against such infections. The present work is about two such cellular proteins, Viperin
and VAPC, which show antiviral properties. Viperin (Virus inhibitory protein,
endoplasmic reticulum associated, interferon-inducible), which is an evolutionary
conserved gene and the research work done in past decade proves its antiviral
activities against whole range of viruses ranging from DNA virus to RNA virus. But
these studies lack structural and biochemical details about viperin. My Ph.D. thesis
work showed for the first time that viperin is a radical SAM domain protein and it was
done by systematic removal of N-terminal domain and reconstitution of purified
protein under anaerobic conditions.
Another cellular protein, VAPC (vesicle-associated membrane protein-
associated protein (VAP subtype C) inhibits HCV virus by interaction with HCV
unstructured protein NS5B. Our results indicate that VAPC is a member of
intrinsically unstructured protein (IUP) with no secondary and tertiary structures.
Extensive NMR characterization reveals that the C-terminal half of VAPC is involved
in binding with NS5B and the isolated C-terminal 43 residues shows even tighter
binding affinity with NS5B than the full length protein. The results demonstrate that
the intrinsically unstructured VAPC form a “fuzz” complex with NS5B and also for
the first time we designed a shorter VAPC-peptide which specifically bind NS5B with
a Kd of 49.13 M. In the future, functional characterization needs to be done to
evaluate its potential as peptide mimic in treatment against HCV infection.
VIII
LIST OF FIGURES
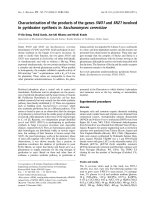
Figure 1.1 Dependence of secondary structure elements on Φ/Ψ angles 4
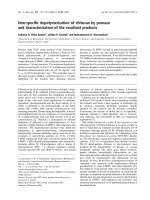
Figure 1.2 The spinning nucleus with a charge precessing in a magnetic field 5
Figure 1.3 Dihedral angle (φ) 7
Figure 1.4 The free induction decay (FID) 8
Figure 1.5. NOE patterns associated with secondary structure 10
Figure 1.6 Comparison of NMR spectra of folded and unfolded protein 11
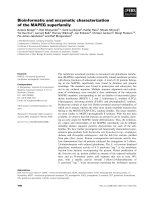
Figure 1.7 Protein backbone highlighting the amide hydrogen/nitrogen pair
correlated in the 2D 12
Figure 1.8 HNCACB and CBCACONH connectivity 14
Figure 1.9 Chemical shift analysis of the peptide backbone NMR signals 15
Figure 1.10 Strategy of structure determination by NMR 17
Figure 1.11 CD spectra of various secondary structure 20
Figure 2.1.1 Sequence comparison of human viperin 25
Figure 2.1.2 Schematic representation of immune response pathway that
leads to the disruption of viral release from the plasma membrane 28
Figure 2.1.3 Model diagram showing the Influenza A virus release upon viperin
expression and interaction with FPPS 30
Figure 2.1.4 SAM domain conserved sequence and reaction 31-32
Figure 2.2.1 Secondary structure prediction and truncation representation 36
Figure 2.3.1 FPLC and DLS profiles of viperin 43-44
Figure 2.3.2 Far UV and Near UV CD and 2D NMR spectra of unreconstituted
viperin 45-46
Figure 2.3.3 CD, UV and 1D characterization of viperin (45-361) 48-49
Figure 2.3.4 CD and NMR characterization of viperin C-terminal 50-51
Figure 2.3.5 2D HSQC for Viperin (SAM+C-terminal) domain 55
Figure 3.1.1 HCV global prevalence 2010 57
IX
Figure 3.1.2 Schematic diagram of life cycle of HCV 59
Figure 3.1.3 HCV genome organization, polyprotein processing and topology 62
Figure 3.1.4 Crystal Structure of NS5B 63
Figure 3.1.5 General domain organization of VAP protein 64
Figure 3.1.6 Alignment of the amino acid sequences of hVAP-C with
hVAP-B and hVAP-C. 64
Figure 3.1.7 Model for the mechanism of formation of HCV replication
complex on lipid raft 68-69
Figure 3.3.1 Purification profiles of VAPC and NS5B 79-80
Figure 3.3.2 VAPC sequence, CD and 1D spectra representation 82
Figure 3.3.3 2D-
1
H
15
N HSQC 83
Figure 3.3.4 VAPC full length Cα (observed-random) 85
Figure 3.3.5 Far UV CD spectra,1D NMR and CSD calculation of VAPC 86-88
Figure 3.3.6 Representation of VAPC c-terminal constructs 89
Figure 3.3.7 CD and 1D NMR of VAPC constructs 90
Figure 3.3.8 HSQC and sequential assignments of VAPC43 and VAPC14 91
Figure 3.3.9 Hα Chemical shift deviation plot of VAPC 43 93
Figure 3.3.10 NOE pattern representation for VAPC43 93
Figure 3.3.11 VAPC43 structure 93
Figure 3.3.12 VAPC43 titration experiment to HCV NS5B 95-98
Figure 3.3.13 VAPC14 on titration to HCV NS5B 99
Figure 3.3.14 Fitting curves for VAPC43 and VAPC14 102
X
LIST OF TABLES
Table 2.3.1 Brief description of truncated fragments of Viperin with their expression
patterns and the techniques used to study the purified protein 44
Table 3.1 Geographical distribution of HCV genotypes 58
Table 3.1.2 Cost of updated HCV treatment 68
Table 3.1.3 HCV Direct-Acting Antivirals (DAA) in Clinical Trial Phase II or III, or
FDA-Approved 68
Table 3.3.1 Random Coil Chemical shifts (in ppm) for the 20 common amino acids in
acidic 8 M urea 85
Table 3.3.2 Kd values with SD (standard deviation) of shifted residues from VAPC43
and VAPC 14 101
XI
SYMBOLS and ABBREVATIONS
γ Gyromagnetic Ratio
δ Chemical Shift
∆Cα Cα Conformational Shifts
α Alpha
β Beta
β-ME Beta mercaptoethanol
Micro
φ Phi angle
ψ Psi angle
ω
0
Precessional frequency
dαN/ dβN / dNN NOE Connectivity Between CαH/ CβH/ NH with NH
Å Angström
I Spin Number
Kd Dissociation constant
B Magnetic field
1D One-dimension
2D Two-dimension
3D Three dimensions
CD Circular Dichroism
CSD Chemical Shift Deviation
DTT Dithiothreitol
E.coli Escherichia coli
FID Free induction decay
GST Gluthathione S-transferase
XII
HCV Hepatitis C virus
HSQC Heteronuclear Single Quantum Coherence
IPTG Isopropyl β-D-thiogalactopyranoside
IUP Intrinsically unstructured proteins
ITC Iso-thermal calorimetry
LB Luria Bertani
MALDI-TOF MS Matrix-Assisted Laser Desorption/Ionization Time-off light
Mass Spectroscopy
NOE Nuclear Overhauser Enhancement
NOESY Nuclear Overhauser Enhancement Spectroscopy
NMR Nuclear Magnetic Resonance
OD Optical Density
PBS Phosphate-buffered Saline
PCR Polymerase Chain Reaction
PDB Protein Data Bank
ppm Part Per Million
RdRp RNA dependent RNA polymerase
RMSD Root Mean-square Deviation
RP-HPLC Reversed-Phase High Performance Liquid
Chromatography
TOCSY Total Correlation Spectroscopy
UV Ultraviolet
1
Chapter -1 INTRODUCTION
2
Introduction
1.1 Protein structure studies
The structure based approach to study the biological system has brought
advances in understanding the important molecular mechanisms of biological system.
Structural biology has shown explosive growth since late 1980s, with the number of
high resolution structures of proteins added to the protein data bank (PDB) currently
growing at more than 2000 per year (Kelly S.M. et.al. 2005). This has allowed much
more detailed insights into the function of systems. Detailed protein structure and
interaction studies constitute the foundation for novel drug discovery and drug design.
Lots of techniques are available to study the proteins like, X-ray crystallography,
NMR (Nuclear magnetic resonance spectroscopy), Electron microscopy (EM),
Circular dichroism (CD), ITC (Isothermal calorimetry), Biacore and many more.
NMR spectroscopy and X-ray crystallography are currently the powerful techniques
capable of determining three-dimensional structures of biological macromolecules
like proteins and nucleic acids at atomic resolution. This chapter gives description of
NMR technique and usage in protein studies and a brief account about use of CD.
Few years back, X-ray crystallography was the main technique for protein
structure studies and is superior to NMR in determining structures of much larger
macromolecules, in a more automated way but since 1946, when the NMR was first
used it has developed into premier organic spectrophotometric technique to study
biomolecules. The important role of NMR in structural biology is illustrated by more
than 6000 NMR solution structures deposited in the protein data bank. It has some
advantages over X-ray crystallography technique. With NMR it is possible to study
3
the time dependent phenomenon. It allows the study of intramolecular dynamics in
macromolecules, reaction kinetics, molecular recognition or protein folding.
1.2 Features of NMR spectroscopy
Nuclear magnetic resonance spectroscopy is the technique to study physical,
chemical, and biological properties of matter. NMR is a powerful analytical tool to
study molecular structure including relative configuration, relative and absolute
concentrations and intermolecular interactions. By using NMR spectroscopy proteins
can be studied in solution state and conditions like pH, temperature and salt
concentrations can be adjusted to mimic the physiological condition. NMR is able to
characterize very weak interactions between macromolecules and ligands at atomic
resolution by means of chemical-shift changes and makes this technique a major tool
in rational drug design and discovery.
1.2.1 NMR for proteins
The signals in NMR spectroscopy are referred to as resonances. Their positions
in NMR spectrum depend on the local environment of nucleus producing the signal
and referred to as chemical shifts reported in ppm. Protein structure study using NMR
starts with assignment of maximum possible resonances of as many hydrogen, carbon
and nitrogen on the protein of interest. The resonance of Cα, Cβ, Co and Hα depends
on phi (φ)/psi(ψ) angle propensities (Spera S. et.al. 1991; Wang Y. et.al. 2002). The
secondary and tertiary structure of protein is decided by its phi(φ)/psi(ψ) angle values.
Figure 1.1 shows the possible φ/ψ values for different conformation of protein. So, it
is the basic peptide bond structure which lays the foundation of protein structure
studies by NMR. The following section gives the brief overview of NMR in protein
structure solution.
4
Figure 1.1 Dependence of secondary structure elements on Φ/Ψ angles. A)
Representation of Φ and Ψ angles on peptide bond. B) Ramachandran plot shows the
dependence of secondary structure elements on the Φ/Ψ angles. Adapted from Peti W.
et al. (2000)
1.3 Principle of NMR
All nucleons (neutrons and protons) composing any atomic nucleus, have the
intrinsic quantum property of spin. This means they rotate around the given axis. The
overall spin is determined by the spin quantum number I. Nuclei with even number of
protons and neutrons (e.g.
12
C,
16
O,
32
S) have I = 0 and has no overall spin as their
spins are paired and cancel each other. Isotopes with odd number of protons and/or
of neutrons (
1
H,
13
C and
15
N) have an intrinsic magnetic moment and angular
momentum, in other words a nonzero spin. Spinning charged particles are associated
with magnetic field and behave like small magnets. The magnetic field developed by
(A)
(B)
5
the rotating nucleus is described by a nuclear magnetic moment vector or microscopic
magnetization vector , which is proportional to the spin angular moment vector.
1.3.1 Larmor frequency
A nucleus with magnetic moment (), when placed in external magnetic field,
orients opposite to the direction of external magnetic field, B (Figure 1.2) and precess
around the axis of external magnetic field. This is called Larmor precession. The
frequency of this precession is proportional to the strength of the external magnetic
field and is a physical property of the nucleus with a spin. The precessional frequency,
ω
0
= γ B
0,
where γ is the gyromagnetic ratio and is constant for all nuclei of a given
isotope.
Figure 1.2 Spinning nucleus with a charge precessing in a magnetic field. Adapted
from Van De Ven F. J. (1995)
Protons (
1
H) have a high natural abundance (99.9885 %) and gyromagnetic ratio is
also high ((γ
1
H/γ
13
C is bout 4 and γ
1
H/γ
13
N is about 10) (Roberts, 1970), which makes
them the most sensitive nuclei for NMR investigations. Introduction of
15
N and
13
C
NMR active stable isotopes has made the structure studies of protein relatively easy.
T
here are some phenomenon in
required
information about molecular stru
described below.
1.3.2 Chemical Shift (δ)
T
he resonance frequency depends upon the kind of nuclei (γ) and the external
magnetic field (B
0
).
Therefore, similar kind of
frequency. But i
n biological samples we deal with
surrounded by different electronic densities.
electronic circulations, which in turn create an induced local magnetic field at the
nucleus position.
The tota
moment will therefore be reduced depending on strength of the locally induced
magnetic field. Induced magnetic field is the characteristic of chemical nature of
group, to which it belongs. This i
more commonly known as the chemical shift. It is one of the most basic parameter of
NMR and is usually quoted in parts per million (ppm).
1.3.3 Coupling
Nuclei
in molecules are not isolated and so the
c
an interact between themselves. The phenomenon of
through the polarization of the electrons in the orbitals
scalar coupling or J-
coupling.
signal.
The value of J is independent of the external magnetic field and its value
decays to zero for nuclei separated by more than 4 or 5 bonds
here are some phenomenon in
NMR
, which when intelligently used,
information about molecular stru
cture and dynamics
and some of those are
he resonance frequency depends upon the kind of nuclei (γ) and the external
Therefore, similar kind of
nuclei would resonate at a same
n biological samples we deal with
“chemical” protons
surrounded by different electronic densities.
The external magnetic field induces
electronic circulations, which in turn create an induced local magnetic field at the
The tota
l effective magnetic field that acts on the nuclear magnetic
moment will therefore be reduced depending on strength of the locally induced
magnetic field. Induced magnetic field is the characteristic of chemical nature of
group, to which it belongs. This i
s called a screening effect or shielding effect, or
more commonly known as the chemical shift. It is one of the most basic parameter of
NMR and is usually quoted in parts per million (ppm).
in molecules are not isolated and so the
magnetic moments
an interact between themselves. The phenomenon of
interaction
between nuclei
through the polarization of the electrons in the orbitals
joining the two nuclei is called
coupling.
The coupling is observed by a splitting of the NMR
The value of J is independent of the external magnetic field and its value
decays to zero for nuclei separated by more than 4 or 5 bonds
. It is an important
6
, which when intelligently used,
provides
and some of those are
he resonance frequency depends upon the kind of nuclei (γ) and the external
nuclei would resonate at a same
“chemical” protons
which are
The external magnetic field induces
electronic circulations, which in turn create an induced local magnetic field at the
l effective magnetic field that acts on the nuclear magnetic
moment will therefore be reduced depending on strength of the locally induced
magnetic field. Induced magnetic field is the characteristic of chemical nature of
s called a screening effect or shielding effect, or
more commonly known as the chemical shift. It is one of the most basic parameter of
magnetic moments
of nuclei
between nuclei
joining the two nuclei is called
The coupling is observed by a splitting of the NMR
The value of J is independent of the external magnetic field and its value
. It is an important
7
phenomenon as it the basis of coherence transfer between nuclei, a crucial step in the
development of two- and multidimensional NMR spectroscopy. J coupling along with
chemical shift can produce characteristic patterns of couplings in many types of the
amino acids, which are helpful to identify amino acid types. The size of the coupling
depends on structural properties such as, dihedral angles (φ) (Figure1.3) via Karplus
equation.
Figure1.3 Dihedral angle (φ)
To determine the torsion angles and χ1, 3JNHHα and 3JHαHβ are used thus
providing important information on conformations of peptide backbone and amino
acid side chains. Deviation of 3JNHHα values from random coil values provides
valuable secondary structural information. For α helices peptide segments where the
- angle is around -60°, coupling constants is around 4 Hz, and it is between 8 and 12
Hz for peptide segments in β-structures, where the - angle is in the -120° range. But
for unfolded proteins it is estimated to be around 6~7.5Hz because of the averaging of
coupling constant caused by conformational fluctuation (Dyson et al, 2004).
1.3.4 Free Induction Decay (FID)
The nuclear magnetization perpendicular to magnetic field decreases with time
and is measured in the receiver coil as fluctuating declining amplitude with time. This
measures a frequency decay rate as a function of time (Figure 1.4).
8
The FID is a function of time; the Fourier transformation converts this to a
function of frequency.
Figure 1.4 Free induction decay, FID, is measured as a function of time in the x- and
y-directions perpendicular to magnetic field. Adapted from Van De Ven F.J. (1995)
1.3.5 Relaxation
The NMR process is an absorption process. Nuclei in the excited state must also
relax and return to the ground state and the timescale for this relaxation is crucial to
the NMR experiment. The timescale for relaxation gives information about how the
NMR experiment is executed and consequently, how successful is the experiment. T1
and T2 (the inverses of the relaxation rates) are, respectively, the longitudinal (spin-
lattice) and transverse (spin-spin) relaxation times.
1.3.5.1 Spin-lattice relaxation time (T1): In T1 relaxation time, longitudinal
relaxation energy is transferred to the molecular framework (lattice) and is lost as
vibrational or translational energy. The half-life for this process is called the spin-
lattice relaxation time.
1.3.5.2 Spin-spin relaxation time (T2): In this process, energy transfer to the
neighboring nucleus. The half-life for this is called spin-spin relaxation time. The
peak width in an NMR spectrum is inversely proportional to the lifetime and depends
on T2. These are influenced by the mobility in the solution, and so the molecular size
9
of the compound of interest. For large molecules T2 values reduces and the spectra
produced is with broader lines.
1.3.5.3 NOE (Nuclear Overhauser Enhancement)
This is also a kind of relaxation phenomenon and was discovered by Alber
Overhauser in 1953. Nuclei close to each other in space transfer energy to each other
during relaxation, and extent of transfer depends on the distance between the nuclei. It
is normally detected between nuclei separated by a distance of less than 5Å. The NOE
between two protons can be used to estimate the distance between them and is helpful
in determining the two-dimensional and three-dimensional structure of the
macromolecule (Figure 1.5) (Jeremy N.S Evans, 1995). NOE intensities are classified
into three different categories, with distances of 1.8-2.7Å is classified as strong NOE,
1.8-3.3Å as medium range NOE and 1.8-5.0Å weak or long range NOE.
1.4 Structure details by NMR
1.4.1 1-Dimension NMR
1-dimension NMR gives important information about protein stucture, whether it
is folded or is unfolded. The figure (Figure 1.6) below shows the 1D spectrum of
folded and unfolded protein. For folded proteins 1D spectra shows well dispersed
peaks over the range of -1 to 12ppm and also presence of upfield peaks in 1D is the
characteristic feature of folded proteins. While for unfolded proteins peak dispersion
is in a narrow range, within just 1ppm range. Due to the large number of protons,
10
Figure 1.5. NOE patterns associated with secondary structure. (A) Broken lines
indicate some of the NOE interactions that may be observable in polypeptide
chains. (B) NOE intensities and NH-CaH J couplings in several types of secondary
structure. The thickness of thc horizontal lines indicates the intensity of the
NOEs. (Adapted from Ad Bax 1989).
nitrogens and carbons in a protein, peaks in 1-dimensional (1D) spectra of proteins are
very overlapped. Peaks are clustered by type of proton, and cluster types are labeled
in the spectrum (Figure 1.6). The overlapping in 1-dimension spectrum can be
separated by adding 2-dimension and is done by using specific series of radio
frequency (rf) pulses and delay in the transfer of magnetization from first nucleus to
second nucleus, and labelling the magnetization with the frequencies of both nuclei.
11
Figure 1.6 Comparison of NMR spectra of folded (top) and unfolded (bottom) protein
(Adapted from Poulsen F.M. 2002).
1.4.2 The
1
H-
15
N coupling for the heteronuclear NMR analysis
The one-bond coupling
1
H-
15
N is the most basic experiment important for the
heteronuclear NMR analysis of proteins and it arises because the magnetization of
the first nucleus is sensitive to the spin orientations of its neighbors. It is
considered the fingerprint of the protein. H-N bond is present in every amino acid
residue except the N-terminal and the proline residues and (Figure 1.7) it correlates
the frequency of the amide hydrogen with that of the amide nitrogen to produce a
single peak for each residue in the protein with the exception of prolines.
Correlation spectroscopy method used to measure this coupling is called a
1
H-
15
N
HSQC spectrum (heteronuclear single quantum correlation).
12
Figure 1.7 A) Protein backbone highlighting the amide hydrogen/nitrogen pair
correlated in the 2D [
1
H
15
N]-HSQC
(B) 2D [
1
H
15
N]-HSQC of protein. Through-bond correlation spectrum between the
hydrogen (1H) and the nitrogen (15N) nuclei of amide groups in a protein. The
location of the amide groups in the polypeptide backbone are sketched in the formulae
on the left. The arrows indicate that each peak in the NMR spectrum corresponds to
one NH-moiety. The axes of the NMR spectrum indicate the chemical shift of the
hydrogen (1H) and the nitrogen (15N) nuclei. (Adapted from Wilder G. 2000)
1.4.3 Sequential assignment
It is a process by which a particular amino acid spin system identified in the
spectrum is assigned to a particular residue in the amino acid sequence.
(A)
(B)