Application of biased scanning probe microscopy techniques for multifunctional characterization of bifeo3 and zno thin films
Bạn đang xem bản rút gọn của tài liệu. Xem và tải ngay bản đầy đủ của tài liệu tại đây (5.21 MB, 171 trang )
APPLICATION OF BIASED SCANNING PROBE
MICROSCOPY TECHNIQUES FOR
MULTIFUNCTIONAL CHARACTERIZATION OF
BiFeO
3
AND ZnO THIN FILMS
AMIT KUMAR
NATIONAL UNIVERSITY OF SINGAPORE
2011
APPLICATION OF BIASED SCANNING PROBE
MICROSCOPY TECHNIQUES FOR
MULTIFUNCTIONAL CHARACTERIZATION OF
BiFeO
3
AND ZnO THIN FILMS
AMIT KUMAR
(M.Tech, Indian Institute of Technology Roorkee, India)
A THESIS SUBMITTED
FOR THE DEGREE OF DOCTOR OF PHILOSOPHY
DEPARTMENT OF MECHANICAL ENGINEERING
NATIONAL UNIVERSITY OF SINGAPORE
2011
i
Preface
This dissertation is submitted for the degree of Doctor of Philosophy in the
Department of Mechanical Engineering, National University of Singapore (NUS)
under the supervision of Associate Professor Zeng Kaiyang. To the best of my
knowledge, all of the results presented in this dissertation are original, and references
are provided to the works by other researchers. The majority portions of this
dissertation have been published or submitted to international journals or presented at
various international conferences as listed below:
1. Q. Q. Ke, A. Kumar, X. J. Lou, Y. Wang, K. Y. Zeng and J. Wang, Origin of
the enhanced polarization in La and Mg co-substituted BiFeO
3
thin film
during the fatigue process, Applied Physics Letters, 100, 2012, 042902.
2. Q. Q. Ke, A. Kumar, X. J. Lou, Y. Wang, K. Y. Zeng and J. Wang, Negative
resistance induced by polarized distribution of oxygen vacancies
Bi
0.9
La
0.1
Fe
0.96
Mg
0.04
O
3
thin Film, Journal of Applied Physics, 110, 2011,
124102.
3. A. Kumar, F. Yan, K. Y. Zeng and L. Lu, Electric, magnetic and mechanical
coupling effects on ferroelectric properties and surface potential of BiFeO
3
,
Functional Materials Letter, 4(1), 2011, 91.
4. T. S. Herng, M. F. Wong, D. C. Qi, J. B. Yi, A. Kumar, A. Huang, F. C.
Kartawidjaja, S. Smadici, P. Abbamonte, C. Sánchez-Hanke, S. Shannigrahi,
J. M. Xue, J. Wang, Y. P. Feng, A. Rusydi, K. Y. Zeng and J. Ding, Mutual
ferromagnetic – ferroelectric coupling in multiferroic copper doped ZnO,
Advance Material, 23 (14), 2011, 1635.
5. A. Kumar, T. S. Herng, J. Ding and K. Y. Zeng, Long-time stability of bipolar
charge in copper and cobalt Zinc Oxide (ZnO) thin film studied by Kelvin
probe force microscopy (submitted for review).
In addition, following papers are published based on mechanical properties of
thin films, which are not the part of this thesis as the work is not directly
related:
ii
6. A. Kumar and K. Y. Zeng, Measurement of hardness of ultra-thin films by the
first derivation of load-displacement curve from nanoindentation data,
International Journal of Modern Physics, B, 24 (1-2), (2010), 256-266.
7. A. Kumar and K. Y. Zeng, “Alternative methods to extract the hardness and
elastic modulus of thin films from nanoindentation load-displacement data”,
International Journal of Applied Mechanics, 2 (1), 2010, 41-68.
Book Chapter
1. K. Y. Zeng, K. B. Yeap, A. Kumar, L. Chen and Haiyan Jiang, "Chapter 3:
Fracture toughness and interfacial adhesion strength of thin films: -
indentation and scratch experiments and analysis", in CRC Handbook of
Nano-Structured Thin Films and Coatings, Vol.1. (Three-Volume Set),
Eds. S. Zhang, CRC Press, 2010, p.67 - 98.
Conference Presentations (Oral):
1. Amit Kumar and Kaiyang Zeng, “An alternative method to calculate the
hardness of thin films from nanoindentation data”, 4th International
conference on Technological Advances of Thin Films & Surface Coatings
(ThinFilms2008), Singapore, July 13-16, 2008.
2. Amit Kumar and Kaiyang Zeng, “Alternative Methods to extract the Hardness
and Elastic Modulus of Thin Films from Nanoindentation Load-Displacement
Data, International Conference on Materials For Advanced Technology
(ICMAT 2009), Symposium U: Mechanical Behavior of Micro- and Nano-
scale Systems, Singapore, July 1, 2009.
3. Amit Kumar and Kaiyang Zeng, “Coupling of electric, magnetic and
mechanical effects in multiferroic BiFeO
3
thin films”, The 6th International
Conference on Advanced Materials Processing (ICAMP), Lijiang, Yunnan,
China, July 22, 2010.
4. Amit Kumar, Herng Tun Seng, Jun Ding and Kaiyang Zeng, “Charge storage
possibilities in Zinc Oxide thin films studied by Scanning Probe Microscopy”,
International Workshop for SPM for Energy Applications 2011, Mainz,
Germany, 8 to 10 June 2011.
5. Amit Kumar and Kaiyang Zeng, “Effect on the Properties of Multiferroic
BiFeO3 Thin Film under the Mechanical Stress and Magnetic Field”,
International Conference on Materials for Advanced Technology (ICMAT
2011), Suntec, Singapore, 26 June 2011.
6. Amit Kumar, Meng Fei Wong, Herng Tun Seng, Jun Ding and Kaiyang Zeng,
“Ferromagnetic and ferroelectric properties of copper-doped zinc oxide
studied by Scanning Probe Microscopy Techniques”, International Conference
on Materials for Advanced Technology (ICMAT 2011), Suntec, Singapore, 26
June 2011.
iii
7. Amit Kumar, Meng Fei Wong, Tun Seng Herng, Kaiyang Zeng and Jun Ding,
”Magnetic and Surface Potential Behavior of Multiferroic Copper-doped ZnO
using Scanning Probe Microscopy Technique”, MRS Spring Meeting 2011,
San Francisco, USA, April 28, 2011.
iv
Acknowledgements
During this PhD research work, many people have supported me directly or
indirectly in performing experiments and thesis writing. Firstly, I would like to thank
my supervisor, Associate Professor Zeng Kaiyang, for his valuable guidance and
enough motivation throughout this research work.
I am also thankful to Dr. Wong Meng Fei and Dr. Herng Tun Seng for their
valuable discussion related to this research work. I would like to thank Ms. Ke Qing
Qing and Mr. Yan Feng for depositing thin film samples for my research work. I
would also like to express my appreciation to the staffs at Materials Lab: Mr. Thomas
Tan, Mr. Ng Hong Wei, Mr. Abdul Khalim Bin Abdul and Mr. Maung Aye Thein, for
their assistance in my experimental work inside the lab.
I would also like to thanks Prof. John Wang and Prof. Ding Jun at Department
of Material Science and Engineering NUS, for their valuable discussion during the
collaboration of the research works. I am thankful to all of the group members
especially, Mr. Chandra Rao for their friendly nature to me. I would also like to
thanks National University of Singapore and Department of Mechanical Engineering
for providing me research scholarship throughout my PhD work.
Lastly and most importantly, I am grateful to my wife and daughter for their
continuous support and motivation throughout this PhD work.
v
Table of Contents
Preface
i
Acknowledgements
iv
Table of Contents
v
Summary
x
List of Tables
xii
List of Figures
xiii
List of Symbols
xvii
Chapter 1: Introduction
1
1.1 Order parameters in Multiferroics 2
1.2 Single Phase Thin Film Multiferroic 3
1.2.1 Structure and multiferroic properties of BFO 5
1.2.2 Ferroelectric and antiferromagnetic domain imaging
in BFO thin films
6
1.3 Zinc Oxide as a new possible multifunctional material 9
1.4 Research Objectives and Significance 10
1.5 Thesis Outline 12
References 14
Chapter 2: Literature Review- Piezoresponse Force Microscopy
18
2.1 Working Principle of Piezoresponse Force Microscopy 18
2.1.1 Experimental Setup 18
2.2 Theory of PFM 21
2.2.1 Capacitive forces 23
2.2.2 Electromechanical Forces 25
2.3 Domain Switching at Nanoscale 28
vi
2.3.1 Thermodynamics of Domain Switching 28
2.3.2 Domain relaxation 32
References 35
Chapter 3: Literature Review-Kelvin Probe Force Microscopy
38
3.1 Kelvin Probe Force Microscopy 39
3.2 Detection in Kelvin Probe Force Microscopy 40
3.2.1 Amplitude-Modulation Detection 44
3.2.2 Frequency-Modulation Detection 45
References 48
Chapter 4: Materials and Experimental
51
4.1 Sample Description 51
4.2 Sample Characterization 52
4.2.1 Ferroelectric Domain imaging 53
4.2.2 Effective Piezoelectric constant (d
zz
)
measurement
54
4.2.3 Local Hysteresis loop measurement 55
4.2.4 Surface potential measurement 57
References 59
Chapter 5: Electric, Magnetic and Mechanical coupling effects on
BFO thin film
60
5.1 Introduction 60
5.2 Experimental 62
5.3 Results and Discussion 63
5.4 Conclusion 70
vii
References 73
Chapter 6: Effect of Mg doping on the Properties of Bi
0.9
La
0.1
FeO
3
thin films
74
6.1 Introduction 75
6.2 Materials and Experiments 75
6.3 Results and Discussion 76
6.3.1 PFM measurements (Ferroelectric domain, d
zz
,
Domain switching)
77
6.3.2 Polarization-fatigue and Polarization-retention 81
6.3.3 KPFM results (surface potential, before and after
dc bias application)
85
6.4 Conclusions 90
References 91
Chapter 7: Existence of ferroelectric-like behavior in copper doped
Zinc Oxide thin Films
94
7.1 Introduction 94
7.2 Materials and experiments 95
7.3 Results and Discussion 97
7.3.1 Ferroelectric-like polarization and its switching 97
7.3.2 Local Hysteresis and Strain loop 99
7.3.3 Time-dependent PFM studies 100
7.3.4 Possible Mechanism 103
7.4 Conclusions 103
References 105
Chapter 8: Charge storage capabilities in copper and cobalt
codoped zinc oxide thin films
107
viii
8.1 Introduction 107
8.2 Sample preparation 109
8.3 Results and Discussion 109
8.4 Conclusions 118
References 119
Chapter 9: Local ferroelectric behavior observed in pure zinc oxide
thin film
120
9.1 Introduction 120
9.2 Sample preparation and experiments 122
9.3 Results and discussion 124
9.3.1 Contact Engineering (Observation of Spontaneous
polarization)
124
9.3.2 Hysteresis loop (Confirmation of ferroelectric-
like behavior)
127
9.3.3 Surface charge effect on polarization 129
9.3.4 Film thickness effect on the local ferroelectric
behavior of ZnO
130
9.3.5 Effects of oxygen partial pressure during
deposition of thin films
133
9.3.6 Effects of deposition temperature on ferroelectric
behavior
135
9.3.7 Effects of applied voltage (writing and erasing of
domains)
136
9.4 Conclusions 138
References 140
Chapter 10: Conclusions and Recommendations
141
10.1 SPM study on BFO based materials 141
10.2 SPM study on ZnO based materials 143
ix
10.3 Recommendations for Future Works 146
10.3.1 BFO based materials 146
10.3.2 ZnO based materials 147
10.3.3 Mechanical properties of multiferroic thin films 147
Appendix
149
A:
Effect of magnetic field on BFO thin films 150
B: Effect of dc bias on KPFM measurement 151
x
Summary
This research work is focused on advanced characterization of multifunctional
thin film materials by using biased scanning probe microscopy techniques. The first
material which is characterized in this study is BFO, a well-studied multiferroic and
the other material is ZnO, one of the potential future materials for advanced electronic
applications. Scanning probe microscopy techniques, Piezoresponse Force
Microscopy (PFM) and Kelvin Probe Force Microscopy (KPFM) are used in this
work to characterize these materials for its multifunctional behavior. PFM technique
is used for the ferroelectric domain imaging and switching, and for dc biased writing.
However, KPFM is used to study the surface potential and charge transportation
behaviors.
Firstly, undoped BFO thin films were studied for the coupling effect of
mechanical stress and magnetic field on its electrical properties. The results indicate
that there is change in the ferroelectric domain and its switching behavior under the
coupling effects of mechanical stress and magnetic field. This study is very useful in
device designing and application if BFO is selected as a material. In addition the
effects of magnesium (Mg) doping on Bi
0.9
La
0.1
FeO
3
properties were also studied.
The domain switching results suggests that switching became easier after Mg doping.
It is also noticed that the Mg doping enhanced the information storage capabilities in
the Bi
0.9
La
0.1
FeO
3
thin films. KPFM study results revealed the presence and migration
of oxygen vacancy in the doped sample when electric field was applied.
Secondly, ZnO is studied for the effect of copper doping on its ferroelectric
properties. It is found that copper gives rise to the ferroelectric-like behavior
xi
observed in doped ZnO. Only positive bias could switch the polarization while there
is no effect of negative bias on polarization switching. A time-dependent study on
polarization relaxation process concluded that the switched polarization can last even
longer than 65 hrs. This study indicates that copper doped zinc oxide can be used for
future data-storage application, if the positive dc bias is used for writing the
information and negative to erase.
In another study on ZnO thin film, the charge storage possibility in Cu and Co
codoped ZnO thin films were characterized. The surface potential results under an
unbiased condition show that the contact between the conductive tip (Pt-coated) and
codoped ZnO surface has changed to Ohmic from the original Schottky contact in
undoped ZnO. Therefore, more quantity of charge (both positive and negative) can
store in the thin film sample. In addition, the codoped ZnO film has higher resistivity
compare to the single element doped ZnO, which basically give rise to the
polarization in the material. When the dc bias is applied on the sample surface, more
charge could store as polarization and injected charge rather than the surface charge.
This led to the long lasting stability of the bipolar charge in Cu and Co co-doped ZnO
thin film.
Finally, undoped ZnO thin films were investigated based on the contact
engineering. A ferroelectric-like behavior is observed under certain combination of
condition in ZnO. Some of the important conditions are: the top and bottom electrode
(Pt found best), oxygen partial pressure, film deposition temperature, film thickness
and the bias voltage. It is found that a 240 nm thick film, with Pt as bottom electrode,
deposited under medium partial pressure and fully crystalline structure shows
ferroelectric-like behavior. Therefore undoped ZnO also have some possibility for
information storage application.
xii
List of Tables
Table 4.1 Summary of the BFO based samples.
Table 4.2 Summary of ZnO based Samples.
Table 5.1 Mean strain amplitude (d
zz
) and Surface potential results for all the
samples under stress and magnetic field at location 1 and 2.
Table 6.1 Mean domain angle under the unbiased and biased area for undoped
and 2%Mg doped sample, together with the mean rotation angle.
Table 8.1 Measured work function values by UPS and contact potential
difference (CPD) by KPFM for different samples.
Table 9.1 Summary of the spontaneous polarization observed in some of the
classical ferroelectric materials and their source.
Table 9.2 Detailed descriptions of the film deposition parameters for different
samples.
xiii
List of Figures
Figure 1.1 (a) Schematic of the crystal structure of BFO and the ferroelectric
polarization (arrow) and antiferromagnetic plane (shaded planes). (b)
Ferroelectric polarization loops measured on epitaxial BFO films with
different crystallographic orientations.
Figure 1.2 In-plane PFM images of BFO ferroelectric domain structures on (a)
(001), (c) (110), and (e) (111) STO substrates. Schematics of BFO
polarization directions and corresponding IP-PFM contrast for (b) BFO
(001), (d) (110), and (f) (111).
Figure 1.3 OP- and IP-PFM images of (001) BFO/SRO/STO films (Figure 1.2a)
after switching with schematics showing the three possible switching
mechanisms.
Figure 2.1 PFM experimental setup for acquisition of topography and vertical &
lateral polarization components. A function generator is used to apply
an ac voltage V
ω
between the tip and the bottom electrode. The
voltage-induced cantilever deflection is detected by a reflected laser
beam on a four quadrant photodiode.
Figure 2.2 Local (a) and integral (b) methods of excitation in PFM.
Figure 2.3 Piezoelectric effects in ferroelectric perovskite investigated by PFM.
(a) Electric field aligned parallel to the spontaneous polarization leads
to a lifting of the cantilever due to the d
33
effect (out-of-plane signal).
It causes additional lateral contraction of the ferroelectric via the d
31
piezoelectric coefficient. (b) The antiparallel alignment of the electric
field and the spontaneous polarization leads to a vertical contraction
and a horizontal expansion of the ferroelectric. (c, d) Electric field
applied orthogonal to the polarization results in a shear movement due
to the d
15
coefficient. This movement causes a torsional deformation of
the cantilever forcing the laser spot to move horizontally (in-plane
signal). (e) A grain polarized in the x-z-plane will contribute to the in-
plane as well as to the out-of-plane signal.
Figure 2.4 (a) Domain geometry during tip-induced switching. (b) Free energy as
a function of the lateral domain size. Dashed line, in a uniform electric
field; solid line, in a tip-induced electric field.
Figure 2.5 Retention loss in PZT(20/80) film on LSCO/TiN/Si measured after
poling with 6 V applied for 0.2 s. (a) Topographic image with cross
indicating poling point, (b) as-grown domain structure, (c) domains
immediately after poling, and (d–f) evolution of domain structure after
4, 90, and 140 min after poling.
Figure 3.1 Basic principle setup of contact potential difference (CPD).
xiv
Figure 3.2 Schematic setup of an UHV-AFM with the main electronic
components for the AM-mode and FM-mode detection in KPFM.
Figure 3.3 Typical resonance spectra of a silicon cantilever with the first f
1
and
the second f
2
resonance. The quality factor is in the range of Q =
10,000. The drawings visualize the type of oscillation.
Figure 3.4 Restrictions in the FM mode: Dependence of the frequency shift
1
f∆
amplitude and the height control signal of the topography V
z
at the
frequency ω of the ac voltage. The measurements were obtained with a
silicon cantilever on a HOPG sample.
Figure 4.1 (a) Schematic diagrams of the experimental set-up and (b) principle of
the dual-frequency excitation based resonant-amplitude tracking.
Figure 4.2 (a) Probing wave form (b) data acquisition sequence. (c) Schematics of
a well-saturated electromechanical hysteresis loop. Forward and
reverse coercive voltages, V
+
and V
−
, nucleation voltages
c
V
+
and
c
V
−
,
and forward and reverse saturation and remnant responses,
0
R
+
,
0
R
−
,
s
R
+
and
s
R
−
, are shown. Also shown is the initial response
init
R
.
Figure 5.1 Iso-stress contours around a 45 N indentation. The dashed lines
indicate that the value is uncertain. The indents and cracks are marked
on the lower-left corner. (a) Residual tensile stress contour, (b) residual
compressive stress contour.
Figure 5.2 (a) PFM image of indentation, representing the crack and scan location
(b) Surface topography of as deposited BFO thin film, indicating the
grain size and shape (c) ferroelectric domain orientation of the as
deposited BFO thin film (d) ferroelectric domain orientation near the
indentation crack, also indicating the crack location.
Figure 5.3 Hysteresis response of ferroelectric domain for (a) as deposited BFO
thin film, (b) 1.96 N indentation load near the crack (c) 1.96 N
indentation load and 3200 G magnetic field near the crack. Also
showing (Inset images) the phase change at different point on the loop.
Figure 6.1 PFM measurement results of topography, amplitude and phase for (a)
undoped and (b) 4% Mg doped BLFO samples (1µm scan size).
Figure 6.2 Local hysteresis loop for domain switching and corresponding strain
loop for (a) undoped BLFO and (b) 2% Mg + BLFO samples.
Figure 6.3 Represents the ferroelectric domain response, after each writing step
up to 3 times for (a) pure and (b) 2% Mg doped BLFO sample. Scan
size is 5x5 µm
2
and the writing size is 2x2 µm
2
.
Figure 6.4 Time dependent polarization response for (a) undoped BLFO and (b)
2% Mg doped BLFO, just after the poling and after 17 hrs of it.
xv
Figure 6.5 Schematic energy band diagram for different samples based on the
KPFM measurement.
Figure 6.6 Surface potential images after bias application at the center (within
square region) for (a) undoped BLFO (b) 2% Mg doped BLFO and (c)
4% Mg doped BLFO. The arrow shows the location of data collection
used to plot for comparison in Figure 6.7.
Figure 6.7 Plot between the surface potential changes and applied bias voltage for
all three samples. (Data collected at the arrow location in Figure 6.6).
Figure 6.8 PFM phase images of the 2% Mg doped sample before and after dc
bias application. Polarization switching is only observed in the positive
biased region while the negative biased region shows no change.
Figure 7.1 Initial PFM response of amplitude and phase for (a) 2% Cu doped and
(b) 8% Cu doped ZnO sample.
Figure 7.2 PFM amplitude and phase response for 2% Cu doped (a), (b) just after
writing with +10 V & (c), (d) just after erasing with -10 V and for 8%
Cu doped (e), (f) just after writing with +10 V & (g), (h) just after
erase with -10 V. Scan size is 10x10 µm
2
and bias was applied on 5x5
µm
2
(square).
Figure 7.3 Hysteresis and strain loop for the 2% Cu doped ZnO sample.
Figure 7.4 Time-dependent polarization results for the 8% Cu doped sample (a)
before poling, (b) just after poling and (c) after 19 hrs of poling.
Positive (+10 V) voltage was applied in 5x5 µm
2
area (green square)
and negative (-10 V) bias was applied in 2x2 µm
2
area (red square).
Figure 7.5 Time-dependent polarization results for 2% Cu doped sample (a)
before poling, (b) just after poling and (c) after 19 hrs of poling.
Positive (+10 V) voltage was applied in 5x5 µm
2
area (green square).
Figure 7.6 Phase image for 8% Cu doped sample (a) before, (b) just after, (c) after
25 hrs and (d) after 65 hrs of positive (+10 V) bias application.
Figure 8.1 XRD Intensity vs 2θ Plot for various concentration of copper and
cobalt in ZnO samples. The best peak combination is found for 8%
copper and 9% cobalt concentration in ZnO.
Figure 8.2 Surface potential images of (a) immediately after; (b) 1 hr; (c) 2 hrs;
and (d) 20 hrs after the bias applied to the region on the surface of
ZnO:Cu:Co sample. The red arrow represents the location and
direction of data collection for the comparison.
Figure 8.3 The UPS results for Pt, ZnO, ZnO:Cu, ZnO:Co and ZnO:Cu:Co film.
Figure 8.4 Schematic diagram of flat band structure, also representing the location
of Fermi level for different samples.
xvi
Figure 8.5 The changes of the surface potential values of immediately, 1 hr, 2 hrs
and 20 hrs after the dc biases applied (measured at the arrow location
in Figure 8.2) for: (a) undoped ZnO, (b) ZnO:Co, (c) ZnO:Cu and (d)
ZnO:Cu:Co respectivily. The positive and negative biases and there
locations are also indicated.
Figure 8.6 The surface potential image of (a) immediately after, (b) after 1
st
ground tip scan and (c) after 2
nd
ground tip scan for the ZnO:Cu:Co
sample; and (d) the changes of the surface potential values
immediately after, after 1
st
and 2
nd
ground tip scan measured at the red
arrow location.
Figure 9.1 PFM phase image in unbiased and biased condition for the ZnO
sample with (a) Pt, (b) Au and (c) ITO as bottom electrode, when
scanned with a Pt-coated tip. Scan size is 10x10 µm
2
and bias was
applied on the central 5x5 µm
2
area.
Figure 9.2 PFM phase image of ZnO film in unbiased and biased condition when
Au-coated tip as top electrode and Au is also used as bottom electrode
Scan size is 10x10 µm
2
and bias was applied on 5x5 µm
2
.
Figure 9.3 Hysteresis and amplitude loop measured at two locations (Inset is the
PFM phase image showing the phase change during switching) in a
ZnO sample with Pt as bottom electrode.
Figure 9.4 Hysteresis and amplitude loop response of ZnO thin film sample after
(a) 300 cycles and (b) 50 loops at a time.
Figure 9.5 PFM phase response (a) before, and (b) after the dc bias application
when the surface charge is removed using static charge remover.
Figure 9.6 PFM phase image for the different thickness ZnO samples after the
positive dc bias application. Scan size is 10x10 µm
2
and bias was
applied on the central 5x5 µm
2
area.
Figure 9.7 Time dependent polarization results for 240nm thick film (a) just after,
(b) after 20 hrs, (c) after 50 hrs and for 70nm thick film (d) just after,
(e) after 20 hrs of dc bias application. Scan size is 10x10 µm
2
and bias
was applied on 5x5 µm
2
.
Figure 9.8 Effect of oxygen partial pressure on the time polarization of 240nm
thick films just after and after 1 hr of dc writing for low pressure (a) &
(b), medium pressure (c) & (d) and high pressure (e) & (f). Scan size is
10x10 µm
2
and bias was applied on the central area of 5x5 µm
2
.
Figure 9.9 Topographic image of samples deposited at different temperatures, is
showing the difference in grain size.
Figure 9.10 (a) Representing the biased voltage effect on polarization switching
behavior, (b) switching by +6 V dc bias, (c) switching by -2 V dc bias
and (d) again re-switching by +6 V dc bias. Scan size is 10x10 µm
2
and bias was applied on 5x5 µm
2
.
xvii
List of Symbols
A
1
, A
2
, A
1
’, A
2
’ Amplitudes caused by the shift in contact resonance frequency
during the detection of piezoresponse signal
A
piezo
Electromechanical response
A
cap
Electrostatic response
A
nl
Non-local electrostatic force response
a, c Lattice parameter
C
canti
Capacitance of cantilever
C
tip
Capacitance of tip
d
zz
Effective piezoelectric constant
d
33
Longitudinal piezoelectric constant
eV
m
Work function of the metal tip
eV
s
Work function of the sample surface
E
a
Activation energy
E
c
Coercive electric field
E
F
Fermi energy level
E’ Electric field
F Electrostatic force on the cantilever tip
f Frequency
G Free energy
I Current intensity
K
T
Dielectric constant
k
33
Longitudinal electromechanical coupling factor
M
333
Electrostrictive constants
P Indentation load/force
xviii
P
r
Remnant polarization
P
S
Spontaneous polarization
P’ Polarization
q Elementary charge
Q
s
Semiconductor surface charge
S Harmonic contact stiffness of the material
t Time
V Applied voltage
V
ac
ac voltage
V
dc
dc offset
V
sp
Surface potential between the tip and the sample
V
CPD
Contact potential difference
z Tip-sample separation distance
θ
Incident angle in X-ray diffraction
τ
c
Critical shear stress to cause domain switching
ω
Drive frequency of the ac voltage
1
Chapter 1: Introduction
In the modern technology, magnetic and electronic materials are frequently
being used for most of the engineering and functional devices. For example,
ferromagnetic materials, which show a spontaneous magnetic polarization, are being
used to store a vast amount of information data generated by various processes. This
polarization can be reversed by an application of magnetic field. Similarly,
ferroelectric materials, which exhibit spontaneous electric polarization, are being used
in many sensors and actuator devices. This electric polarization can be switched by an
electric field. In addition, ferroelastic materials, which exhibit strain under an electric
field, are being used in many actuators and detectors devices. These materials can
generate voltage when subjected to the strain.
The materials, which show coupling between two or more of these properties
in a single phase, are known as multiferroics [1]. In multiferroics, the materials, which
show magnetism and ferroelectricity in a single phase, are known as magnetoelectric
multiferroic. Such materials can be used to control electrical properties by a magnetic
field or the magnetic spin by an applied electric field. Therefore, these materials are
suitable for a new kind of multifunctional device. The earlier efforts to form a
multiferroic were mainly focused on having both ferroelectricity and magnetism in a
single material [2]. Which later found difficult, because the driving mechanisms for
ferromagnetism and ferroelectricity are mutually exclusive on the atomic level [1, 3-
6]? The first one needs empty and the other one needs partially filled orbital in the
transition metal ion of the material respectively [4]. It was also observed that the
presence of both ferroelectric and ferromagnetic dipoles does not guarantee strong
coupling between the two. The microscopic mechanisms of these phenomena are very
Chapter 1
2
different and do not strongly interfere with each other [7, 8]. Recent advancement in
thin film growth techniques and experimental methods for observing magnetic and
electric domain, have accelerated the research interest in this area and provided the
opportunities for the development of new multiferroic materials [9].
1.1 Order parameters in Multiferroics
To understand the structure and properties of multiferroic material, it is better
to understand why it is difficult to observe both ferroelectricity and magnetism in a
single phase material [4, 6, 10]. Generally-speaking, ferroelectrics are transition metal
oxide having an empty d shell of transition ion. The positively charged ion tends to
form molecules with one or more negatively charged oxygen ion at the neighboring
positions. This collective shifting of cations and anions inside a periodic crystal
induces the bulk polarization. The mechanisms of the covalent bonding or electron
pairing in such molecules are the virtual hopping of the electrons from the filled
oxygen shell to the empty d shell of a transition metal ion.
Whereas, for the magnetism the d shell of the transition ion should be partially
filled, because the spin of electrons in a completely filled shell result in net zero
charge and do not produce any magnetic ordering in the material. The uncompensated
spins of different transition metal ions produce a long range magnetic order. Thus, in
such way the two mechanisms are not completely different to produce ferroelectricity
and magnetism, but in the way of filling d shells. This makes these two orders
mutually exclusive. Certain compounds, such as BiMnO
3
and BiFeO
3
show
ferroelectricity with Mn
3+
and Fe
3+
as magnetic ions. However, ferroelectricity is due
to the Bi ion with two electrons in the 6s orbital, which moves away from the
centrosymmetric position in its oxygen surrounding [11]. As the ferroelectric and
magnetic orders in these materials are associated with different ions, so the coupling
Chapter 1
3
between them is generally weak. BiMnO
3
is a unique material which shows both
ferroelectric polarization and magnetization in reasonably large order [8, 12, 13];
even then only 0.6% change in dielectric constant value was observed, when 9 T
magnetic field was applied at ferromagnetic transition temperature (~ 110 K).
1.2 Single Phase Thin Film Multiferroic
The development of thin films growth techniques created the great interest in
multiferroics due to the production of non-equilibrium phases and strain engineering
in the existing materials [14]. Thin film's structures gave a new direction to discover
and stabilize the number of new multiferroic materials in conjunction with the
availability of high quality materials which can be produced in larger lateral size
compared to the samples in single crystal form. In general, sputtering, spin coating,
pulsed laser deposition (PLD), sol-gel processes, metal-organic chemical vapor
deposition (MOCVD), molecular beam epitaxy (MBE) are the common techniques
for thin film sample deposition, which are also being used for multiferroic thin films.
Only a few classes of multiferroic materials, such as hexagonal manganites,
Bi-based and Pb-based perovskites have been prepared as single phase thin films. The
first multiferroic investigated was the hexagonal manganite YMnO
3
, because of its
geometric ferroelectricity leads to a uniaxial polarization perpendicular to the plane of
the film [15]. Primarily, RF magnetron sputtering is used to form epitaxial films such
as MnO
3
on (111) MgO, (0001) ZnO on (0001) sapphire and various polycrystalline
films on (111) Pt/ (111) MgO. Later, it is also found that the metastable non-
ferroelectric cubic perovskite structure can be stabilized in thin film by using
appropriate deposition and annealing conditions, and the substrates [16]. Therefore,
YMnO
3
films have been grown on various substrates using different deposition
techniques [17-24]. Although, the thin film’s properties are qualitatively similar to
Chapter 1
4
those in the bulk form, but a reduction in ferroelectric polarizations and dielectric
response is observed compared with those in the single-crystal materials.
Another type of multiferroic is Bi-based perovskite BiFeO
3
(BFO), which is
the most widely studied, single-component multiferroic material because of its large
polarization and high Curie temperature (~ 1103 K). BFO is generally suitable for the
applications in ferroelectric non-volatile memories and high temperature applications
[25]. Thin films grown by a variety of techniques [26-30] show the large values of
polarization compare to that in the bulk sample, which converges to the ~ 90 µC cm
-2
along the [111] direction of the pseudo-cubic perovskite unit cell. This polarization
value is consistent with the value given by first principle calculations [31].
The magnetic properties of BFO thin films are also different than its bulk
properties. Bulk BFO has been known for its antiferromagnetic property with Neel’s
temperature of T
N
≈ 643 K [32]. The Fe magnetic moments are coupled
ferromagnetically within the pseudo-cubic (111) planes and antiferromagnetically
between adjacent planes. If the magnetic moment is oriented perpendicular to the
[111] direction, as predicted by the first principle calculations [33], the symmetry
permits a canting of the antiferromagnetic sub-lattices resulting in the macroscopic
magnetization or weak magnetization [34, 35]. However, a spiral spin structure is
superimposed on antiferromagnetic ordering, in which the antiferromagnetic axis
rotates through the crystal with an incommensurate long-wavelength period of ~ 620
Å [36]. This spiral spin structure leads to a cancellation of any macroscopic
magnetization and inhibits the observation of the linear magnetoelectric effect [37].
However, significant magnetization (~ 0.5 µ
B
per unit cell) and a strong
magnetoelectric coupling have been observed in epitaxial thin films, [26] and this
suggested that the spiral spin structure was suppressed [38].
Chapter 1
5
1.2.1 Structure and multiferroic properties of BFO
The BFO structure is characterized by two distorted perovskite unit cell
(Figure 1.1a) connected along their body diagonal to form a rhombohedral unit cell,
denoted by a pseudocubic <111> [39, 40]. The ferroelectric state is realized by a
large displacement of the Bi ions relative to the FeO
6
octahedra.
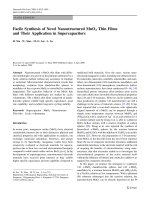
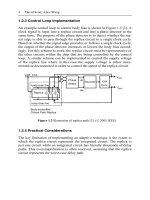
Figure 1.1 (a) Schematic of the crystal structure of BFO and the ferroelectric
polarization (arrow) and antiferromagnetic plane (shaded planes). (b) Ferroelectric
polarization loops measured on epitaxial BFO films with different crystallographic
orientations [61].
This arrangement results in two important considerations. First, the
ferroelectric polarization is along the pseudocubic <111> directions, which leads to
the formation of eight polarization variants; out of eight, four are the structural variant
[40-43]. Second, the antiferromagnetic ordering in BFO is G-type, in which the Fe
magnetic moment is aligned ferromagnetically within (111) plane and
antiferromagnetically between the adjacent (111) plane. In addition, bulk BFO is
known to exhibit a spin cycloid structure [36]. The preferred orientation of the
antiferromagnetically aligned spins is (111) plane, which is perpendicular to the
ferroelectric polarization direction with six equivalent easy axes within that plane
[33]. Thus, antiferromagnetism is coupled to the ferroelectric polarization in BFO.