An investigation into the head disk interface technology leading to extremely small mechanical head disk spacing
Bạn đang xem bản rút gọn của tài liệu. Xem và tải ngay bản đầy đủ của tài liệu tại đây (8.36 MB, 229 trang )
AN INVESTIGATION INTO THE
HEAD-DISK INTERFACE TECHNOLOGY
LEADING TO EXTREMELY SMALL
MECHANICAL HEAD-DISK SPACING
MAN YIJUN
NATIONAL UNIVERSITY OF SINGAPORE
2013
AN INVESTIGATION INTO THE
HEAD-DISK INTERFACE TECHNOLOGY
LEADING TO EXTREMELY SMALL
MECHANICAL HEAD-DISK SPACING
MAN YIJUN
(B. Eng., USTB; M. Eng., NUS)
A THESIS SUBMITTED
FOR THE DEGREE OF DOCTOR OF PHILOSOPHY
DEPARTMENT OF MECHANICAL ENGINEERING
NATIONAL UNIVERSITY OF SINGAPORE
2013
i
DECLARATION
I hereby declare that this thesis is my original work and it has been written by me in its
entirety. I have duly acknowledged all the sources of information which have been
used in the thesis.
This thesis has also not been submitted for any degree in any university previously.
_________________________
Man Yijun
12 July 2013
ii
Acknowledgements
I would like to express my sincere gratitude to my research supervisor in
National University of Singapore, Professor Lim Seh Chun, for his valuable advice and
guidance, encouragement and support throughout the course of this research. He
provides me timely guidance in spite of his busy schedules and spends a large amount
of time reviewing my papers and dissertation. Working with Professor Lim has been
an invaluable and honorable experience from which I will benefit. I am greatly
indebted to my co-supervisor Associate Professor Liu Bo, who has been very
important in working out my research path and for navigating me through every stage
of my career since I joined his group in Data Storage Institute. His insight, knowledge
and guidance are extremely helpful to me throughout my PhD study. I would also like
to thank Associate Professor Sujeet Kumar Sinha, previously of National University of
Singapore and currently of Indian Institute of Technology Kanpur, for the kind support,
advice and encouragement of helping me completing my study.
I owe my gratitude to all the people who have helped me in various aspects of
this research while working in Data Storage Institute, in particular Dr Ma Yansheng, Dr
Yu Shengkai, Dr Yuan Zhimin, Dr Zhang Mingsheng, Mr Ng Kang Kee for their
invaluable discussion, professional advice and support. Special thanks are also given to
Dr Hu Jiangfeng, Associate Professor Chen Jingsheng and Dr Shi Jianzhong for their
encouragement and assistance throughout my PhD study.
Finally, I am deeply indebted to my parents, my brother and my parents-in-law
for their support and encouragement, and most of all, my wife, Jiarui, and my son, Jun
Cheng for their constant love, patience, and understanding. Without their supports, the
dissertation would not have been completed.
iii
Table of Contents
Declaration
i
Acknowledgements
ii
Table of Contents
iii
Summary
viii
List of Tables
x
List of Figures
xi
List of Abbreviations
xviii
Chapter 1
Introduction
1
1.1 Evolution of Hard Disk Drives (HDDs)
1
1.2 Areal Density of Magnetic Recording Hard Disk
4
1.3 HDD Components
5
1.4 The Read/Write Process
7
1.5 The Head-Disk Interface (HDI)
11
1.6 Motivation
13
1.7 Objective
14
1.8 Structure of the Thesis
15
Chapter 2
Literature Review
17
2.1 Introduction
17
2.2 Flying Height (FH) Adjustment Technologies
18
2.2.1 Different Approaches
19
2.2.2 Thermal Flying Height Control (TFC) Technology
22
2.3 Lubricants
25
2.4 Contact Recording
28
2.4.1 Important Slider Designs Related to Contact
Recording
29
iv
2.4.2 Slider-Disk Contact Detection Technologies
29
2.4.2.1 Acoustic emission (AE) sensor technology
30
2.4.2.2 Piezoelectric transducer (PZT) sensor
technology
30
2.4.2.3 Thermal asperity (TA) technology
31
2.4.2.4 Laser Doppler Vibrometer (LDV) technology
31
2.4.2.5 Read signal technology
33
2.4.3 Short Range Forces and Slider-Lubricant Interaction
33
2.5 Lube-Surfing Recording
37
2.5.1 Introduction
37
2.5.2 The Challenges and Approaches for Lube-Surfing
Recording
40
2.6 Current and Future Technologies for Magnetic Recording
43
2.6.1 Perpendicular Magnetic Recording (PMR)
43
2.6.2 Bit Patterned Media Recording (BPMR)
44
2.6.3 Heat Assisted Magnetic Recording (HAMR)
45
2.7 Tribocharging and Tribo-Current
48
Chapter 3
Materials and Experimental Methodologies
56
3.1 Sliders and Disks for the Experimental Investigations
56
3.1.1 Sliders
56
3.1.1.1 Panda sliders – the non-TFC sliders
57
3.1.1.2 Pemto TFC sliders
60
3.1.2 Hard Disk Media
60
3.2 Methodologies for Slider-Disk Interaction Measurement
62
3.2.1 Acoustic Emission (AE) Testing
62
3.2.2 Laser Doppler Vibrometer (LDV) Measurement
64
3.2.3 The Triple Harmonic Method
67
3.3 Surface Analysis Techniques
72
3.3.1 Conductive Atomic Force Microscopy (C-AFM)
72
3.3.2 Optical Surface Analyzer (OSA)
73
3.4 Experimental Setup
75
v
3.4.1 Optical Surface Analyzer (OSA) Based Setup
75
3.4.2 Spin Stand Based Setup
76
Chapter 4
A Study of Slider–Lubricant Interactions with Different
Slider Designs
78
4.1 Introduction
78
4.2 Experiments
78
4.2.1 Experimental Setup
78
4.2.2 Test Sliders
79
4.2.3 Test Disks
80
4.2.4 Calibration of Slider’s Flying Height
80
4.3 Results and Discussions
84
4.4 Summary
92
Chapter 5
Study of Slider–Lubricant Interaction with Conductive
Atomic Force Microscopy
93
5.1 Introduction
93
5.2 Experiments
94
5.2.1 Experimental Studies Using the C-AFM
94
5.2.1.1 Experimental setup
94
5.2.1.2 Sample preparations
95
5.2.1.3 Experimental studies
96
5.2.1.4 Data acquisition
97
5.2.2 Experimental Studies Using a Modified OSA
100
5.2.2.1 Experimental setup
100
5.2.2.2 Experimental conditions
101
5.2.2.3 Experimental studies
101
5.3 Results and Discussions
101
5.4 Summary
109
Chapter 6
Study of Slider-Lubricant Interaction with Tribo-Current
111
6.1 Introduction
111
6.2 Experiments
112
6.2.1 Experimental Setup
112
vi
6.2.2 Methods of Data Acquisition and Analysis
114
6.3 Results and Discussions
117
6.4 Summary
120
Chapter 7
Parametric Studies of Thermal Flying Height Control
Sliders for the Investigation of Slider-Lubricant
Interactions in Contact Proximity Regime with Electrical
Current
122
7.1 Introduction
122
7.2 Experimental Procedures
124
7.3 Results and Discussions
126
7.3.1 Calibration of TFC Heating Power with Respect to
Variable Heater Resistance
126
7.3.2 Measuring TFC Thermal Actuation Efficiency with
Triple Harmonic Method
130
7.3.3 Simulating the Slider FH Modulation at Close
Proximity with Sinusoidal Function TFC Driving
Voltage
132
7.3.4 Sensitivity of Electrical Current Method Used as a
Contact Detector
136
7.4 Summary
144
Chapter 8
The Applications of Electrical Current as a Contact
Detector for the Investigation of Slider-Lubricant Contact
146
8.1 Introduction
146
8.2 Experimental Setup
149
8.3 Results and Discussions
151
8.3.1 Effect of Disk RPM
151
8.3.2 Effect of Mobile Lubricant
153
8.3.3 Investigations of the Second Stable Flying State with
Electrical Current
157
8.3.4 Estimation of the Possible Region of Stable Surfing
State for a Specific TFC Slider
163
8.3.5 Understanding of the Touchdown/Lubricant-
Contact/Takeoff Processes for the Specific TFC
Slider with the Electrical Current Method
169
8.4 Summary
173
vii
Chapter 9
Conclusions
176
References
180
List of Publications
207
viii
Summary
In order to keep increasing the recording density in magnetic hard disk drives,
it is necessary to reduce the physical clearance between the read/write head and disk.
State-of-the-art slider’s flying height is approaching 3.5 nm in order to achieve 1
Tbits/in
2
areal density while the disk-to-slider lubricant transfer, enhanced by the
slider-lubricant interactions within such a small spacing, may lead to lubricant pickup
by the slider which can affect the head-disk interface (HDI) stability. The
investigations of lubricant transfer by the sliders with different designs show that
lubricant transfer is not dependent on the air-bearing pressure but the effective size at
the slider’s central trailing pad. Slider design with multi-shallow step and a smaller
central trailing pad not only achieves a higher air-bearing stiffness but also reduces the
redistribution of lubricant.
The physical clearance would be further reduced to sub-nanometer in order to
achieve 510 Tbits/in
2
areal density. This will result in the inevitable intermittent
contact between the slider and the lubricant/disk and require a significant change in the
HDI. Thermal flying height control (TFC) technology has successfully brought the
slider to fly at an ultra-low spacing, realizing sub-nanometer clearances for specific
read/write operations. Based on the TFC technology, lube-surfing recording has been
proposed and this may impose a tighter magnetic spacing while sustaining a stable
HDI. The electrical/tribo-current generated by the slider-lubricant contact during lube-
surfing may be used to detect slider-lubricant contact.
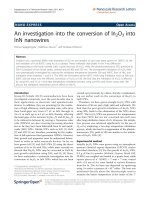
The conductive atomic force microscopy is applied to simulate the interactions
at HDI while the currents generated during the probe-sample contact are investigated.
The critical points, which divide the interactions into non-contact, lubricant-contact
ix
and solid-contact regions, can be observed. Subsequently, the current generated during
TFC slider-disk contact is investigated experimentally. The results show that non-
contact, lubricant-contact and solid-contact regions can be differentiated by the
measured currents. Furthermore, the characterizations of those well-investigated
effects on the slider-lubricant contact further validate the usefulness of proposed
current method in detecting lubricant-contact.
The in-depth investigations of lubricant-contact by the electrical current
method with a modulated driving voltage applying to the specific TFC slider are
performed. The results suggested that the driving voltage not only produces a localized
protrusion but also dissipates electrical charges to the slider body. The slider is
capacitively coupled with the disk via the TFC heating element. The capacitive current
thus produced dominates the measured current during non-contact, and it mixes with
tribo-current generated during lubricant-contact.
After careful calibrations of the TFC power with respect to the input voltage
and the thermal actuation efficiency, the lube-surfing state during touchdown-takeoff
processes is studied. The proposed current method has a sensitivity which is
comparable to that of the LDV method and it can be used to estimate the touchdown
power and the possible region of stable surfing state. The measured current may be
used not only to accurately detect lubricant-contact but also as a feedback signal for
the fine tuning of slider’s flying status if the electrical charge can be accurately
controlled by further modification of the TFC slider.
x
List of Tables
Table 3.1
Parameters of Panda series sliders.
57
Table 4.1
Parameters of slider’s central trailing pad.
79
Table 4.2
Critical RPM of the slider flying over 3.5 nm at the radius
of 1.2 inch.
83
Table 4.3
Quantitative comparisons of lubricant transfer by different
sliders.
91
Table 5.1
Critical points and applied voltage within lubricant
region.
104
Table 5.2
The currents measured within different regions.
108
Table 6.1
The critical points and tribo-currents for each test (:
standard deviation).
119
Table 8.1
Estimations of the maximum depth of TFC protrusion
penetrating into the lubricant during stable surfing state
with respect to different DC input voltages (thermal
actuation efficiency: 0.029 nm/mW).
168
xi
List of Figures
Figure 1.1
IBM RAMAC 305 computer system.
1
Figure 1.2
Close-up of IBM RAMAC 350 magnetic hard disk drive.
2
Figure 1.3
Evolution of areal density. CGR = compound growth rate.
5
Figure 1.4
Structure and components within a hard disk drive.
6
Figure 1.5
Schematic principle of magnetic recording.
7
Figure 1.6
Merged magnetic read/write head in which the second
magnetic shield also functions as one pole of the inductive
write head.
9
Figure 1.7
Schematic diagram of a GMR head structure.
10
Figure 1.8
Schematic view of the head-disk interface.
11
Figure 2.1
Cross-section and schematic of TFC head structure.
24
Figure 2.2
Lubricant thickness vs. pull-rate for Z-Dol (MW 4000)
with concentration of 0.1 wt%.
26
Figure 2.3
Schematic illustration of the targeted lube-surfing recording
scheme.
39
Figure 2.4
Schematic diagram of PMR.
43
Figure 2.5
Schematic diagram of DTR and BPMR.
44
Figure 2.6
Schematic diagram of HAMR.
46
Figure 2.7
Possible future technology transition paths.
47
Figure 3.1
The evolution of slider/air-bearing surface.
56
Figure 3.2
Three types of Panda sliders.
57
Figure 3.3
Force plot of three types of low flying height sliders (pitch
fixed at 115 rad). Panda IV slider is of large air-bearing
force and small intermolecular force (compared to Panda
III slider). The full air-bearing domination of Panda IV
slider can be extended to 0.4 nm minimum FH.
59
Figure 3.4
The pemto TFC slider.
60
Figure 3.5
Principle of acoustic emission measurement.
62
xii
Figure 3.6
PICO HF-1.2 AE sensor.
63
Figure 3.7
Basic components of a laser Doppler vibrometer.
65
Figure 3.8
Polytec OFV-534 LDV operated on the modular OFV-5000
vibrometer controller.
66
Figure 3.9
Spectrum power of the harmonics for the data pattern of (a)
all “1” pattern and (b) “111100” pattern.
71
Figure 3.10
Schematic diagram of conductive AFM.
72
Figure 3.11
DI3100 SPM system (left) and C-AFM sensor (right).
73
Figure 3.12
Optical layout of the optical surface analyzer.
74
Figure 3.13
Candela 5100 OSA integrated with a VENA CSS-L/UL
system.
76
Figure 3.14
Spin stand based experimental setup.
77
Figure 4.1
Experimental setup.
79
Figure 4.2
Dimension, air-bearing layout and image of Panda II (a),
Panda III (b) and Panda IV (c).
80
Figure 4.3
The OSA image of the disk with lubricant step. About half
of the disk surface is rinsed in the solvent to remove the
mobile lubricant and only bonded lubricant is left. The
bright area is with thinner lubricant or bonded lubricant
only while the dark area is with thicker or mobile together
with bonded lubricant.
81
Figure 4.4
The OSA image of MMC bump disk with bump height of
0.137 in or 3.5 nm. The laser bump region is located at the
radius of around 1.2 inch. The typical laser bump is
measured using AFM and is shown in the inlet.
81
Figure 4.5
Numerical study of the minimum FH of Panda IV at the
different RPMs. The speed corresponding to the minimum
FH of 3.5 nm is estimated to be 14,000 RPM.
82
Figure 4.6
Spindle motor profile and slider touchdown test. It is
observed that the contact happened at 5.99 seconds, or 0.99
seconds after the speed of spindle motor is reduced from
15,000 RPM. Therefore, the avalanche point or the RPM
corresponding to the first contact could be calculated as
14,010.
83
Figure 4.7
OSA image of the testing region after 6 minutes track
flying by Panda III slider.
84
xiii
Figure 4.8
Average lubricant distributions in radial direction of (a)
free lubricant region and (b) bonded lubricant region.
85
Figure 4.9
Schematic diagram of lubricant region under the flying
slider.
86
Figure 4.10
The relative amount of lubricant (a) removed from the disk
surface with thick lubricant, (b) transferred onto the disk
surface with thin lubricant and (c) transferred to slider by
Panda II, Panda III and Panda IV sliders.
87
Figure 4.11
The effects of maximum air-bearing pressure (P) and area
(A) of slider’s central trailing pad on the amount of
lubricant transferred.
88
Figure 4.12
A simplified model of lubricant transfer in the head-disk
interface (a), and geometry of head-disk interface when the
pitch angle is counted (b).
89
Figure 5.1
Optical surface analyzer (OSA) images of disk 1 and disk
2, which are specially prepared by dip-coating of Z-Dol
4000 on the two different parts of each disk with different
thicknesses, respectively.
94
Figure 5.2
The correlation between lubricant thickness and withdrawal
speed by which the thickness of the lubricant specially dip-
coated on the different areas of disk 1 and 2 can be
estimated.
95
Figure 5.3
The experimental procedures. From left to right, the
conductive probe is firstly engaged on the sample disk
under the setpoint of 0.5 V. The voltage thereafter is
increased to 1 V immediately after the engagement of the
probe. Then the voltage is gradually reduced with a step of
0.1 V which leads to the separation of the probe from disk,
the scanning in the lubricant and the separation of the probe
from the lubricant in the final.
96
Figure 5.4
Typical topography (a) and current distribution (b) images
of a lubricated disk simultaneously measured on the same
area of 1 × 1 µm
2
with C-AFM.
97
Figure 5.5
(a) Typical images measured at the status of solid-contact
and lubricant-contact, and (b) typical images at the moment
the probe nearly separating with the lubricant and then
scanning with non-contact.
98
Figure 5.6
Schematic diagram of the current as a function of applied
voltage/force at the status of solid-contact, lubricant-contact
and non-contact.
99
xiv
Figure 5.7
The modified OSA which is a commercial Candela 5100
with a VENA load/unload system attached (a), and the
schematic diagram of the experimental setup (b).
100
Figure 5.8
The measured current as a function of the applied voltage
or force in the regions with different lubricant thicknesses.
The 1
st
critical points can be observed from (a), below
which the conductive probe is separated from the solid disk
and scans in the lubricant. Moreover, the 2
nd
critical points
can be observed as well from (b), which is the zoom-in
portion of (a).
102
Figure 5.9
The correlation between lubricant thickness and applied
voltage, by which the voltage can be converted into force.
104
Figure 5.10
Touchdown and takeoff tests conducted with C-AFM.
105
Figure 5.11
Schematic diagram of the lubricant menisci formed around
probe during takeoff process.
106
Figure 5.12
Experimental results (a) and their corresponding OSA
images (b).
107
Figure 5.13
Touchdown and takeoff tests conducted with a TFC slider
on the modified OSA. It needs to note that the FH of this
TFC slider is not controlled by TFC but the rotating speed
of the spindle or the linear velocity of the flying slider.
109
Figure 6.1
Schematic diagrams of a rapidly-moving TFC slider body
at the flying status of non-contact, lubricant-contact and
solid-contact, respectively.
112
Figure 6.2
Photograph (a) and schematic (b) of the experimental setup
for tribo-current measurements. The slider mount is
electrically isolated from the rest of the system.
113
Figure 6.3
A typical result of the tests. The tribo-current increases
sequentially with the increase of TFC driving voltages from
2.2 to 3.0 V. The flying time of the TFC slider
corresponding to each voltage or position of the TFC
protrusion is about 510 s. It can be observed that the tribo-
current at each position of the TFC protrusion is rather
stable and its value is independent of the flying time.
115
Figure 6.4
A sudden transition of the tribo-current can be observed
when the TFC driving voltage is increased to ~3.9 V, by
which the lube-contact can be differentiated clearly from
the solid-contact.
115
Figure 6.5
OSA images of 2.5-in disk and zoom-in image of the flying
track immediately after sudden transition. Scratches can be
observed around flying track.
116
xv
Figure 6.6
The result of all tests by which the critical points for
differentiating the lubricant-contact from the solid-contact
can be observed obviously. The inset embedded is the
magnified current curve of the Test 3, corresponding to the
driving voltage from 0 to 0.1 V in the logarithmic scale.
117
Figure 6.7
An obvious transition can be observed when the driving
voltage is applied to 1 V after slider achieves a stable flying
status. The test is repeated several times and the driving
voltages corresponding to the critical point is estimated to
be around 0.10.5 V.
119
Figure 7.1
Photograph (a) and schematic diagram (b) of the
experimental setup for electrical current measurements. The
slider mount is electrically isolated from the rest of the
system.
125
Figure 7.2
Schematic circuit diagram of input voltage (V
i
) from
waveform generator (Agilent 33220 A) and effective
voltage (V
e
) measured from oscilloscope when the TFC
slider is disconnected to voltage source.
126
Figure 7.3
Schematic diagram of effective voltage (V
e
) or the real
input voltage to the heater element and the corresponding
applied voltage (V
a
) measured from oscilloscope when the
TFC slider is connected to the voltage source. The V
a
can
be measured at both static and dynamic states.
127
Figure 7.4
The effective voltage (V
e
) measured with oscilloscope
when the TFC slider is disconnected to the voltage source
and the applied voltage (V
a
) to the heater at both static and
dynamic statuses when the TFC slider is connected to the
voltage source.
128
Figure 7.5
The TFC heating power as a function of TFC input voltage
when the heater resistance is considered to be both variable
and constant during the heating process.
129
Figure 7.6
The thermal actuation efficiency is measured
experimentally with triple harmonic method. By
multiplying the
with the slop obtained from the
fitting curve of logarithmic ratio in the region before
contact, which is 0.0018/mW, the thermal actuation
efficiency of the specific TFC slider can be derived to be
around 0.11 nm/mW.
131
Figure 7.7
As the slider and disk are both made of reasonably well
conducting materials, the slider-disk contact may be
classified into conductor-conductor contact. The HDI may
act as a quasi-parallel capacitor and the slider and disk may
act as opposite plates of a capacitor.
133
xvi
Figure 7.8
Schematic diagram of a parallel capacitor. V is the potential
difference between slider and disk, A is the area of the
plates, ε is the dielectric constant of the medium between
the plates and d is the distance between the plates.
134
Figure 7.9
The simulated current with respect to the slider FH
variation which is purposely designed with a sinusoidal
modulation to overlap on the original slider FH (5 nm) as a
function of time. The frequency and the amplitude of the
modulation are 1 Hz and 2.5 nm, respectively.
135
Figure 7.10
The simulated current with respect to the slider FH
variation which is purposely designed with a sinusoidal
modulation to overlap on the original slider FH (3 nm) as a
function of time. The frequency and the amplitude of the
modulation are 1 Hz and 2.5 nm, respectively.
136
Figure 7.11
The TFC heating power with respect to the TFC input
voltage as a function of time. It can be found that the
variation of the TFC heating power has the same frequency
and phase as those of the input voltage.
138
Figure 7.12
The slider FH modulation with respect to the TFC heating
power as a function of time. It can be found that the slider
FH modulation has a 180° phase shift relative to the TFC
heating power, and the modulation curve is not exactly
symmetrical to the initial FH. The knee points of FH
variation relative to the initial FH is about 3.4 nm in
positive and 1.86 nm in negative which means the
minimum FH of specific TFC slider is about 3.2 nm for the
given parameters.
139
Figure 7.13
For a given TFC input voltage overlapped with a sinusoidal
function modulation, the current is measured and shown in
the figure with respect to slider input voltage, slider FH
modulation and vertical velocity (LDV signal) of slider as a
function of time. Within one cycle of slider FH modulation,
non-contact, lubricant-contact and lube-surfing regions can
be observed with respect to the LDV humps. It is quite
promising to note that the measured current correlates well
and demonstrates a comparable sensitivity with the LDV
signal for detecting of slider-lubricant contact.
140
Figure 8.1
Photograph (a) and schematic diagram (b) of the
experimental setup for electrical current measurements. The
slider mount is electrically isolated from the rest of the
system.
150
Figure 8.2
The measured electrical current with respect to different
disk RPMs as a function of TFC heating power.
152
xvii
Figure 8.3
The measured electrical current with respect to disks with
and without mobile layer of lubricant as a function of TFC
heating power. The electrical current measured from the
disk without mobile lubricant is clearly higher than that
with mobile lubricant, suggesting that mobile layer of
lubricant reduced the head-disk contact intensity.
155
Figure 8.4
The measured electrical current with respect to the TFC
power, slider FH modulation and LDV signal as a function
of testing time under different V
dc
.
159
Figure 8.5
Schematic diagram on the correlation of capacitor current,
slider-lubricant spacing and the inverse of the spacing.
Once (1/d
3
1/d
2
) (t
3
t
2
) = (1/d
2
1/d
1
) / (t
2
t
1
), the
current will become a constant value. The current will
decrease to zero when the spacing keeps constant.
161
Figure 8.6
The shifted current (except V
dc
at 0 V and 1.5 V) with
respect to the TFC power, slider FH modulation and LDV
signal as a function of testing time under different V
dc
.
164
Figure 8.7
By multiplying the
with the slop obtained from
the fitting curve of logarithmic ratio in the lubricant-contact
region (the point corresponding to TDP is omitted), which
is 0.00046/mW, the thermal actuation efficiency of the
specific TFC slider during lubricant-contact can be derived
to be around 0.029 nm/mW.
167
Figure 8.8
The maximum depth of TFC protrusion penetrating into the
lubricant during surfing stat as a function of TFC heating
power. Referring to the thickness of mobile lubricant and
the maximum TFC heating power for surfing of slider in
the mobile lubricant, the optimized region of stable surfing
state for the specific TFC slider is estimated and
highlighted in the figure.
169
Figure 8.9
Schematic diagram of typical stages during light
touchdown, surfing state and takeoff processes with respect
to LDV signal, electrical current signal and slider FH as a
function of time.
170
xviii
List of Abbreviations
ABS
air-bearing surface
AFM
atomic force microscopy
AE
acoustic emission
BPMR
bit patterned media recording
C-AFM
conductive atomic force microscopy
CSS
contact start stop
DLC
diamond-like carbon
DOF
degrees-of-freedom
DSI
Data Storage Institute
DTR
discrete track recording
EFC
electrostatic flying height control
FFT
fast Fourier transform
FH
flying height
GMR
giant-magneto-resistive
GPIB
general purpose interface bus
HAMR
heat assisted magnetic recording
HDD
hard disk drive
HDI
head-disk interface
HGA
head gimbal assembly
HMS
head-media spacing
HRF
harmonic ratio FH
HSA
head stack assembly
INSIC
information storage industry consortium
LDV
laser doppler vibrometer
xix
LMR
longitudinal magnetic recording
L/UL
load-unload
LZT
laser zone texture
MEMS
micro-electromechanical systems
MR
magneto-resistive
MW
molecular weight
OSA
optical surface analyzer
PFPE
perfluoropolyether
PMR
perpendicular magnetic recording
PZT
piezoelectric transducer
RAMAC
random access method of accounting and control
RH
relative humidity
RPM
rotations per minute
SNR
signal-to-noise ratio
SPFM
scanning polarization force microscopy
SPM
scanning probe microscopy
STM
scanning tunneling microscopy
TA
thermal asperity
TDMR
two-dimension magnetic recording
TDP
touchdown power
TE
trailing edge
TFC
thermal flying height control
TMR
tunneling magneto-resistance
UHV
ultra-high vacuum
VCM
voice coil motor
XPS
x-ray photoelectron spectroscopy
1
Chapter 1
Introduction
1.1 Evolution of Hard Disk Drives (HDDs)
In 1952, Reynold Johnson of IBM was asked to start a new research team to
develop a better technology for fast access to large volumes of data. It was decided
early on to use inductive magnetic recording as the base technology because it was a
proven technology with the magnetic tapes and drums. The open question was what
configuration the new device should be for achieving fast random access at low cost.
In the end, a new, flat platter design, as first reported in 1952 by Jacob Rabinow
(Rabinow, 1952) was chosen over a simpler cylinder concept. In his famous article,
Rabinow dealt with “The Notched-Disk Memory” and triggered the invention of what
is known today as the computer hard disk drive (HDD). Johnson accurately foresaw its
better potential for future improvements, and successfully demonstrated the first disk
drive systemRandom Access Method of Accounting and Control (RAMAC) in 1955
(Stevens, 1981).
Fig. 1.1
IBM RAMAC 305 computer system (Hoagland, 2011).
2
The prototype was so successful that in 1956 it was marketed as RAMAC 305,
as shown in Figure 1.1, the first commercial computer with a magnetic HDD. The one-
ton, double-freezer-size disk drive, named as RAMAC 350, consisted of fifty 24-inch
diameter aluminum disks mounted on a common shaft. The shaft was driven by an AC
motor spinning at 1200 rotations per minute (RPM). The disks were coated on both
sides with a magnetic iron oxide material, so there were 100 recording surfaces. The
whole disk stack was served by two read/write heads shuttling up and down the disk
stack to access the selected platter, as shown in Figure 1.2. This was achieved with a
hydrostatic air-bearing, wherein compressed air was forced out of tiny holes on the
head’s surface. The original RAMAC 350 HDD had a total capacity of 5 million
characters, achieved with an areal density of about 2000 bits/in
2
. The slider-disk
spacing was about 20 m, and the average access time for any record was around 1 s, a
remarkable achievement at the time.
Over the past half century, HDDs have undergone many improvements over
the original RAMAC (Harker et al., 1981); yet the underlying principles of operation
Fig. 1.2
Close-up of IBM RAMAC 350 magnetic hard disk drive (Hoagland, 2011).
3
remain essentially the same. One early and very important evolution was the
introduction of the hydrodynamic air-bearing utilizing a contoured structure called a
slider to carry the head. This important simplification, introduced in 1962 in the IBM
1301, eliminated the need for compressed air. This made it feasible for each recording
surface to have its own dedicated head. Any disk surface can now be selected by
electronically activating its associated head. As a result, the average access time was
drastically improved, to 165 ms in the IBM 1301.
Most of the subsequent improvements in slider design were mainly in reducing
its dimensions. The concept of integrating the disks and the head arm assembly as a
sealed unit was introduced in 1973 in the IBM 3340 or nicknamed the Winchester
drive (Harker et al., 1981). Its concept of an integrated heads and disks assembly can
be considered to be the predecessor of all of today’s HDDs. Up until the 1970s, HDDs
remained big and expensive and were used exclusively in the realm of large computer
systems. In 1980, Seagate revolutionized the HDD industry by introducing the ST506,
a 5 ¼-inch form factor (the physical size and shape of a device) HDD for the nascent
personal computer (PC) market (Kryder, 2006). Eventually, the PC HDD market far
exceeded the enterprise storage market in terms of volume shipment. Until very
recently several 2 terabytes (TB) HDDs were available on the market, like Seagate
Barracuda LP and Western Digital (WD) RE4 etc. Among them, WD RE4 has four
thin-film 3.5-inch platters which translate to a density of approximately 400 Gbits/in²
and 8 ceramic sliders with dual stage actuator technology. In fact, this drive is not the
newest and the best, it just was randomly chosen to make one point there has been a
huge progress in the field of HDD technology in the ~57 years, and the rate of this
progress is just increasing year after year.
4
1.2 Areal Density of Magnetic Recording Hard Disk
A recent study forecasted explosive growth of the digital universe from 130
exabytes (EB, 13010
18
bytes) in 2005 to 40 zettabytes (ZB, 4010
21
bytes), or 40
trillion gigabytes (GB) in 2020. From now until 2020, the digital universe will about
double every two years (Gantz and Reinsel, 2012). It is thus vitally important to ensure
the continued rapid increases in capacity of the ubiquitous HDD that provides the
foundation for this digital universe. The biggest lever for higher HDD capacities is to
increase the areal density, which is the number of bits that can be recorded per square
inch. For a given disk diameter, this parameter determines the amount of data that can
be stored on each platter. This, in turn, dictates the total storage capacity of a HDD
given the number of platters it contains. Even though there are many other contributing
factors, ultimately, this is the single most important parameter that governs the cost per
megabyte (MB) of a HDD. It is the incredible and consistent rapid growth rate of areal
density over the past 30 years that has driven the storage cost of HDDs down to the
level that makes it still the technology of choice for online data storage. Areal density
has reached the point where it is economically feasible to miniaturize HDDs, pushing
them to fast becoming ubiquitous in our daily lives as tiny embedded components in
many mobile products. The original RAMAC 350 had a lowly areal density of only
2000 bits/in
2
. In 2005, with the introduction of perpendicular recording, areal density
had grown to 612 Gbits/in
2
(Tanahashi et al., 2009). This represents a growth of about
300 million folds. Up to now, the highest areal density reported was an astounding 1.5
Tbits/in
2
which was demonstrated by TDK (Owano, 2012). The evolutionary history of
areal density growth is summarized in Figure 1.3 (Wood, 2009).
The HDD industry is at a critical technology crossroads and it is paramount
that we quickly establish comprehensive paths to push beyond the superparamagnetic