Engineering the band gap, fermi level, electronic and magnetic properties of transparent conducting oxides
Bạn đang xem bản rút gọn của tài liệu. Xem và tải ngay bản đầy đủ của tài liệu tại đây (3.16 MB, 142 trang )
ENGINEERING THE BANDGAP, FERMI LEVEL,
ELECTRONIC AND MAGNETIC PROPERTIES OF
TRANSPARENT CONDUCTING OXIDES
YONGLIANG ZHAO
NATIONAL UNIVERSITY OF SINGAPORE
2013
ENGINEERING THE BANDGAP, FERMI LEVEL,
ELECTRONIC AND MAGNETIC PROPERTIES OF
TRANSPARENT CONDUCTING OXIDES
YONGLIANG ZHAO
(B.Sc, NATIONAL UNIVERSITY OF SINGAPORE,
SINGAPORE)
A THESIS SUBMITTED
TO THE DEPARTMENT OF PHYSICS
NATIONAL UNIVERSITY OF SINGAPORE
IN PARTIAL FULFILMENT FOR THE
DEGREE OF DOCTOR OF PHILOSOPHY IN SCIENCE
2013
i
DECLARATION
I hereby declare that the thesis is my original work and it has been written by
me in its entirety. I have duly acknowledged all the sources of information
which have been used in the thesis.
This thesis has also not been submitted for a degree in any university
previously.
Yongliang Zhao
10 Nov 2013
ii
ACKNOWLEDGEMENTS
The past four years have seen extreme events, rare economic crisis sweeping
the world, people fighting for their freedom, lives, democracy, honors, jobs,
etc. in virtually all parts of the globe. I consider myself to be very lucky and
feel blessed for acquiring a Ph.D. education in NUSNNI-NanoCore, NUS
during these turbulent times. I am grateful to a lot of people who have given
me their selfless help, not only in actions, but also intellectually.
I have to first give my acknowledgment to my advisor, Prof. T. Venkatesan.
Venky, who taught and influenced me both in research skills and my own
attitude to life. I still remember my first meeting with Venky in his office.
Since then, his knowledgeable, conversant and scholarly image had formed a
deep impression in my mind. He never pushed me, but his enthusiasm for
research always had a strong effect on me. When I made big mistakes, he
criticized me severely but always gave me a chance to mend my ways. The
knowledge and experience that he imparted to me in research and career will
forever be supporting my pursuit of my goal. His edification and expectations
will encourage me to work harder and smarter. Next I want to thank my
co-advisor, Dr. Qing Wang, for his patient guidance and helpful suggestions. I
spent a whole year in his lab, learning about solar cells, planning experiments
under his help. Without him, I could not have become so interested in solar
energy conversions, which will be the main task in my post doctor studies, and
possibly in the next few years.
I should specially thank Dr. Jams Robert Jennings, Dr. Weiming Lǚ, Dr. Zhen
Huang, and Dr. Sankar Dhar, for their patient listening and they never rejected
any discussions or giving me assistance.
I want to thank Dr. Ariando, Dr. A. Rusydi, Dr. Haibin Su, Dr. K. Gopinadhan,
Dr. S. Saha, Dr. Dongchen Qi, Dr. Hongwei Ou, and Dr. Guangwu Yang. Their
tremendous help with experiments have been of great value to me.
Shengwei Zeng, Zhiqi Liu, Jianqiang Chen, Changjian Li, Feng Li, Qizhao
Huang and Yeru Liu, thank you all not only for the cooperation in experiments
but also for your impressive jokes.
Mallikarjunarao Motapothula, Amar Srivastava, Anil Annadi, Dr. Arkajit Roy
Barman, and Tarapada Sarkar, I am really honored to be colleagues of all these
iii
wonderful and talented guys.
I particularly need to thank Jingjing Li for his encouragement when I was at
the lowest point in my life. Also, I enjoyed my life with my roommates Ling
Feng, Niantao Deng and Bo Qiu. Of course, there are many more people who
helped me although I cannot list them all here. I take this opportunity to thank
them all and wish them happy lives.
Finally and most importantly, I want to express my love and gratitude to my
wife Suzhen Zhang, my parents and sisters. Thank you for thinking of me
always. Your heads and hearts are always behind me and supporting me. You
are more important than my life.
iv
TABLE OF CONTENTS
DECLARATION i
ACKNOWLEDGEMENTS ii
TABLE OF CONTENTS iv
ABSTRACT vii
LIST OF PUBLICATIONS ix
LIST OF FIGURES xi
LIST OF SYMBOLS xvii
Chapter 1 Introduction 1
1.1 Motivation and scope of the thesis 1
1.2 Brief introduction of concept of energy bandgap 3
1.3 Fundamental physical and chemical properties of TiO
2
5
1.3.1 Crystal structures 5
1.3.2 Electronic structures 7
1.4 Typical applications of TiO
2
7
1.4.1 Transparent Conducting Oxides (TCOs) 8
1.4.2 Dye Sensitized Solar Cell (DSC) and water splitting 8
1.4.3 Other applications 11
Chapter 2 Basic sample preparation and characterization methods 12
2.1 Sample preparation technique: Pulsed Laser Deposition 12
2.2 Structure characterization techniques 13
2.2.1 X-ray diffraction 13
2.2.2 Rutherford Backscattering Spectrometry and Ion Channeling 14
2.2.3 Transmission Electron Microscopy & Energy-dispersive X-ray
spectroscopy 16
2.3 Optical bandgap and flat band potential study techniques 18
2.3.1 Ultraviolet-visible Spectroscopy 18
2.3.2 Electrochemical Impedance Spectroscopy 18
2.4 Transport properties study technique: Physical Property Measurement
System 19
2.5 Magnetism and impurity characterization techniques 21
2.5.1 Superconducting Quantum Interference Device-Vibrating Sample
magnetometers 21
2.5.2 Secondary Ion Mass Spectroscopy 23
2.5.3 X-ray Absorption Spectroscopy 24
Chapter 3 Unexpected variable range hopping (VRH) mechanism
observed in pure anatase TiO
2
thin film 25
v
3.1 Development of VRH theory 25
3.1.1 Mott VRH 25
3.1.2 Efros-Shklovskii (ES) VRH 26
3.2 Sample preparation and characterization 26
3.3 Transport properties and magneto-resistance (MR) studies 27
3.3.1 Theoretical mobility and MR in the range of VRH conduction 27
3.3.2 Experimental results 29
3.4 Summary 35
Chapter 4 Tailoring the bandgap of anatase TiO
2
by cationic dopant Ta
and study of the shift of flat band potential by applying Mott-Schottky
equation 36
4.1 Blue shift of optical bandgap of TiO
2
36
4.2 Mott-Schottky equation 37
4.3 Experimental section 39
4.4 Experimental results and discussion 41
4.5 Theoretical calculation results 50
4.6 Summary 54
Chapter 5 Insulator to metal transition of anatase TiO
2
thin film upon low
concentration of Ta doping 55
5.1 Insulator to metal transition 55
5.2 Kondo effect 55
5.3 Weak localization 58
5.4 Experimental results 60
5.5 Summary 66
Chapter 6 Nickel impurity mediated reversible ferromagnetism of rutile
TiO
2
substrate upon annealing 68
6.1 Introduction to oxide based Dilute Magnetic Semiconductors 68
6.1.1 Types of magnetism 68
6.1.2 Dilute Magnetic Semiconductors 71
6.2 Background of the experiment 72
6.3 Experimental details 73
6.4 Results and discussions 75
6.5 Summary 83
Chapter 7 Structural, electronic and optical properties of transparent
conducting SrNbO
3
thin films 84
7.1 Introduction of the material 84
7.2 Experimental section 86
vi
7.3 Results and discussions 86
7.4 Summary 94
Chapter 8 Summary and outlook 96
8.1 Summary 96
8.1.1Transport properties of anatase TiO
2
thin film 96
8.1.2 Ferromagnetism of rutile TiO
2
substrate induced by Nickel impurity 97
8.1.3 Structural, transport and optical properties of SrNbO
3
97
8.2 Outlook 97
BIBLIOGRAPHY 99
Appendices 111
Appendix 1 Derivation of equation (3.7) from equation (3.6) 111
Appendix 2 Values of the constants in equation (3.8) 111
Appendix 3 Fitting details of Figure 3.5 (a) 112
Appendix 4 The impedance spectra of 3.5%, 6.4% and 8.9% Ta-TiO
2
films
115
Appendix 5 Zeview fitting parameters of R, R’, T
CPE
, P
CPE
, ω''
max
for the
equivalent circuit in Fig.4.6 (c) 117
Appendix 6 Transport and optical properties of Ta
x
Ti
1-x
O
2
films with Ta
concentration (x) between 20% and 30% 118
Appendix 7 Transmittance spectrum of (001) TiO
2
substrate treated under
different conditions 121
Appendix 8 Comparison the magnetic property of TiO
2
substrates with (001)
and (110) orientations annealed in the same vacuum condition 122
vii
ABSTRACT
TiO
2
is a promising material for photo-catalytic water splitting and carbon
dioxide reduction, both of which strongly depend on the positions of the
valence and conduction band edges. Hence to modify the bandgap and also the
valence and conduction band edge positions of TiO
2
to satisfy the energetic
requirement for a photocatalytic reaction is one of the objectives of this thesis.
While, pure TiO
2
is a semiconductor, Niobium (Nb) or Tantalum (Ta) doped
(alloyed) TiO
2
shows metallic behavior. Hence it is important to study this
transition from an insulator to a metal in detail, not only for the interesting
fundamental science but also for its potential applications as transparent
conducting oxides (TCOs). In addition, the magnetic property of TiO
2
substrate is studied as it is commercially available and is frequently used in
many experiments involving dilute magnetic semiconducting oxide thin films.
Besides TiO
2
, a metallic oxide (SrNbO
3
) with optical bandgap of 4 eV is
studied for the potential application as TCOs and as photocatalyst in water
splitting.
Ta doped (alloyed) TiO
2
thin film in anatase form is prepared by pulsed laser
deposition and characterized by X-ray diffraction and Rutherford
Backscattering Spectrometry. UV-visible spectroscopy shows the blue shift of
the optical bandgap of the samples with increasing Ta concentration and the
negative shift of the flat band potential (decrease of work function) with Ta
doping (alloying) is verified by electrochemical impedance spectroscopy. By
considering the changes of the optical bandgap and Fermi level, it is
concluded that both the conduction and valence band edges shift negatively
(the energy difference between the level and vacuum level is decreasing) with
Ta concentration but with the former faster. Hence it is expected that the
performance of Ta doped (alloyed) TiO
2
in photocatalytic experiments should
improve as the electrons in the conduction band have higher energies.
Pure anatase TiO
2
thin film prepared under high vacuum may incorporate
oxygen vacancies, which act as electron donors while the randomly distributed
oxygen vacancies may introduce trapping potentials, which then reduce
electrons’ mobility. As a result of these, TiO
2
undergoes a metal-to-insulator
transition at low temperatures. The transport behavior at low temperatures
viii
may be attributed to variable range hopping showing strong coupling in
magnetic field induced positive magnetoresistance. On the other hand, tuning
the oxygen partial pressure during growth tunes the oxygen vacancies and
compensating defects that in turn cause a resistivity-minimum, which is
almost independent of the growth-temperature (within the favorable
temperature range for the formation of anatase phase of TiO
2
).
TiO
2
thin films with low Ta concentration (0.1% to 0.4%) are prepared for
studying transport property as a function of Ta concentration. It is shown that a
transition of strong to weak localizations exists at low temperatures (compared
to undoped sample). Ta doping can improve the crystallinity of the sample as
it can suppress the formation of oxygen vacancies, which then reduces
localizations.
Reversible ferromagnetism has been found in commercially available rutile
TiO
2
substrate by simply annealing it in high vacuum and recovering the
non-magnetic state by annealing it in oxygen rich environment. It is shown
that Ni impurity, which is responsible for the observed ferromagnetism, may
exist in the pristine sample and can segregate to the top surface by vacuum
annealing. The embedded Ni clusters in the vacuum annealed TiO
2
crystal near
the sample surface will form a cermet structure, which exhibit a tunneling
transport behavior at low temperatures.
An exciting TCO candidate SrNbO
3+δ
film forms cubic perovskite structure on
LaAlO
3
substrate with a lattice constant close to 4.1 Å. The optical bandgap of
the film is measured as 4.0 eV and slightly decreases with oxygen partial
pressure. Surprisingly, such large bandgap material prepared at 1 × 10
-5
Torr
shows very low resistivity (~1.8 × 10
-4
Ω-cm at room temperature), which is
weakly dependent on the temperature. The resistivity of the film is strongly
dependent on the deposition pressure where the films become insulating for
the pressure ≥ 6 × 10
-5
Torr.
ix
LIST OF PUBLICATIONS
1) Y. L. Zhao, M. Motapothula, N. L. Yakovlev, Z. Q. Liu, S. Dhar, A. Rusydi,
Ariando, M. B. H. Breese, Q. Wang, and T. Venkatesan, “Reversible
Ferromagnetism in rutile TiO
2
single crystals induced by nickel impurities”,
Appl. Phys. Lett. 101, 142105 (2012).
2) Y. L. Zhao, W. M. Lv, Z. Q. Liu, S. W. Zeng, M. Motapothula, S. Dhar,
Ariando, Q. Wang, and T. Venkatesan, “Variable range hopping in TiO
2
insulating layers for oxide electronic devices”, AIP ADVANCES 2, 012129
(2012).
3) Y. L. Zhao, A. Roy Barman, S. Dhar, A. Annadi, M. Motapothula, Jinghao
Wang, Haibin Su, M. Breese, T. Venkatesan, and Q.Wang, “Scaling of flat
band potential and dielectric constant as a function of Ta concentration in
Ta-TiO
2
epitaxial films”, AIP ADVANCES 1, 022151 (2011).
4) Z. Huang, X. Wang, Z. Q. Liu, W. M. Lu, S. W. Zeng, A. Annadi, Y. L.
Zhao, W. L. Tan, T. Venkatesan, Ariando, “Conducting channel at
LaAlO
3
/SrTiO
3
heterostructures” Phys. Rev. B - Rapid Comm. (2013)–
accepted, publishing.
5) A. Annadi, X. Wang, K. Gopinadhan, W. M. Lu, A. Roy Barman, Z. Q. Liu,
A. Srivastava, S. Saha, Y. L. Zhao, S. W. Zeng, S. Dhar, N. Tuzla, E. Olsson,
Q. Zhang, B. Gu, S. Yunoki, S. Maekawa, H. Hilgenkamp, T. Venkatesan,
Ariando, “Anisotropic two-dimensional electron gas at the LaAlO
3
/SrTiO
3
(110)
interface” Nature Commun.4, 1838 (2013).
6) S. W. Zeng, X. Wang, W. M. Lu, Z. Huang, M. Motapothula, Z. Q. Liu, Y.
L. Zhao, A. Annadi, S. Dhar, H. Mao, W. Chen, T. Venkatesan, Ariando,
“Metallic state in La-doped YBa
2
Cu
3
O
y
thin films with n-type charge carriers”
Phys. Rev. B 86, 045124 (2012).
7) Z. Q. Liu, D. P. Leusink, Y. L. Zhao, X. Wang, X. H. Huang, W. M. Lü, A.
Srivastava, A. Annadi, S. W. Zeng, K. Gopinadhan, S. Dhar, T. Venkatesan,
Ariando, “Metal-insulator transition in SrTiO3-x thin film induced by
frozen-out carriers”, Phys. Rev. Lett. 107, 146802 (2011).
8) Z. Q. Liu, D. P. Leusink, W. M. Lü, X. Wang, X. P. Yang, K. Gopinadhan,
L. Y. Teng, Y. L. Zhao, A. Annadi, A. Roy Barman, S. Dhar, Y. P. Feng, H. B.
Su, G. Xiong, T. Venkatesan, Ariando, “Resistive switching mediated by the
formation of quasi conduction band in a large bandgap insulating oxide”,
Phys. Rev. B 84, 165106 (2011).
9) A. Roy Barman, M. Motapothula, A. Annadi, K. Gopinadhan, Y. L. Zhao,
Z. Yong, I. Santoso, Ariando, M. Breese, A. Rusydi, S. Dhar and T.
Venkatesan, “Multifunctional Ti1-xTaxO2: Ta Doping or Alloying?”, Appl.
Phys. Lett. 98, 072111 (2011).
x
10) Z. Huang, Z. Q. Liu, X. Wang, W. M. Lu, S. W. Zeng, A. Annadi, X. L.
Tan, P. F. Chen, Y. L. Zhao, C. J. Li, W. B. Wu, T. Venkatesan, and Ariando,
“ Controlling conductivity in strained SrTiO
3
-based thin films”, Phys. Rev. B
(2013) – submitted.
xi
LIST OF FIGURES
Figure 1.1: Schematic graphs of the band structures of (a) metal, (b)
semiconductor, (c) insulator as defined in conventional textbooks. 3
Figure 1.2: Schematic graphs of the band structures of (a) intrinsic
semiconductor, (b) n type semiconductor, (c) p type semiconductor, (d)
degenerate semiconductor. 4
Figure 1.3: Schematic graphs of the crystal structure of TiO
2
with form (a)
rutile, (b) anatase, (c) brookite. 6
Figure 1.4: Schematic graphs of the (a) structure of DSC, (b) working principle
of DSC. 9
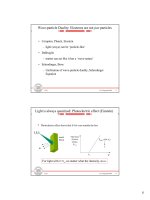
Figure 1.5: Schematic graphs of (a) working principle of semiconductor as
electrode in photocatalytic water splitting, (b) energy band levels of typical
semiconductors. 11
Figure 2.1:Schematic graph of a pulsed laser deposition setup. 13
Figure 2.2:Schematic graph of the working principle of X-ray diffraction. 14
Figure 2.3: Schematic graphs of the (a) RBS working geometry, (b) RBS
spectrum operated in random mode. 15
Figure 2.4: Schematic graphs of RBS operated in ion channeling mode for a (a)
perfect lattice, (b) disordered lattice. 16
Figure 2.5: Schematic graphs of (a) simple geometry of TEM system, (b)
working principle of EDX. 17
Figure 2.6: Schematic graphs of (a) working principle of UV-vis spectroscopy,
(b) simple geometry of UV-vis spectroscopy system. 18
Figure 2.7: Schematic graphs of bonding in (a) Van der Pauw configuration, (b)
linear configuration, (c) Hall measurement configuration. 21
Figure 2.8: Schematic graphs of the working principles of the (a) Josephson
junction, (b) SQUID 23
Figure 2.9: Schematic graph of the working principle of XAS. 24
Figure 3.1: XRD spectrum of pure anatase TiO
2
deposited onto LAO (100)
substrate. Bright spots in two dimensional detection systems indicate the single
crystallites of the film and substrate. 27
Figure 3.2: Temperature dependent measurement of resistivity for samples
prepared under deposition temperature 700°C and oxygen partial pressure
1.2×10
-5
Torr, 1.4×10
-5
Torr and 1.9×10
-5
Torr respectively. The green dash line
indicates the curve fitting. 28
xii
Figure 3.3: (a) Plot of resistivity with temperature by Mott VRH theory. Inset is
the plot by taking considering the temperature dependent pre-exponential factor.
The dash lines were guided by eyes. (b) Mathematical way to distinguish Mott
VRH and ES VRH, as described in text. The dash lines were guided by eyes.
30
Figure 3.4: Statistical study of the room temperature resistivity of the samples
prepared with different oxygen partial pressure. 32
Figure 3.5: (a) Transverse MR of the sample prepared under oxygen partial
pressure 1.4×10
-5
Torr at different measurement temperatures. The arrows
indicate the corresponding axis for the data measured at different temperatures.
The dash lines are fitted to cubic polynomials. (b) Schematic diagram showing
the MR measurement. (c) Angular dependent MR of the same sample under
different temperatures and magnetic fields. Rotation angles were described in (b)
and the arrows indicate the corresponding axis for the data. 33
Figure 3.6: Hall coefficient (left axis) and mobility (right axis) measurement
above 50 K for the sample prepared under oxygen partial pressure 1.4×10
-5
Torr.
34
Figure 4.1: (a) UV-vis transmission spectra of pure and Ta-TiO
2
samples. (b)
Blue shift of the optical bandgaps of anatase Ta-TiO
2
according to Tauc plot.
37
Figure 4.2: Energy band diagram of a metal in contact with (a) N type
semiconductor under thermal non-equilibrium condition (top) or in thermal
equilibrium (bottom). (b) P type semiconductor under thermal non-equilibrium
condition (top) or in thermal equilibrium (bottom). Φ
sc
and Ф
m
are the work
functions of semiconductor and metal. E
fsc
and E
fm
are the Fermi levels of
semiconductor and metal. V
bi
is the built in potential in the space charge region
and e is the elementary charge. Space charge region is shadowed. 38
Figure 4.3: (a) Real image and schematic graph of the working electrode used
in EIS measurement. (b) Schematic graph of three electrodes setup. During
measurement, current is applied between working and counter electrodes and
voltage is measured between working and reference electrodes. (c) Calibration
of the potential of the Ag/AgNO
3
reference electrode with respect to Ferrocene
(1mM in 0.1M TBAP-acetonitrile solution) by CV measurement. 40
Figure 4.4: Random and channeling spectra of 6.4% Ta-TiO
2
film showing
excellent channeling yield. Ta concentration measured by RBS versus nominal
Ta concentration in the PLD target is shown in the inset. 42
Figure 4.5: Resistivity versus temperature of Ta-TiO
2
films as a function of Ta
concentration. Inset shows the pure anatase performance. 43
Figure 4.6: (a) Nyquist plots of pure TiO
2
with Al contact layer. The frequency
range here is from 0.01 Hz to 30 kHz. The inset graph is in the expanded scale
of the high frequency data. (b) Nyquist plots of 1.5% Ta incorporated TiO
2
without Al buffer contact layer. The frequency range shown here is from 0.01
xiii
Hz to 30 kHz. The inset graph is the expanded scale of the high frequency data.
(c) Equivalent circuit of the samples in current EIS measurement. 45
Figure 4.7: Mott-Schottky plot of the samples. Right y-axis is for pure TiO
2
,
left y-axis is for Ta-TiO
2
samples. X-axis is the applied potential to the samples
relative to the reference electrode. The straight lines were guided by eyes. The
inset is the flat band potential of the samples obtained from the Mott-Schottky
equations by considering the applied potential plot. 46
Figure 4.8: (a) Hall effect measurement of the charge carrier density (black)
and mobility (blue) of the samples together with the carrier density of the
samples estimated from Mott-Schottky plot (red). (b) Dielectric constant as
function of measured Ta concentration calculated by reconciling Hall effect and
Mott-Schottky measurements of carrier densities. (c) Comparison of Sheet
resistance of the films as function of measured Ta concentration obtained from
direct resistivity measurement and from Mott-Schottky plot. 48
Figure 4.9: Experimentally obtained Fermi level (red) and optical bandgap blue
shift of the Ta incorporated TiO
2
samples where pure TiO
2
was selected as the
reference point (blue), and simulated Fermi level shift with measured Ta doping
concentration (black), the shift value of the first point (3.125%) is set as zero for
easy comparison. 50
Figure 4.10: (a) band structure of pure anatase TiO
2
(b) Total and partial DOS
for pure anatase TiO
2
. 52
Figure 4.11: (a) Band structure of 12.5% Ta doped TiO
2
(b) Total and partial
DOS for 12.5% Ta doped anatase TiO
2
(c) Projected DOS of Ta atoms. 53
Figure 5.1: (a) In Anderson model, it is assumed that only one magnetic
impurity is surrounded by a Fermi sea, and within the magnetic impurity, there
is only one energy state with energy ε
0
been occupied by one spin up electron
(blue) below the Fermi energy of the metal (orange). Coulomb energy U
indicates the energy needed to add another electron to the state and |ε
o
| is the
minimum energy to move the electron from the impurity’s state to the Fermi sea.
In quantum mechanics, the electron in the impurity’s state may tunnel out and
stay in a virtual state temporally until the state is occupied by an electron from
the Fermi sea. Such process may change the spin of the electron in the
impurity’s state. (b) Density of states of the combination of many such events
described in (a) and the resonance states at the Fermi energy (causing Kondo
scattering) with different probabilities can be obtained at different temperatures,
(Γ is the width of the impurity’s state) showing a decrease in Kondo scattering
with increasing temperature [119]. 57
Figure 5.2: Trajectories of an electron returning to the initial points. C and D
indicate the same trajectory but different directions. Only trajectory C and D
can interference as they are phase coherent. 59
Figure 5.3: Temperature dependent resistivity measurement of TiO
2
samples
with Ta concentrations (a) 0.1% (b) 0.2% (c) 0.3% (d) 0.4% and (e) Plot of T
min
with Ta concentration. 61
xiv
Figure 5.4: (a) the measurement configuration. During experiment, sample is
rotated as shown. (b) MR of 0.1% Ta doped TiO
2
thin film measured at 2 K and
5 K. Angles are measured between the magnetic field and central axis, as shown
in (a). (c) MR of the same sample in (b) measured at 10 K, 20 K and 30 K. (d)
MR of the same sample measured at 50 K and 70 K. 62
Figure 5.5: (a) MR of 0.2% Ta doped TiO
2
measured at different temperatures.
(b) MR of the same sample in (a) measured at different configurations; angles
are described in Fig. 5.4 (d). (c) MR of 0.3% Ta doped TiO
2
measured at
different temperatures. (d) MR of 0.4% Ta doped TiO
2
measured at different
temperatures. 64
Figure 5.6: Hall measurements of (a) 0.1% (b) 0.2% (c) 0.3% (d) 0.4% Ta -TiO
2
thin films. (e) Ta concentration dependent carrier density measured at room
temperature (left axis) and effective Ta percentage (right axis). The straight
lines are guided by eyes. (f) Ta concentration dependent maximum mobility of
the films in (a) (b) (c) and (d). 66
Figure 6.1: (a) Principle of diamagnetism: the internal field repels the applied
magnetic field. (b) Principle of paramagnetism. Without external magnetic field,
the net magnetization is zero. By applying field, linear relation of magnetic
moment and applied field can be seen. (c) Plot of susceptibility of paramagnetic
(positive χ) and diamagnetic (negative χ) materials with temperature. (d)
Principle of ferromagnetism. Without magnetic field, net positive
magnetization exists. (e) Principle of anti-ferromagnetism, where its lattice
equals two sub-lattices with equal amplitude but opposite direction of spin
configurations. (f) Principle of ferrimagnetism, where the sub-lattices have
different amplitude of spins. (g) Formation of magnetic domains can minimize
the magnetostatic energy. (h) Different behaviors of M-H relationship of
paramagnetism (green), ferromagnetism (blue) and superparamagnetism (red).
69
Figure 6.2: (a) Magnetic moment versus field (MH) measurement of TiO
2
substrate at room temperature. The annealing temperature is 800°C and the
annealing time is 2 hours. The vacuum level is kept at 5×10
-6
Torr. Inset shows
the photo of pristine, vacuum annealed and subsequently air annealed samples.
(b) Room temperature MH measurements of TiO
2
substrates vacuum annealed
with 800°C for different times. Here paramagnetic part of the signal was
deducted. (c) Room temperature MH measurements of TiO
2
substrates vacuum
annealed for 2 hours with different temperatures. Only the ferromagnetism
component is shown. (d) MH measurement at 10 K and room temperature of
samples oriented in-plane and out-of-plane with magnetic field. Black and red
colors indicate the out-of-plane plot at room temperature and 10 K. Blue and
fuchsia colors indicate the in-plane plot at room temperature and 10 K
respectively. Inset at the left corner shows the schematic graph of in-plane and
out-of-plane configuration. Inset at the right corner shows the changes of
saturation magnetization (magnetic moment at 4000 Oe in the main graph) and
coercivity with temperature in the in-plane measurement. 75
Figure 6.3: (a) Temperature dependent resistivity measurement of TiO
2
samples vacuum annealed for 2, 4 and 8 hours. Thickness of 50 nm was used in
xv
the calculation. The curve near 300 K is expanded in the inset. (b) Hall effect
measurement of the samples described in (a). The solid circles indicate the
charge carrier density and the open circles represent mobility. 77
Figure 6.4: (a) SIMS data of as received, vacuum annealed and air annealed
TiO
2
. The vacuum and air annealing time is 4 hours. (b) RBS random curve of
as received, vacuum annealed and air annealed TiO
2
substrates as in (a). (c)
RBS random, channeling and curve fit for the vacuum annealed sample in (a).
(d) RBS random peak of TiO
2
samples vacuum annealed for 1, 2 and 4 hours.
Inset shows Ni peak intensity ratio and M
s
ratio of the TiO
2
samples annealed in
vacuum for different times. Ni peak intensity was calculated by integration of
the Ni peak area. 79
Figure 6.5: (a) HRTEM image of TiO
2
crystal vacuum annealed at 800°C for 4
hours. The likely Ni rich areas are shown by white circles. (b) Elemental scan of
the same area described in (a), where the two dash lines show the boundary of
the Ni rich region. 80
Figure 6.6: (a) Magnetic moment of TiO
2
as function of the measuring
temperature. In the legend, the number ahead of FC indicates the cooling field.
For example, 50FC represents that the cooling field is 50 Oe. (b) XAS data of
the as received, vacuum annealed and air annealed TiO
2
samples. 82
Figure 7.1: XRD spectrum of SrNbO
3+δ
films prepared at 750°C and different
oxygen partial pressures. Labels LAO (h00) indicates the substrates’ signal and
SNO (h00) indicates the films’ signal. Inset shows the rocking curve of the films
at SNO (200) peaks. Background figure shows the 2D XRD patterns of SNO
film on LAO substrate. The bright yellow spots are corresponding for particular
peaks in 2θ plot. 87
Figure 7.2: (a) TEM image of SrNbO
3+δ
film on LAO substrate. The film is
prepared under 1 × 10
-5
Torr. (b) Atomic resolution of SrNbO
3+δ
film. (c)
Atomic resolution of LAO substrate. (d) Electron diffraction pattern of
SrNbO
3+δ
film. (e) Electron diffraction pattern of LAO substrate. 88
Figure 7.3: (a) Transmission of the films prepared under 750°C and series of
oxygen partial pressures. (b) Tauc plot of the spectrums in (a). 89
Figure 7.4: Temperature dependent resistivity of the sample prepared under
750°C and 1 × 10
-5
Torr. Inset shows the room temperature resistivity of the
samples as a function of the oxygen partial pressures. 90
Figure 7.5: Temperature dependent charge carrier density and mobility of
SrNbO
3+δ
film on LAO substrate. The film was deposited under 1 × 10
-5
Torr.
91
Figure 7.6: (a) X–ray photoelectron spectroscopy of SrNbO
3+δ
film prepared
under 750°C and 1 × 10
-5
Torr. The binding energies were referenced to the
adventitious C 1s peak (284.5 eV). The spectrum is simulated by superposition
of two sets of Nb 3d peaks where the 3d
5/2
peaks for Nb
5+
and Nb
4+
are located
at 206.63 eV and 204.12 eV respectively. The ratio of the peak area intensity of
xvi
Nb
5+
and Nb
4+
is about 6.4:1. (b) Ultraviolet photoelectron spectroscopy of the
film in (a). The beam energy is 21.2 eV. The work function of the electron
analyzer was calibrated as 4.47 eV. 5 V bias was applied to the sample. Kinetic
energy of the secondary edge was measured as 4.26 eV, as indicated by the
black line cutting off the horizontal axis. (c) Energy difference between the
Fermi level and valence band edge. Fermi level was calibrated as 0 binding
energy. Inset shows the wide scan of the spectrum. 93
Figure 7.7: Particle (proton) induced x-ray emission spectrum of SrNbO
3+δ
films deposited on LAO substrate under different oxygen partial pressures.
Peaks corresponding to particular element are labeled. 94
AppFig 3.1: Cubic polynomial fitting of the MR at 2 K. 112
AppFig 3.2: Cubic polynomial fitting of the MR at 5 K. 112
AppFig 3.3: Cubic polynomial fitting of the MR at 8 K. 113
AppFig 3.4: Cubic polynomial fitting of the MR at 10 K. 113
AppFig 3.5: Cubic polynomial fitting of the MR at 50 K. 114
AppFig 4.1: Nyquist plots of 3.5% Ta incorporated TiO
2
without Al buffer
contact layer. The frequency range shown here is from 0.1 Hz to 30 kHz. The
inset graph is the expanded scale of the high frequency data. 115
AppFig 4.2: Nyquist plots of 6.4% Ta incorporated TiO
2
without Al buffer
contact layer. The frequency range shown here is from 0.1 Hz to 30 kHz. The
inset graph is the expanded scale of the high frequency data. 116
AppFig 4.3: Nyquist plots of 8.9% Ta incorporated TiO
2
without Al buffer
contact layer. The frequency range shown here is from 0.1 Hz to 30 kHz. The
inset graph is the expanded scale of the high frequency data. 116
AppFig 6.1: (a) Temperature dependent resistivity of Ta-TiO
2
films with
different Ta concentrations. (b) Temperature dependent charge carrier density
(left axis) and mobility (right axis) of the films in (a). 119
AppFig 6.2: (a) Transmission of Ta incorporated TiO
2
films in anatase phase
with Ta concentrations of 20%, 25% and 30%. (b) The corresponding Tauc plot
of the films in (a). Indirect bandgap model is applied in Tauc plot. 120
AppFig 7: Transmittance spectrum of (001) TiO
2
substrate treated under
different conditions: as received (black); annealed in vacuum (5×10
-6
Torr)
with 800 °C (red) for 4 hours; and subsequently annealed in air with 800 °C
(blue) for 2 hours……………………………………………………………116
AppFig 8: Magnetic moment versus field (MH) measurement of TiO
2
substrate
with different orientations. The annealing temperature is 800°C and the
annealing time is 2hours…………………………………………………….117
xvii
LIST OF SYMBOLS
R Resistance H Magnetic field
ρ Resistivity K Kelvin
R
s
Sheet resistance t Time
σ Conductivity V Voltage
T Temperature I Current
B Magnetic field H
c
Coercivity
M Magnetic moment μ Mobility
e Electronic charge TiO
2
Titanium dioxide
n Electron carrier density MR Magnetoresistance
PLD Pulsed laser deposition XRD X-ray diffraction
UV-vis Ultraviolet-visible DOS Density of states
RBS Rutherford backscattering spectrometry
LAO Lanthanum aluminates (LaAlO
3
)
TCO Transparent conducting oxide
DMS Dilute magnetic semiconductors
XAS X-ray absorption spectroscopy
SIMS Secondary ion mass spectroscopy
TEM Transmission electron microscopy
EDX Energy dispersive x-ray spectroscopy
SQUID Superconducting quantum interference device
PPMS Physical properties measurement system
EIS Electrochemical impedance spectroscopy
TBAP Tetrabutylammonium perchlorate
HOMO Highest occupied molecular orbital
LUMO Lowest unoccupied molecular orbital
VRH Variable range hopping E
g
Energy bandgap
DSC Dye sensitized solar cells QI Quantum interference
DFT Density function theory CV Cyclic voltammetry
ppm Parts per million ZFC Zero field cooling
CPE Constant phase element μ
B
Bohr magneton
CB Conduction band VB Valence band
V
fb
Flat band potential k
B
Boltzmann constant
xviii
XPS X-ray photoelectron spectroscopy
UPS Ultraviolet photoelectron spectroscopy
PL Photoluminescence
PIXE Particle induced x-ray emission
1
Chapter 1 Introduction
1.1 Motivation and scope of the thesis
Titanium dioxide (TiO
2
) is one of the most important oxide semiconductors on
account of its diverse applications in heterogeneous catalysis [1, 2], solar cells
[3, 4], water splitting [5-7], gas sensors [8, 9], optical coating [10], and
electronic devices [11]. It has found applications in bone implants (because of
its biocompatibility) and in lithium batteries (because of its chemical
compatibility) [12-15]. Most of the applications are related to the bandgap
edges and the position of Fermi level of the material. TiO
2
only absorbs
ultraviolet light because of its large bandgap. People have modified TiO
2
by
anionic dopants for narrowing its bandgap so that more solar energy can be
utilized [5, 16-19]. Regarding the shift of TiO
2
absorption onset towards
visible region, several mechanisms were proposed although a debate existed
[20-24]. Meantime, the effect of cationic dopants on the catalytic properties of
TiO
2
generated wide interest [25-29]. Recently, blue shift of the optical
bandgap of TiO
2
upon Ta incorporation was discovered [30]. However, the
mechanism, especially the effect of cationic dopants (Ta) on the energy levels
of TiO
2
is not systematically studied. This thesis will discuss the fundamental
electronic and optical properties of TiO
2
, which will enable us to understand
the material better and engineer it (especially bandgap edges and Fermi level)
for various applications with increased efficiency.
In last two decades, tremendous efforts were putted into studying the dilute
magnetic semiconductors (DMS) for the applications in spintronic devices
[31-37]. However, this future becomes less rossy because there is lack of
sufficient evidence for the absence of magnetic impurities [38]. Here we will
show some cautionary results regarding the study of DMS.
Recently, the predomination of semiconductors in photocatalytic water
splitting studies was challenged by a metallic oxide, strontium niobate [39].
However, there is short of expectations that the mobility of the carrier can
cover the shortage of internal field, which is needed to split photon generated
electron-hole pairs. We have prepared single crystalline SrNbO
3
thin film and
its structural, electronic and optical properties will be shown in details.
In this chapter, a basic introduction of energy bandgap and Fermi level will be
2
done as they are the “key concepts” to understand some of the experimental
phenomenon in the following chapters. Then a brief introduction about TiO
2
and its application will be presented. In chapter 2, experimental thin film
preparation and characterization techniques will be introduced. The effect of
oxygen vacancies on the electronic transport properties of TiO
2
thin film in
anatase phase will be discussed in chapter 3. In chapter 4, the studies of the
blue shift of the bandgap of TiO
2
upon Ta incorporation will be developed by
studying the corresponding shift of the Fermi level. From which we have
concluded that Ta incorporation causes both the conduction and valence band
edges shifting towards vacuum level with the former faster. This compelling
finding has given us a reasonable assumption that Ta incorporated TiO
2
can be
applied better than pure TiO
2
in photo-catalytic experiment. The incorporation
of Ta ions caused insulator to metal transition of TiO
2
film in anatase phase is
studied in chapter 5, where the measured transition point of Ta concentration is
compared to the estimated value in chapter 4 and showing consistency. In
chapter 6, reversible ferromagnetism of TiO
2
substrate in rutile phase due to
segregation and diffusion of nickel impurities are carefully studied. In chapter
7 we will show that SrNbO
3
can form single crystalline film with perovskite
structure on LaAlO
3
substrate. The film has a large optical bandgap (close to 4
eV) but surprisingly a low resistivity (in the order of 10
-4
Ω∙cm at room
temperature). This low resistivity is contributed more by the charge carrier
density (in the order of 10
22
/cm
3
at room temperature) than by the mobility
(within 10 cm
2
/Vs at room temperature). Last chapter is the summary and
outlook of this thesis, where the difficulties of implementing the assumption in
chapter 4 is pointed out. In addition, some aborted results are briefly
mentioned and some further possible improvements are proposed.
3
1.2 Brief introduction of concept of energy bandgap
Figure 1.1: Schematic graphs of the band structures of (a) metal, (b)
semiconductor, (c) insulator as defined in conventional textbooks.
Energy bandgap (E
g
) is the concept in solid state physics to categorize
materials in terms of their electronic properties as metals, semiconductors and
insulators. Electrons moving in a solid are affected by the periodic potential
which depends on the crystal structure. By considering the overall effect of
periodic potential, there is a forbidden region for electrons to exist in the
energy levels, which is called energy bandgap. As shown in Fig. 1.1, energy
bandgap (E
g
) separates the conduction band (CB) and valence band (VB). In
some references, E
g
is used to differentiate metal, semiconductor and insulator
[40]. In metals (Fig. 1.1(a)), bandgap does not exist; hence, electrons can
move freely within the states. In semiconductors (Fig. 1.1(b)), E
g
is less than 4
eV. When E
g
is above 4 eV, the solid is normally classified as insulator (Fig.
1.1(c)). However, as the development of doping method, the boundary
between semiconductors and insulators is no longer so strict (4 eV). Some
material with small bandgap (< 4 eV) may be very resistive when the Fermi
level is far away from the bandgap edges; on the other hand, some material
with large bandgap (> 4 eV) may become semiconducting when energy levels
are formed near the bandgap edges. Hence the ability to create shallow energy
levels can be used as a criterion to separate semiconductors from insulators. In
semiconductors, shallow energy levels near the bandgap edges can be easily
formed by intrinsic or extrinsic doping, which will be able to promote donor
electrons to the CB or acceptor holes to the VB easily by thermal excitations.
Occupied states
Empty states
Empty states
Occupied states
Empty states
Occupied states
(a) (b) (c)
E
g
< 4 eV E
g
> 4 eV
4
In contrast, the preference to create such shallow energy states in the bandgap
of insulators is weak [41].
The relative position of the Fermi level to the bandgap edges may further
classify semiconductors. For intrinsic semiconductor (Fig. 1.2(a)), Fermi level
(E
f
) is at the center of the bandgap. When E
f
is close to the CB, it is called
n-type semiconductor (Fig. 1.2(b)) because the dominant charge carrier is
electron. When E
f
is close to the valance band, it is called p-type
semiconductor (Fig. 1.2(c)) because the dominant charge carrier is hole. When
the defect bands are broad or are close to the CB/ VB and E
f
crosses the CB
edge or VB edge due to extrinsic doping, it is called degenerate semiconductor
(Fig. 1.2(d)), which will show some metallic characteristics. Actually, doping
is one of the most effective ways of introducing charge carriers in
semiconductors. N-type or p-type semiconductors’ formation depends on the
outer shell electrons of the dopant compared with those of the host material.
When the outer shell electrons of dopant are more, extra electrons will be
donated to the host semiconductor. While in the opposite case, the dopant will
require electrons from the host semiconductor and holes are then donated to
the semiconductor.
Figure 1.2: Schematic graphs of the band structures of (a) intrinsic
semiconductor, (b) n type semiconductor, (c) p type semiconductor, (d)
degenerate semiconductor.
Electrons in VB are strongly bonded or localized, while electrons in CB are
highly mobile. Their differences are quantified by the concept of “Mobility”.
One of the most obvious quantities to separate metals, semiconductors and
insulators is the conductivity, which depends on the mobility and the density
(a) (b) (c) (d)
Conduction
band
valence band
Conduction
band
valence band
Fermi level
Donor
states
Acceptor
states
Extend defects
states
5
of charge carriers. Their relationship is expressed by a simple formula in
Drude model [42, 43]:
(1.1)
where σ is the total conductivity, e is the electronic charge, n
p
and n
e
are the
densities of hole and electron, while μ
p
and μ
e
are the mobilities of hole and
electron, respectively.
Electrons can transit within or across the bandgap when they acquire sufficient
energy provided thermally or by electromagnetic radiation, which has
applications in energy conversion devices like solar cells, light emitting diodes
(LED) etc. Besides, many important characterization techniques including
Photoluminescence (PL), X-ray spectroscopy (XPS), UV-visible spectrum, etc.,
were also designed based on this. In this thesis, most of the phenomenon will
be explained based on “band theory” which is one of the most important
concepts in solid state physics.
1.3 Fundamental physical and chemical properties of TiO
2
1.3.1 Crystal structures
There are three major phases of TiO
2
crystals in nature, which are rutile,
anatase and brookite. Among them, rutile and anatase phases have received
more attentions because of their wide applications. Rutile phase of TiO
2
is the
most stable form, which has tetragonal structure. It belongs to the space group
P4
2
/mnm [44, 45], as shown in Fig. 1.3(a). The lattice parameters are: a = b =
4.587 Å, c = 2.954 Å [46, 47]. Each unit cell contains two Ti atoms which are
located at (0, 0, 0) and (1/2, 1/2, 1/2), and four O atoms are located at (± u, ± u,
0) and (± (u+1/2), ± (1/2-u), 1/2), where u = 0.305 Å. Each Ti atom is bonded
to six O atoms, where the TiO
6
octahedron is slightly distorted, with the
equatorial Ti-O bond length of 1.946 Å and the apical Ti-O bond length of
1.983 Å. The O-Ti-O bond angles have three values, which are 90°, 81.21°,
and 98.79°.
Anatase TiO
2
is a metastable phase and can transform to rutile upon heating. It
also has tetragonal structure but belongs to the space group I41/amd [48], as
shown in Fig. 1.3 (b). The lattice parameters are: a = b = 3.782 Å, c = 9.502 Å
[46, 47]. Each unit cell contains four Ti atoms which are located at (0, 0, 0),
(1/2, 1/2, 1/2), (1/2, 0, 1/4) and (0, 1/2, 3/4) while eight O atoms are located at
p
pee
en en