Performance evaluation of personalized ventilation personalized exhaust (PV PE) system in air conditioned healthcare settings 8
Bạn đang xem bản rút gọn của tài liệu. Xem và tải ngay bản đầy đủ của tài liệu tại đây (2.2 MB, 11 trang )
Chapter 8: Evaluation of energy saving implication using the
most optimal PV-PE configuration
8.1 Introduction
All the experiments conducted in Chapters 5 to 7 of this thesis have flow rates of PE
fixed at 10 l/s and 20 l/s. In this chapter, the Computational Fluid Dynamics (CFD)
models are used to explore other lower PE air flow rates and determine the energy
saving implication of using the most optimal PV-PE (Top-PE) configuration. The
results from the CFD study could provide more information on the system and better
visualization than the experimental study, such as the tracking of the pathlines of PV
air and transportation of pollutants in the room.
8.2 Validation of CFD simulations
8.2.1 The geometrical model
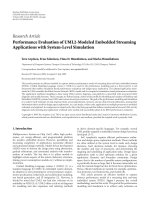
The two manikins, the desk, the MV supply terminals and ceiling exhausts, the DV
supply outlet, the RMP PV ATD, and Top-PE are built into the model with Gambit as
shown in Figure 8.1. The room size and numerical objects are kept the same as in the
Indoor Environmental Chamber in the experimental study. The geometry of the
manikin model is similar to the real manikin, with more than 1000 faces on its surface
in sitting position. The computational thermal manikin is obtained by Gao and Niu
(2004) using 3D laser scanning technique, which is same as the one used in the
preliminary studies.
The two numerical manikins are seated face to face in front of a table in the middle of
the room. Figure 8.1 shows that the RMP terminal is above and in front of the
manikin head and the Top-PE are two small cylinders above the manikin’s heads.
The other objects such as the equipment to support the manikin system, the table to
place the equipment, the chairs, the PV pipes and the legs of tables, are not included
in the CFD model.
Figure. 8.1 General view of the modelled geometry
8.2.2 The turbulence model
It is always difficult to simulate theindoor air flow because of the flow complexity
and instability, and due to the extremely complex geometry of the manikin body, it is
more challenging to predict the airflow rate. Therefore, appropriate turbulence method
and the discretization methods are carefully selected. In this study, the ANSYS
FLUENT 14.0 is selected as the simulation platform. Generally, there are three
approaches for turbulent flow prediction: Direct Numerical Simulation (DNS), Large
Eddy Simulation (LES) and Reynolds-Averaged Navier-Stokes (RANS). They have a
lot of differences in terms of theoretical ideas, computational cost, accuracy and area
of application. DNS computes a turbulent flow by directly solving the highly reliable
Navier-Stokes equation without approximations. DNS resolves the whole range of
spatial and temporal scales of the turbulence, from the smallest dissipative scales
(Kolmogorov scales) to the integral scale. As a result, DNS requires a very fine grid
resolution to capture the smallest eddies in the turbulent flow. In addition, the DNS
method requires very small time steps, which makes the simulation extremely long.
The theoretical basis of the LES method is the fact that large eddies of turbulent flows
depend on the geometry while the smaller scales are more universal (Kolmogorov
1941) and the hypothesis that the turbulent motion can be separated into large-eddies
and small-eddies such that the separation between the two does not have a significant
impact on the large-eddies (Deardorff, 1970). LES is precise in predicting a lot of
turbulence flows; however, the computing cost is still remarkable given the fast
development of computer capacity and speed. The RANS approach calculates
statistically averaged (Reynolds-averaged) variables for both steady-state and
dynamic flows and simulates turbulence fluctuation effect on the mean airflow by
using different turbulence models.
Despite the challenges associated with turbulence modelling, the RANS approach has
become very popular in modelling airflows in enclosed environment. Therefore,
RANS approach is chosen in this study to simulate the indoor air flows in the studied
Indoor Environmental Chamber ventilated with the combined ventilation systems.
The RANS models consist of two types: RANS Eddy-Viscosity models and RANS
Reynolds Stress models. The former include zero-equation models, one-equation
models, two-equation models such as k-ε models and k-ω models, and multi-
equation models. The k-εmodels are very popular, especially the standard k-εmodel,
the RNG k-ε model and the Realizable k-ε model. The standard k-epsilon model is
adopted to simulate the indoor air flow patterns. In previous numerical research, Gao
and Niu (2004) and Pantelic (2010) have used this model to simulate indoor air flow
based on the assumption that this model is capable of simulating convective heat
transfer of buoyancy-driven air flow as long as a reasonable value of Y+ is achieved.
The total number of cells is 6402744. Trial-and-error was necessary for proper
characterization of the boundary layers because the non-dimensional wall distance for
a wall-bounded flow Y+ can only be calculated after solving the flow field. Two
layers of uniform boundary layer cells were placed around the manikin’s body with
size of 0.0022 m and enhanced wall treatment was applied. The value Y+ was
approximately within 0.5-2 for most part across the body surface and around 3 to 4 for
small part at face area. This is acceptable since in practice, up to 4-5 is considered
acceptable as it is still inside the viscous sub layer.
Figure. 8.2 Contours of wall Y+
8.2.3 Boundary conditions
Another important factor is the boundary conditions since it may affect the
convergence as well as the correctness of results, especially the boundary conditions
of the ventilation openings in this study. The turbulence intensity can be achieved
from the experiments. The hydraulic diameter can be calculated from the shape of the
opening. However, the air diffusers are often complex due to the complex geometry
including curved surfaces, perforated plates, guided rails and other components. The
PV ATD, MV supply diffuser, DV supply air diffusers involved in this study are all
complex including two perforated openings and one four way diffuser, which has
been introduced in Chapter 3. Most frequently used methods for openings include: the
basic method, the momentum method, the box method and the prescribed velocity
method. For the four-way ceiling supply air diffuser, a simplified model (Cheong et al,
2001), as shown in Figure 8.3, is able to predict the air flow pattern accurately.
Figure 8.3. Models for the four way air diffuser
The boundary conditions at the re-circulated four way air diffuser are shown in Table
8.1.
Table 8.1: Boundary conditions for MV supply diffusers
Location
Velocity components (m/s)
Boundary
type
x
y
z
Four way air
diffuser 1
0
-1.821
3.17
Velocity inlet
Four way air
diffuser 2
3.17
-1.821
0
Velocity inlet
Four way air
diffuser 3
0
-1.821
-3.17
Velocity inlet
Four way air
diffuser 4
-3.17
-1.821
0
Velocity inlet
For RMP PV ATD and DV diffuser, a simplified box method is used to set the
boundary conditions. According to theory, as shown in Figure 8.4, the air flow region
out of perforated diffuser can be divided into three parts, the core zone (length x1),
the mixing zone (length x2) and the well-mixed zone (length x3). The air flow
velocity could be taken as uniform across a cross section in the well-mixed zone.
Based on the theory, the total length of the core zone and the mixing zone is about 40
times of the hole diameter on the perforated panel. Hence, in the simulation, the
opening panel of the RMP (hole diameter: 5 mm) is set in a new position 200 mm in
front of its original position. For the semi-circular DV diffuser, it is set as the surface
of another semi-circle, which has the same axis as the original one and a 200 mm
larger radius in the CFD model.
Figure 8.4 Air flow region out of perforated diffuser [Source: Li and Zhao (2009)]
Other detail boundary conditions are listed in Table 8.2
Table 8.2: Boundary conditions
Turbulence model
Standard k–epsilon model
Numerical Schemes
Upwind second-order difference;
PRESTO forpressure
Mixing ventilation inlet
Velocity inlet; Temperature = 23 °C; I
= 10%
Room air exhaust
Pressure outlet; Gauge pressure=0 Pa
Personalized exhaust
Pressure outlet
Room wall, floor and ceiling
Adiabatic wall
Manikin body
T =34°C
Mouth
Flow rate (L) = 8.4 l/min;
Turbulence Intensity (I) = 0.5%;
Hydraulic diameter (D) = 0.013 m
RMP air terminal device
Velocity inlet; I =10%; D =0.1 m
Chair
Adiabatic wall
8.3 Model validation
Since the top-PE performs better according to the results of experiments, it is selected
as the most optimal PV-PE configuration for evaluating the implication for energy
saving. In the model validation exercise, both top-PE and shoulder-PE are employed.
Figure 8.5 shows the sketch of the measured case and photo of the experiment room.
Figure 8.5 Sketch of the measured case and photo of the experiment room. (a)
Sketch of the measured Top-PE case (b) Sketch of the measured Shoulder-PE
case (c) Photo of the experiment room
The inputs of boundary conditions in CFD simulation are all taken from the
experiments. The concentrations of exhaled air at the mouth of the Numerical Infected
Manikin as well as at the mouth of the Numerical Healthy Manikin are the output
used for calculating the iF.
The simulated and experimental cases are listed in Table 8.3. The three cases are
selected because they consist of the two extreme flow rates (0 l/s and 20 l/s) and both
the two PE types.
Table 8.3 Model validation cases
Case
Ventilation mode
PV air flow rate (l/s)
PE type
PE flow rate (l/s)
1
Mixing ventilation
5
Top-PE
0
2
Mixing ventilation
5
Top-PE
20
3
Mixing ventilation
5
Shoulder-PE
20
Comparison of simulated and measured Intake Fraction (iF) and Personalized
Exposure Effectiveness are shown in Figure 8.6. It proves that the simulated
concentration of exhaled air at the mouth of healthy manikin correlates well with the
measured ones, and the value is quite close to the experimental data.
Figure 8.6 Comparison of iF and PEE between measured and simulated cases
0.00E+00%
1.00E'03%
2.00E'03%
3.00E'03%
4.00E'03%
5.00E'03%
6.00E'03%
Case%1% Case%2% Case%3%
Intake'fraction'
Simulated%
Measured%
0%
0.05%
0.1%
0.15%
0.2%
0.25%
0.3%
0.35%
0.4%
Case%1% Case%2% Case%3%
PEE'
Simulated%
Measured%
8.4 Parametric Variations and Results
In order to exhaust the exhaled contaminated air right around the infected person as
much as possible, a higher flow rate of PE could achieve better results. However,
considering the energy usage, a lower flow rate of PE is always preferred. In this case,
lower flow rate from 4 l/s to 9 l/s is simulated using the CFD model. 0 l/s of PE is also
modelled for the cases that PE is not used. The results are compared with the
experiments of PE at 10 l/s. In this simulation, only top-PE is considered since it is
more efficient than the shoulder-PE. Both MV and DV are also considered.
Table 8.4: Detailed parametric variations studied
PE for
Infected
Person
Top-PE
PE flow
rate (l/s)
0
4
5
6
7
8
9
PV flow
rate for
Healthy
Person
0
5
0
5
0
5
0
5
0
5
0
5
0
5
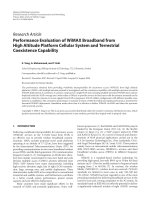
The results of iF are shown in Figure 8.7 and Figure 8.8. From these two Figures, for
the same flow rate for IP, the case with PV for HP has a slightly lower iF than the
case without PV. This indicates that the PV is helpful in reducing the amount of
exposure to the exhaled air, especially at lower flow rates of PE. With the increase of
PE flow rate up to more than 7 l/s, the advantage of PV is not so significant.
With MV, with the increase of flow rate from 4 l/s to 7 l/s, the reduction of iF is small.
From 7 l/s to 8 l/s, 8 l/s to 9 l/s as well as 9 l/s to 10 l/s, there is a larger drop of iF.
Both the two lines follow the same trend. With DV, at low flow rate of PE, the
decrease of iF is not obvious from 4 l/s to 6 l/s compared with the higher flow rates. A
more pronounced reduction is observed from flow rates from of 6 l/s to 7 l/s and from
8 l/s to 9 l/s.
Figure 8.7 iF with MV
Figure 8.8 iF with DV
8.5 Discussion
The general pattern observed in the plot is as follows: there is an initial significant
drop in iF when the flow rate is increased from 0 l/s. This is followed by a region
where no significant improvement in iF is noticed. The iF improves significantly
when the flow rate crosses a certain threshold. According to the trend of iF changes in
Figures 8.7 and 8.8, a higher flow rate is required with DV to achieve the same iF.
The flow rate to be applied in the real healthcare settings can be chosen according to
the target of the iF. With MV, the increase of flow rate from 4 l/s to 7 l/s cannot lead
to a much further reduction in iF, thus a lower flow rate is preferable if the target of iF
is relative high. From 7 ls/ to 10 l/s, the increase of flow rate can result in a quick drop
of iF. Thus, a higher flow rate is preferred if a low iF is required. With DV, the
increase of flow rate will achieve more reduction in iF. From 4 l/s to 6 l/s, the slope is
relative gentle, especially for the line with PV used for HP. From 6 l/s to 10 l/s, the
slope is steeper. Therefore, it is worthy increasing the flow rate from 6 l/s onwards if a
much lower iF is targeted.
The second point of energy saving implication of the PE system is that with a higher
flow rate (eg: 10 l/s), it can achieve a better infection control than using PV alone.
Furthermore, with the higher flow rate, the PV does not help much in terms of further
reducing the exposure of the HP to the exhaled contaminant. This implies that
comparing between using PV alone and using PE alone, the latter gives better results
and the energy consumption of PE can be compensated for not using the PV system.
Thirdly, further energy saving could be achievedwhen the fans are equipped with
occupancy sensors. This enables the exhaust motor and fans to be switched on or off
automatically when the Infected Person enters or leaves the room. However, the
energy saved might be insignificant. It might be only substantial when the presence
time of an Infected Person is short.
%