Novel magnonic crystals and devices fabrication, static and dynamic behaviors
Bạn đang xem bản rút gọn của tài liệu. Xem và tải ngay bản đầy đủ của tài liệu tại đây (8.91 MB, 214 trang )
NOVEL MAGNONIC CRYSTALS AND DEVICES:
FABRICATION, STATIC AND DYNAMIC
BEHAVIORS
DING JUNJIA
(M. Eng, Huazhong University of Science and Technology)
A THESIS SUBMITTED
FOR THE DEGREE OF DOCTOR OF PHILOSOPHY
DEPARTMENT OF ELECTRICAL AND COMPUTER
ENGINEERING
NATIONAL UNIVERSITY OF SINGAPORE
2013
DECLARATION
I hereby declare that this thesis is my original work and it has been written by
me in its entirety. I have duly acknowledged all the sources of information
which have been used in the thesis.
This thesis has also not been submitted for any degree in any university
previously.
____________________
Ding Junjia
7 January 2014
I
!
Acknowledgements
The final outcome of this thesis received a lot of guidance and assistance
from many people and I am extremely fortunate to have got this all along the
completion of my PhD study. While it is impossible to acknowledge all of those
people here, I will always remember them. I would like to acknowledge several
people in particular.
First and foremost, I would like to express my sincerest gratitude and
appreciations to my supervisor Prof. Adekunle O. Adeyeye for giving me the
opportunity to work on this topic. Without his unwavering dedication,
encouragement, support and guidance in all aspects varying from research to
personal life, it is impossible for me to finish this thesis in four years. Thanks
Prof. Adekunle for his time to read, modify and comment on all my previous
research papers and several versions of this thesis.
I would like to give special thanks to Prof. Mikhail Kostylev from the
University of Western Australia for his great help in the theory work of 1-
Dimensional Magnonic Crystals and for his reading and comments on my thesis.
I would also like to express my appreciation towards ISML lab supervisor
Assoc. Prof. Vivian Ng, lab officers Ms. Loh Fong Leong, Mr. Alaric Wong and
Ms. Xiao Yun for their help and support during my candidature.
It has been a delight to work with the current and past members of Prof.
Adekunle’s group and ISML: Dr. Shikha Jain for teaching me all the
nanofabrication skills and helping in setting up the Ferromagnetic Resonance
spectroscopy. Dr. Tripathy Debashish who taught me film deposition technique
and helped me for the antidot papers. Dr. Navab Singh from the Institute of
Microelectronics for providing the deep ultra violet resist patterns used in this
thesis. Dr. Ren Yang and Mr. Liu Xinming for their help in magnetooptical kerr
effect measurement. Mr. Shimon Goei for his help in OOMMF simulation and
Acknowledgements
II!
!
tasty coffee. Dr. Naganivetha Thiyagarajah and Dr. Wu Baolei for their help in
EBL process. Dr. Shyamsunder Regunathan for his help in SEM. I would also
like to thank Dr. Xin Yi, Ms. Ria, Ms. Chen Ji, Dr. Borja, Dr. Dezheng, Dr.
Xuepeng, Dr. Ajeesh, Dr. Sankha, Mr. Kaushik, Mr. Sagaran, Mr. Siddharth, Mr.
Jae-Hyun, Mr. Wang Ying and Dr. Lu Hui for all the enjoyable moments we
have shared in ISML.
In addition to the people already mentioned, friends and colleagues outside
of ISML have also made my time as a PhD candidate a rich and memorable one.
Thanks to all my friends for their help and encouragement.
I would like to thank my entire family and all my friends in China for all
their support, faith and advice during my stay in Singapore. Lastly, but not least,
I would like to thank Ms. Guo Li for her endless support and encouragement
over the last two years.
III
!
Table of Contents
Acknowledgements I!
Table of Contents III!
Summary VII!
List of Figures X!
List of Symbols and Abbreviations XIX!
Statement of Originality XXI!
Chapter 1 Introduction 1!
1.1! Background 1!
1.2! Motivation 3!
1.1.1.! 1-D MCs 4!
1.1.2.! 2-D MCs 5!
1.1.3.! Binary MCs 6!
1.1.4.! Applications of MCs 7!
1.3! Focus of Thesis 9!
1.4! Organization of Thesis 10!
Chapter 2 Theoretical Background 11!
2.1! Introduction 11!
2.2! Magnetization Reversal in Ferromagnetic Nanostructures 11!
2.2.1! Magnetic Energies in Nanostructures 12!
2.2.2! Magnetization Reversal in Ferromagnetic Nanowires 14!
2.2.3! Magnetization Reversal in a Ferromagnetic Antidot Array 16!
2.2.4! Magnetization Reversal in a Ferromagnetic Nanomagnet . 19!
2.3! Ferromagnetic Resonance Phenomenon 21!
2.3.1! Theory of Ferromagnetic Resonance 21!
2.3.2! Dynamic Micromagnetism Simulation Method 25!
Table of Contents
IV!
!
2.4! Summary 26!
Chapter 3 Experimental Details 28!
3.1! Introduction 28!
3.2! Patterning Techniques 28!
3.2.1! Ultraviolet (UV) Photolithography 28!
3.2.2! Deep Ultraviolet Lithography (DUL) 30!
3.2.3! Electron Beam Lithography (EBL) 32!
3.3! Deposition Techniques 35!
3.3.1! Electron-Beam Evaporation and Sputtering 35!
3.3.2! Self-aligned Shadow Deposition 37!
3.3.3! Lift-Off Process 42!
3.4! Characterization Techniques 42!
3.4.1! Scanning Electron Microscope 42!
3.4.2! Scanning Probing Microscope 44!
3.4.3! Magneto-Optical Kerr Effect 45!
3.4.4! FMR Spectroscopy 47!
Chapter 4 1-Dimensional Magnonic Crystals 50!
4.1! Introduction 50!
4.2! Homogeneous-width Nanowire Arrays 50!
4.2.1! Variation of the Width of Isolated Nanowires 52!
4.2.2! Homogeneous Width Arrays of Dipole-coupled Wires 59!
4.3! Alternating-width Nanowire Arrays 62!
4.3.1! Ferromagnetic Ground State 65!
4.3.2! Anti-ferromagnetic Ground State 67!
4.3.3! Tunable Disorder State 79!
4.4! Summary 87!
Chapter 5 2-Dimensional Magnonic Crystals 89!
5.1! Introduction 89!
Table of Contents
V!
!
5.2! Variation of Hole Diameter of Nanoscale Antidot Arrays 90!
5.3! Antidot Array with Alternating Hole Diameters 95!
5.4! Ni
80
Fe
20
Anti-ring Nanostructures 106!
5.4.1! 30 nm-thick Anti-ring Array 108!
5.4.2! Effect of the Nanostructure Thickness 113!
5.5! Summary 123!
Chapter 6 Binary Magnonic Crystals 124!
6.1! Introduction 124!
6.2! Ni
80
Fe
20
Nanomagnets 124!
6.2.1! Isolated Ni
80
Fe
20
Nanomagnets 127!
6.2.2! 1-Dimensional Linear Chain of Ni
80
Fe
20
Nanomagnets 130!
6.3! Binary Nanomagnets 132!
6.3.1! Static Magnetic Properties 133!
6.3.2! Effects of Magnetostatic Coupling 140!
6.3.3! Dynamic Properties 142!
6.4! Summary 146!
Chapter 7 Magnonic Logic Applications 147!
7.1! Introduction 147!
7.2! Magnetic Logic Based on a Meander-type Ni
80
Fe
20
Nanowires
Arrays 147!
7.2.1! Experimental Details 148!
7.2.2! Dynamic Response of the Device 150!
7.2.3! Realization of XOR and NOT Logic Operation 157!
7.3! Binary Nanomagnets for Logic Applications 159!
7.3.1! Experimental Details 159!
7.3.2! Magnetic Response of the Binary Nanomagnets 160!
7.3.3! Manipulating the Magnetic Ground States 166!
7.4! Summary 169!
Table of Contents
VI!
!
Chapter 8 Conclusion 171!
8.1! Overview 171!
8.2! Summary of Results 171!
8.3! Future Work 174!
References 176!
Appendix 186!
Journal Publications 186!
Conference Proceedings 189!
VII
!
Summary
In the last decade, magnonic crystals (MC), conceived as the magnetic
analogue of photonic crystals, have attracted a lot of interest due to their
potential use in a wide range of applications such as microwave resonators,
filters and spin wave logic devices.
There are many challenges that need to be addressed before the full
potential of MC based devices is realized, such as the lack of a systematic
investigation of dynamic responses in tailored ferromagnetic nanowire (NW)
arrays (1-Diemsional MCs) and 2-Dimensional (2-D) MCs, the method of
fabrication of bi-component magnonic crystals consisting of two contrasting
ferromagnetic materials and the application of the MCs in logic schemes. In this
thesis, a comprehensive study of the static and dynamic magnetic properties of
various types of MCs is presented.
Firstly, the properties of tailored 1-D MCs consisting of NWs with different
configurations have been systematically investigated. Alternated arranged
nanowires with two different widths have been introduced to control the
magnetization ground state in the MCs. By comparing to the normal nanowires
array with a stripe width uniform across the whole array, a perfect antiparallel
magnetization state has been realized in the presented engineered nanowires.
We have imaged directly the parallel magnetization and anti-parallel
magnetization ground states using magnetic force microscopy. A simple
analytical model has been suggested to explain the experimental data.
Secondly, a systematic investigation of the static and dynamic response of
2-D MCs constituted by an antidot and an anti-ring array has been performed.
For a homogeneous antidot array with square lattice geometry, two main
resonancemodeswereobservedforthefieldappliedalongthelatticeedge.It is
also observed that the frequencies of all modes can be systematically tuned by
Summary
VIII!
!
varying the antidot diameter. A new design of antidot arrays with alternating
“hole” diameters has been introduced to further control the spin wave (SW)
modes in the MCs. The resonance modes and profiles are markedly modified
due to the existence of modulated demagnetizing field distributions. In anti-ring
arrays, it was observed that the FMR response of the anti-rings is highly
sensitive to the nanostructure magnetization state for a fixed film thickness. The
dynamic behavior of the surrounding rectangular antidot can be modified by
controlling the magnetization state of the central elliptical nanomagnet. It was
also found that both static and dynamic responses of the structure are adjustable
by changing the film thickness. The MOKE and MFM results show that the
central nanomagnets remain in the saturated state for smaller sample thicknesses,
while a multi-domain state or vortex state can be observed for thicker
nanostructures.
Thirdly, a “self-alignedshadowdeposition”technique has been introduced
to fabricate bi-component MC consisting of two contrasting ferromagnetic
materials (binary MC). High-quality Ni
80
Fe
20
/Ni
80
Fe
20
and Ni/Ni
80
Fe
20
binary
elliptical nanostructures arranged in three different configurations were
prepared using a simple self-aligned shadow deposition method. We have also
demonstrated that our technique can be applied to other structures, such as
binary and thickness modulated nanowires. The static and dynamic properties
of the binary MCs were investigated using a combination of MOKE and
broadband FMR spectroscopy. We showed that the magnetization reversal
mechanism can be systematically controlled in the Ni
80
Fe
20
/Ni
80
Fe
20
and
Ni/Ni
80
Fe
20
binary structures for tailor-made applications. We directly
confirmedthemagnetization states of the structures at various field histories
using the magnetic force microscopy. Moreover, our micromagnetic simulations
are in very good agreement with the experimental results.
Lastly, this thesis proposes two logic designs based on nanoscale
Summary
IX!
!
reconfigurable MCs. Multiple magnetic ground states can be achieved in one
MC by changing the amplitude and/or the angle of applied field. The first design
is based on 1-D MCs; two logic states have been formed and detected in a
meander-type ferromagnetic nanowires array using a microwave-DC hybrid
system. A multi-cluster magnetic groundstateisformedwhennocurrentflows
in the signal line, while a perfect AFM ground state is energetically preferable
when the two input values are not same. Functionalities of XOR and NOT gates
have been demonstrated based on this phenomenon. A method of detection of
the logic state has been proposed which is based on the reconfigurable
microwave filter capability of εC. The second design is based on binary
nanostructures. We demonstrate the functionality of Ni
80
Fe
20
/Ni binary
nanostructures cells fabricated using the self-aligned shadow deposition
technique in logic applications. Depending on the magnetic ordering of the cells,
distinct dynamic states probed by broadband ferromagnetic resonance
spectroscopy are realized. We show that the magnetic ordering can be
manipulated to achieve logic operations by controlling the amplitude and the
orientation of reset fields. This proposed logic cell may be useful for
downscaling magnonic logic devices.
X
!
List of Figures
Fig. 1.1 ! Typical SEM images of (a) 1-D, [2] (b) 2-D [3] and (c) 3-D [4] PCs.
Typical SEM images of (e) 1-D [6] and (f) 2-D [7] MCs. Typical
band structures of PCs [5] and MCs [6] are shown in (d) and (g),
respectively. 1!
Fig. 2.1 ! Sketch of an ellipsoid. 13!
Fig. 2.2 ! (a)Thesketchofananowirewith10mlength(l),γ00nmwidth(w)
and 30 nm thickness (t). (b) The hysteresis loop of the nanowire when
the field is applied along X-axis. (c) the sketch of the magnetization
direction for different states. 15!
Fig. 2.3 ! (a) The sketch of an antidot array. (b) The simulated hysteresis loop
of the antidot array. The magnetization states for H
app
= 1500 Oe,
1000 Oe, 500 Oe, 0 Oe, –250 Oe and –400 Oe are shown in (a), (c),
(d), (e), (f), (g) and inset of (b), respectively. 17!
Fig. 2.4 ! (a)The simulated hysteresis loop of the isolated nanomagnet. The
sketch of the nanomagnet is shown as the left inset. The
magnetization states for H
app
= 1500 Oe, 200 Oe, 0 Oe, –20 Oe, –
200 Oe and –300 Oe are shown as the right inset of (a), (b), (c), (d),
(e) and (f), respectively. 20!
Fig. 2.5 ! (a) The experimental (blue dots) and calculated (black line) field
dependence of FMR frequency of a 30 nm thick Ni
80
Fe
20
continuous
film. (b) the experimental (blue dots) and fitted (black line) field
dependence of FMR frequency of a Ni
80
Fe
20
nanowire with 240 nm
width,10mlengthandγ0nmthickness. 24!
Fig. 2.6 ! (a) Excitation pulse field along Y-axis and (b) magnetization
response of the system along Z-axis as a function of time. (c)
Simulated FMR absorption of a Ni
80
Fe
20
triangular ring for H
app
=
–1500 Oe. The SEM image of the triangular ring is shown as the
inset. 26!
Fig. 3.1 ! The sketch of the UV photolithography process. It includes the three
main steps: (I) photoresist coating, (II) exposure and (III)
development. 29!
Fig. 3.2 ! Comparison of the normal mask and the alternating phase shift mask
(ALT PSM) for DUV lithography process. 31!
List of Figures
XI!
!
Fig. 3.3 ! The sketch of the Electron Beam Lithography (EBL) process. Three
main steps: (I) EBL Resist Coating, (II) E-Beam Writing and (III)
Development. 34!
Fig. 3.4 ! Sketch of the E-beam evaporation and sputtering hybrid thin film
deposition system. In the actual system, the six magnetron sputter
sources are circularly distributed under the substrate with a small
slant angle (around 15°). 36!
Fig. 3.5 ! SEM images of the surface profile of the patterned resist of an array
of ellipsoidal nanostructures: (a) configuration A, (CNF A) (b)
configuration B (CNF B), and (c) configuration C (CNF C). 38!
Fig. 3.6 ! Sketch of the modified E-beam evaporation system with a tilt-table
sample holder. 39!
Fig. 3.7 ! (a-b) schematics of the self-aligned shadow deposition method. (c)
sketch of the final binary structure. 40!
Fig. 3.8 ! SEM images of the (a) isolated Ni/Ni
80
Fe
20
binary structures and
magnetically coupled Ni/Ni
80
Fe
20
binary structures with (b) CNF B
and (c) CNF C. The magnified SEM images of (a) and (b) are shown
in (d) and (e), respectively. Binary nanostructure with big overlay
area for CNF A and CNF B are shown in (f) and (g),
respectively. 40!
Fig. 3.9 ! The SEM micrographs of the (a) normal NWs, (b) binary NWs and
(c) thickness modulated NWs, respectively. The corresponding
schematic illustration of the NW structures are shown in (d-f)
respectively. 41!
Fig. 3.10 ! Schematic of the SEM system. 43!
Fig. 3.11 ! sketch of the working principle of a SPM system. 45!
Fig. 3.12 ! Sketch of a longitudinal MOKE setup 46!
Fig. 3.13 ! Sketch of the FMR spectroscopy with a microstrip board. 48!
Fig. 3.14 ! Sketch of the FMR spectroscopy with a coplanar wave guide. 49!
Fig. 4.1 ! (a) SEM image of the CPW (the SEM of 30-nm-thick Ni
80
Fe
20
NWs
with width w = 120 nm and interwire spacing s = 180 nm is shown
as an inset). SEM images of homogenous NWs with (b) w = 240 nm;
s = 360 nm, (c) w = 380 nm; s = 570 nm, (d) w = 540 nm; s = 810
List of Figures
XII!
!
nm, (e) w = 540 nm; s = 120 nm, and (f) w = 540 nm; s = 80
nm. 51!
Fig. 4.2 ! (a) FMR spectra for sparse homogeneous width nanowire arrays
with w = 120 nm, 240 nm and 540 nm and s = 1.5×w at remanence
(H
app
= 0). (b) FMR frequency at remanence as a function of the wire
width. 53!
Fig. 4.3 ! (a) The respective field dependencies of the FMR frequency for w =
120 nm, 240 nm and 540 nm. (b) Effective demagnetizing factors
extracted experiment and calculation. (c) The experimental and
calculated switching field of the nanowire arrays as a function of the
wire width. 54!
Fig. 4.4 ! 2-D absorption spectra of homogeneous-width nanowire arrays.
Wire width is 540 nm. Wire separations are: (a) s = 810 nm, (b) s =
120 nm and (c) s = 80 nm. The MOKE results for s = 80 nm is shown
in (d). The representative FMR spectra for this geometry are shown
for H
app
= 0 Oe in (e) and for H
app
= 120 Oe in (f). Filled squares:
calculation with the values of effective demagnetizing factors
obtained using the theory in [112]. 59!
Fig. 4.5 ! SEM images of coupled alternating NWs arrays with (a) w
0
= 200
nm; w
a
= 240 nm, (b) w
0
= 200 nm; w
a
= 380 nm, and (c) w
0
= 200
nm; w
a
= 540 nm. 62!
Fig. 4.6 ! 2-D absorption spectra and MOKE results for alternating-width
nanowire arrays with different differences in width between the wide
and narrow wires: (a)
F
w = 340 nm, (b)
F
w = 180 nm and (c)
F
w =
40 nm. Shown in (d) are the sketches of different magnetization states
for NWs corresponding to the field range shown in (a). The MFM
images of the FM and AFM ground states are shown in (e) and (f),
respectively. 63!
Fig. 4.7 ! (a) Field dependence of FMR frequency for alternating-width
nanowire arrays for the ferromagnetic magnetic ground state as a
function of
F
w. (b) FMR spectra of FM ground state for coupled
homogeneous width NW array with w = 160 nm, 200 nm, 240 nm,
alternating (AW) NW arrays with
F
w =
/
40 nm and 40 nm for H
app
= 0 Oe. 66!
Fig. 4.8 ! Minor-loop (backward half) absorption spectra of alternating
nanowire arrays with (a)
F
w = 340 nm, and (b)
F
w = 40 nm. (c)
List of Figures
XIII!
!
Field dependence of FMR frequency for alternating nanowire arrays
with AFM order ground state as a function of
F
w. 68!
Fig. 4.9 ! (a) Minor-loop absorption spectra of alternating nanowire array
with
F
w = 0 nm. (b) The MFM images of the NWarray at remanent
state. 69!
Fig. 4.10 ! (a) FMR spectra of AW NW arrays (
F
w = 40 nm) with FM order
ground state (f
0,FM
, blue triangles) and AFM ground state (f
0,AFM
, red
dots). (b) f
0,FM
, f
0,AFM
and
F
f
0
= f
0,FM
- f
0,AFM
as a function of
F
w. 69!
Fig. 4.11 ! The black triangles and the blue circles are the experimental FMR
dispersion of isolated NW array with w = 240 nm and 200 nm
respectively. The thin extended lines are the fittings using Kittel’s
equation. The red squares are minor-loop experimental results for
an array of dipole-coupled alternating-width nanowire array
consisting of wires of the same width (w
1
= 240 nm and w
2
= 200
nm). The red lines are the calculated dispersion for the FM state
(thin solid line) and for the AFM one (thick solid line is for the
acoustic mode, thick dash line is for the optical mode). The thick and
thin red dash-dotted lines are calculations for v
12
= v
21
= 0. 74!
Fig. 4.12 ! (a) SEM image of the alternating width NW array (w
1
= 260 nm, w
2
= 220 nm and inter-wire spacing s = 60 nm). (b): Full loop 2D FMR
absorption spectra for the array. (c): Normalized M-H loop for the
array. 80!
Fig. 4.13 ! FMR absorption spectra inside the minor loops with (a) H
max
= 128
Oe, (b) 163 Oe, (c) 177 Oe, (d) 192 Oe, (e) 199 Oe and (f) 220 Oe.
Inset to (d): example of 1D simulation. 81!
Fig. 4.14 ! MFM images for the (a) H
max
= 128 Oe, (b) 163 Oe, (c) 177 Oe, (d)
192 Oe, (e) 199 Oe and (f) 220 Oe at remanence. The Fourier
transforms of the MFM data is shown on the right side of
corresponding MFM images. 82!
Fig. 4.15 ! Frequency of the fundamental mode at remanence (a) and the ratio
r
0
/r
1
(b) as a function of H
max
. 83!
Fig. 4.16 ! (a)–(c): The magnetic ground states for H
max
= 163 Oe, 177 Oe and
192 Oe, respectively. (d)–(f): the respective calculated profiles of
dynamic magnetization. Red solid line: AFM mode; blue dashed line:
FM mode. A 1D numerical model has been used in this
List of Figures
XIV!
!
calculation. 85!
Fig. 5.1 ! SEM images of homogeneous antidot array (a) D1, (b) D2, (c) D3,
and(d)D4inwhichthepitchisfixedat415nmanddiametersare
varied as d
D1
= 265 nm, d
D2
= 220 nm, d
D3
= 185 nm, and d
D4
= 145
nm, respectively. 90!
Fig. 5.2 ! FMR spectra of D1, D2, D3 and D4 for H
app
= 2000 Oe. The satellite
peaks are indicated as dashed arrows. The higher frequency mode
for D4 is splits into two modes as indicated by the solid arrows. 91!
Fig. 5.3 ! (a) MagneticfielddispersionsofFMRfrequencyofD1,DβandDγ.
(b)Comparisonofexperimentalandsimulatedfielddispersionsof
FMR frequency of D3. The inset in (a) is the simulated magnetization
state at remanence for D3. The top and bottom left insets in (b) are
the simulated spin precession amplitudes of mode A and mode B at
1000Oe,respectively.Thebrightareareflectsahighspinprecession
amplitude, whereas the dark area corresponds to zero amplitude.
The bottom right inset in (b) is the simulated FMR spectra of D3 for
H
app
= 2000 Oe. The satellite peaks are indicated by the dashed
arrows. 92!
Fig. 5.4 ! (a) SEM image of the alternating antidot array with d
1
= 300 nm
and d
2
= 150 nm, and a 425 nm center-to-center spacing between
twoadjacent“holes”.(b)thesketchofthesamplewithaintegrated
CPW. 96!
Fig. 5.5 ! FMR absorption traces of antidots with varying H
app
. Four different
modes can be observed in the curves as indicated by the A, B, C and
D. 96!
Fig. 5.6 ! (a) Magnetization state and (b) divergence of magnetization
distribution of the engineered antidot array obtained from
simulations for H
app
=
/
1000 Oe. 97!
Fig. 5.7 ! (a) Simulated demagnetizing field distribution of the antidot array
for H
app
=
/
1000Oe.Demagnetizingfieldprofilesalong(b)line“I”
and(c)line“II”. 98!
Fig. 5.8 ! (a) Magnetization state and (b) divergence of magnetization
distribution of the engineered antidot array obtained from
simulations for H
app
=
/
100 Oe. 100!
Fig. 5.9 ! (a) Simulated demagnetizing field distribution of the antidot array
List of Figures
XV!
!
for H
app
=
/
100Oe.Demagnetizingfieldprofilesalong(b)line“I”
and(c)line“II”. 101!
Fig. 5.10 ! The simulated FMR spectra of the engineered antidot structure are
shown in (a) and (b) for H
app
=
/
1000 Oe and –100 Oe, respectively.
The spatial distribution of spin precession amplitudes of different
modes are shown as insets in (a) and (b). 102!
Fig. 5.11 ! The expeimental and simulated 2-D absorption spectra are shown in
(c) and (d), respectively. The position of H
app
= –1000 Oe and –100
Oe are indicated by the two dashed lines in the figures. 103!
Fig. 5.12 ! Simulated magnetization states of homogeneous antidot array (a)
withoutthesmall“holes”and(b)withreducedbig“holes”forH
app
= –1000 Oe. The corresponding demagnetizing field distributions
are shown in (c-d). The simulated FMR spectra are shown in (e) and
(f) for H
app
= –1000 Oe for the two homogeneous antidot structures,
respectively. The spatial distribution of spin precession amplitudes
of different modes are shown as insets in (e) and (f). 104!
Fig. 5.13 ! SEM image of 30 nm thick Ni
80
Fe
20
anti-ring arrays. 107!
Fig. 5.14 ! The measured (a) and simulated (b) M-H loops for 30 nm thick
Ni
80
Fe
20
anti-ring array. The saturated magnetization state for H
app
=
/
1000 Oe and 1000 Oe are shown as the left and right insets of
(b), respectively. The simulated magnetization states for H
app
= –300
Oe, 0 Oe, 200 Oe and 300 Oe are shown in (c). 108!
Fig. 5.15 ! The experimental (a) and simulated (c) FMR absorption traces of
the anti-ring array with varying H
app
. The experimental (b) and
simulated (d) 2-D absorption spectra. (e) The simulated spatial
distributionsofspinprecessionamplitudesofModesA,A’,BandC.
The distributions for Modes A, B and C are shown for H
app
=
/
1000
Oe(firstthreefigures)andforModeA’forH
app
= 0 Oe (the fourth
figure). 110!
Fig. 5.16 ! Experimental (a) and Simulated (b) M-H loops for the anti-ring
arrays with different film thickness. 114!
Fig. 5.17 ! The MFM images of the remanent magnetization state of the anti-
ring arrays with differerent film thickness: (a) 8 nm, (b) 23 nm, (c)
30 nm and (d) 40 nm. 116!
Fig. 5.18 ! (a) FMR spectra for anti-ring arrays with t = 8 nm, 15 nm, 23 nm,
List of Figures
XVI!
!
30 nm and 40 nm at H
app
=
/
1000 Oe. (b) The extracted
experimental and simulated resonance frequencies for different
modes as a function of thickness at H
app
=
/
1000 Oe. 118!
Fig. 5.19 ! (a) FMR spectra for anti-ring arrays with t = 8 nm, 15 nm, 23 nm,
30 nm and 40 nm at H
app
=
2"
Oe. (b) The spatial distribution of spin
precessionamplitudesforModesBandA’atH
app
=
2"
Oe. 119!
Fig. 5.20 ! The experimental 2-D absorption spectra of anti-ring arrays with t
= 8 nm (a) and 40 nm (b). 120!
Fig. 5.21 ! Simulated Magnetization state of the (a)anti-ring, (b)anti-rectangle
and (c)ellipse for 30 nm film thickness when H
app
= –1000 Oe. (d)
The internal field value in different areas of anti-ring and anti-
rectangle structure as a function of the film thickness for H
app
= –
1000 Oe. (e) The stray field in different areas of the ellipse array as
a function of the film thickness for H
app
= –1000 Oe. 121!
Fig. 6.1 ! (a) Structure of the sample and field configuration of the
measurement for = 0°. Representative microwave absorption
curves measured on (b) continuous film, (c) isolated elements and (d)
coupledelementsfor=0°. 125!
Fig. 6.2 ! Field dependence of FMR frequency on isolated ellipsoidal
nanomagnets for (a) = 0° and (c) = λ0°. The corresponding
hysteresis loops of isolated elements are shown in(b)and(d)for
=0°and=λ0°respectively. 127!
Fig. 6.3 ! Field dependence of FMR frequency for coupled ellipsoidal
nanomagnetsfor(a)=0°and(c)=λ0°.ThecorrespondingM-
Hloopsforcoupledelementsareshownin(b)and(d)for=0°and
=λ0°respectively. 130!
Fig. 6.4 ! SEM images of the resulting Ni
80
Fe
20
nanostructures for the three
configurations. 133!
Fig. 6.5 ! Hysteresis loops of (a) Ni
80
Fe
20
nanostructures, (b)
Ni
80
Fe
20
/Ni
80
Fe
20
binary structures and (c) Ni/Ni
80
Fe
20
binary
structures. 134!
Fig. 6.6 ! The MFM image of the remnant state (a) Ni
80
Fe
20
nanostructures,
(b) Ni
80
Fe
20
/Ni
80
Fe
20
binary structures and (c) Ni/Ni
80
Fe
20
binary
structures. (d)MFM image of the Ni/Ni
80
Fe
20
binary structure for
H
max
= 250 Oe at remanence (g). 136!
List of Figures
XVII!
!
Fig. 6.7 ! The simulated hysteresis loops for individual (a) Ni
80
Fe
20
nanostructure, (b) Ni
80
Fe
20
/Ni
80
Fe
20
binary structure and (c)
Ni/Ni
80
Fe
20
binary structure. The simulated magnetization states
corresponding to positions (i-iii) on the M-H for the three structures
are shown in (d), (e) and (f) respectively. 137!
Fig. 6.8 ! Simulated M-H loop for isolated Ni sub-element, isolated Ni
80
Fe
20
sub-element, Ni/Ni
80
Fe
20
nanostructure as a function of a gap size
(g). 139!
Fig. 6.9 ! A comparison of the M-H loops for Ni
80
Fe
20
nanostructure,
Ni
80
Fe
20
/Ni
80
Fe
20
and Ni/Ni
80
Fe
20
binary nanostructures for
configurations (a-c) CNF B and (d-f) CNF C when the field is
applied along the ellipse major axis. 141!
Fig. 6.10 ! Representative FMR absorption traces of isolated (a) Ni
80
Fe
20
nanostructures, (b) Ni
80
Fe
20
/Ni
80
Fe
20
binary nanostructures and (c)
Ni/Ni
80
Fe
20
binary nanostructures for varying H
app
values. The
corresponding 2-D absorption spectra for the three structures are
shown in (d), (e) and (f), respectively. 143!
Fig. 7.1 ! (a) SEM image of the CPW line and of two meander-type nanowires
arrays (inset). (b) Blow-up SEM image of the structure (width w =
160 nm, edge-to-edge separation g = 80 nm, length l = 10 µm) (c)
The sketch of the AC-DC hybrid measurement system. 149!
Fig. 7.2 ! FMR measurement results of the structure with (a) full loop
measurement when In
A
= In
B
=‘0’;(b)minor-loop (backward half)
measurement when In
A
= In
B
=‘0’;(c) MFM image results of the
structure taken at remanence after saturating the structure in the
field H
app
= –1000 Oe when both In
A
and In
B
aresetas‘0’.TheMFM
images of the multi-cluster ground state of the structure for (d) area
A and (e) area B. (f) Blow-up image of area B. 151!
Fig. 7.3 ! (a) full loop measurement when In
A
=‘1’,In
B
=‘0’;(b)minor-loop
(backward half) measurement when In
A
= ‘1’, In
B
= ‘0’. The
spectrum for H
app
= 284 Oe are shown in the right-hand part of the
full loop measurement results. The spectrum for H
app
= 0 Oe are
shown in the right-hand part of the minor-loop measurement results.
(c) The MFM image of perfect AFM ground state of the structure for
area B. (d) Blow-up image of area B. 153!
Fig. 7.4 ! Simulation results of the magnetization ground state of the structure.
List of Figures
XVIII!
!
(a) H
app
= 0 Oe, H
y
= 0 Oe; (b) H
app
= 400 Oe, H
y
= 0 Oe; (c) H
app
= 0 Oe, H
y
= 50 Oe; (d) H
app
= 400 Oe, H
y
= 50 Oe. The structure
was first saturated along –X direction. A four-color color scheme is
used to represent different magnetization directions. 155!
Fig. 7.5 ! (a) XOR truth table. (b) The normalized spectrum for H
app
= 284 Oe
with different input values. (c) The interpretation of the measurement
results agrees with the XOR truth table (a). 157!
Fig. 7.6 ! SEM image of the binary nanostructure array. 160!
Fig. 7.7 ! (a) Experimental M-Hloopsofthebinaryfor=0º.MFMimages
of the array for saturated state (along –X direction) (b) and anti-
parallel magnetic state (c). (d) The simulated full hysteresis loop of
the Ni/Ni
80
Fe
20
with a 5 nm gap (solid line) and without the gap
(dashed line) separating the elements. The simulated magnetization
states corresponding to positions (I-III) on the hysteresis loop are
shown as insets. 161!
Fig. 7.8 ! (a) Representative absorption curves of the Ni/Ni
80
Fe
20
nanostructure as a function of H
app
for saturated state. (b)
Experimental 2-Dfullloopabsorptionspectraofthebinaryfor=
0º. (c) Representative absorption curves of the Ni/Ni
80
Fe
20
nanostructure as a function of H
app
for anti-parallel magnetic state.
(d) backward half of the minor loop FMR measurement results. 164!
Fig. 7.9 ! (a-d) The remanence resonance frequency versus reset field
orientation
s
as a function of H
re
amplitude. (e) Sketches of different
magnetization states for binary corresponding to the reset field
orientation shown in (a-d). (f) The simulated angular dependent
remanence magnetization for H
re
= –1400 Oe. 167!
Fig. 7.10 ! Simulated |M
x
| when H
app
is swept from –1500Oeto1500Oefor
= 90º with (a) H
x
= 0 Oe and (b) 50 Oe. The simulated remanence
magnetizationfor=λ0ºwith(c)H
x
= 0 Oe and (d) 50 Oe. 168!
Fig. 8.1 ! Sketches of the normal nanomagnet, Ni/Fe binary nanomagnet and
the proposed compositional gradient nanostructure. 174!
XIX
!
List of Symbols and Abbreviations
AFM antiferromagnetic
ALT PSM alternating phase shift mask
AW Alternating width
BLS Brillouin light scattering
BARC bottom anti-reflection coating
CPW coplanar waveguide
DUV deep ultraviolet
EBL electron beam lithography
E
ex
exchange energy
E
a
anistropy energy
E
ms
magnetostatic energy
E
z
Zeeman Energy
e-beam electrons beam
FFT fast Fourier transform
FM ferromagnetic
FMR ferromagnetic resonance
G-S-G ground-signal-ground
H
app
applied static magnetic field
H
sat
saturation field
H
max
maximal field
h
f
microwavemagneticfield
IPA isopropanol
MC magnonic crystal
MFM magnetic force microscopy
MOKE magneto-optical Kerr effect magnetometer
MOSFET metal-oxide-semiconductor field effect transistor
List of Symbols and Abbreviations
XX!
!
M
s
saturation magnetization
NW nanowire
N
x
, N
y
and N
z
demagnetizing factors
PBC periodic boundary conditions
PC photonic crystal
SEM scanning electron microscope
SPM scanning probing microscope
SW spin wave
UV ultraviolet
VNA vector network analyzer
VSM vibrating sample magnetometer
YIG yttrium iron garnet
1-D one dimension
2-D two dimension
3-D three dimension
gyromagnetic ratio
XXI
!
Statement of Originality
The author claims the following aspects of this thesis to be original
contributions to scientific knowledge.
‚ A systematic investigation of the properties of tailored 1-Dimensional MCs
consisting with different configurations. Alternating width nanowires with
two differential widths have been introduced to control the magnetization
ground state in the MCs.
[1] J. Ding, ε. Kostylev and A. O. Adeyeye. “εagnonic Crystal as a
εedium with Tunable Disorder on a Periodical δattice” Physical
Review Letters, 107, 047205 (2011).
[2] J. Ding, ε. Kostylev and A. O. Adeyeye. “εagnetic Hysteresis of
Dynamic Response of One-Dimensional Magnonic Crystals
Consisting of Homogenous and Alternating Width Nanowires
Observed with Broadband Ferromagnetic Resonance” Physical
Review B, 84, 054425 (2011).
‚ A systematic investigation of the static and dynamic response of 2-D MCs
constituting of antidot and an anti-ring array.
[3] J. Ding,D.TripathyandA.O.Adeyeye.“EffectofAntidotDiameter
ontheDynamicResponseofNanoscaleAntidotArrays” Journal of
Applied Physics, 109, 07D304 (2011).
[4] J. Ding, D. Tripathy and A. O. Adeyeye. “Dynamic Response of
Antidot Nanostructures with Alternating Hole Diameters”
Europhysics Letters, 98, 16004 (2012).
[5] J. Ding, N. Singh, ε. Kostylev and A. O. Adeyeye. “Static and
Dynamic Magnetic Properties of Ni
80
Fe
20
Anti-ring Nanostructures”
submitted to Physical Review B, 88, 014301 (2013).
‚ Development of a novel “self-aligned shadow deposition” technique to
Statement of Originality
XXII!
!
fabricate bi-component MC consisting of two contrasting ferromagnetic
materials. High-quality nanostructures consisting of one material and bi-
component (binary) nanomagnet have been fabricated and systematically
investigated.
[6] J. Ding,S.JainandA.O.Adeyeye,“StaticandDynamicPropertiesof
One-DimensionalδinearChainofNanomagnets”Journal of Applied
Physics, 109, 07D301 (2011).
[7] J. Ding and A. O. Adeyeye. “Binary Ferromagnetic Nanostructures:
Fabrication, Static and Dynamic Properties” Advanced Functional
Materials, 23, 1684 (2013).
‚ Experimental demonstration of magnetic logic based on reconfigurable
MCs. Microwave signal has been used to probe the logic states of the
devices and nanostructures.
[8] J. Ding,ε.KostylevandA.O.Adeyeye.“Realizationofaεesoscopic
Reprogrammable Magnetic Logic Based on a Nanoscale
Reconfigurable εagnonic Crystal” Applied Physics Letters, 100,
073114 (2012).
[9] J. Ding and A. O. Adeyeye. “Ni
80
Fe
20
/Ni Binary Nanomagnets for
δogicApplications”Applied Physics Letters, 100, 073114 (2012).
‚ Investigation of the dynamic behavior of triangular ring nanostructures.
[10] J. Ding,ε.KostylevandA.O.Adeyeye.“BroadbandFerromagnetic
ResonanceSpectroscopyofPermalloyTriangularNanorings”Applied
Physics Letters, 100, 062401 (2012).
1
!
Chapter 1
Introduction
1.1 Background
Artificial ferromagnetic nanostructures with periodic lateral contrasts in
magnetization are known as “magnonic crystals” (εCs), conceived as the
magnetic analogue of photonic crystals (PCs). [1] In PCs, the propagations of
light is manipulated by forming periodical dielectric constant variations along
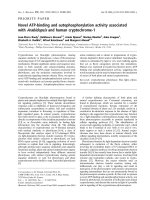
different dimensions. Shown in Fig, 1.1(a-c) are SEM images of typical 1-
dimension (1-D), [2] 2-dimension (2-D) [3] and 3-dimension (3-D) [4] PCs. The
manipulation of the light can be described by the band structures similar to the
one shown in Fig. 1.1(d). [5] Similar principle is also available for MCs. The
propagation of spin waves (SW) can be manipulated by introducing periodical
magnetization variation along different dimensions in MCs. Fig. 1.1(e) and (f)
shows the SEM images of typical 1-D [6] and 2-D [7] MCs. The band structure
has also been observed in these structures. Like PCs, magnonic ones are
expected to possess special and interesting properties arising from their
frequency band gaps as shown in Fig. 1.1(g). [6]
Fig. 1.1 Typical SEM images of (a) 1-D, [2] (b) 2-D [3] and (c) 3-D [4]
PCs. Typical SEM images of (e) 1-D [6] and (f) 2-D [7] MCs. Typical band
structures of PCs [5] and MCs [6] are shown in (d) and (g), respectively.
!∀#
!∃#
!%#
!&#
∋()∗)+,∃−./01∗∀21
!3#
!4#
!5#
6∀5+)+,∃ ./01∗∀21