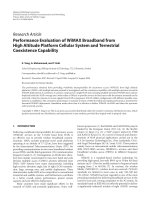
Performance evaluation of personalized ventilation personalized exhaust (PV PE) system in air conditioned healthcare settings 4
Bạn đang xem bản rút gọn của tài liệu. Xem và tải ngay bản đầy đủ của tài liệu tại đây (8.03 MB, 31 trang )
Chapter 4: Preliminary Studies
4.1 Introduction
The objective of the preliminary studies is to evaluate and verify the feasibility of the
novelPersonalised Ventilation - Personalised Exhaust (PV-PE) devices. There are
quite a few variations influencing the design of PV-PE system, such as the position of
PE, the pressure of PE, background ventilation type, PV ATDs type etc. Before
building the actual experimental facilities, the preliminary research involving a few
parametric variation studies was envisaged to provide ideas to make the
experimentalset-up more optimal.The preliminary research comprised two pilot
studies. Pilot study I was aimed to evaluate the feasibility of PV-PE system using
Computational Fluid Dynamics (CFD) simulation. It was found that the PV-PE
system was able to divert the PV fresh air profile and exhaust the exhaled
contaminated air before it mixed with the room air. In Pilot study II, three different
types of PE devices were developed and compared using a CFD model. The results
show that the top-PE and shoulder-PE could have a better performance in practice.
4.2 Pilot study I - Feasibility of the novel PV- PE system
4.2.1 Research Methodology
CFD simulation was used to evaluate parametric variations and to find the feasibility
of the novel PV- PE system.
4.2.2 Geometry and Grid
Two human beings sitting at two sides of a desk in a consultation room were
simulated as numerical manikins using CFD. The dimension of the simulated
consultation room is 4 m (length) x 3 m (width) x 2.6 m (height). The two manikins
were sitting face to face with a 2 m distance between each other. One represented an
Infected Manikin (Infected Person) that acts as a source of contaminated exhaled air
and the other manikin was assumed to be a Healthy Manikin (Healthy Person) that
inhales the contaminated air and acts as a sink. The geometry of the computer
simulated thermal manikin used in the pilot study is obtained from physical thermal
manikin by using a three-dimensional laser scanning technique (Gao& Niu, 2006). It
is a real and accurate representation of a nude seated female occupant with the surface
area of 1.57 m
2
. A pair of newly conceptualized localized exhaust devices, termed the
Chair Personalised Exhaust (PE) devices, was placed at the upper part of the chair and
just behind the human head, with a dimension of 0.08 m x 0.08 m.
Room geometry was divided into two sections: lower part of the room enclosing the
two manikins, with 2,863,045 unstructured tetrahedral cells around the manikin, and
the remaining upper room volume with 1,496,069 cells. There are two layers of
uniform boundary layer cells placed around the manikin’s body with size of 0.0022 m.
Enhanced wall treatment was applied in the simulation. As shown in Figure 4.1, the
value Y+ was approximately in the range of 0.5-1.8 for most part across the body
surface and around 3 for small part at face area. This is acceptable since in practice,
an up to 4-5 is considered acceptable as it is still inside the viscous sub-layer.
Figure 4.1 Contours of wall Y+
4.2.3 Turbulence model and boundary conditions
The indoor air flow patterns was simulated using standard k-epsilon model, which has
been used in previous numerical research (Gao & Niu, 2004; Pantelic, 2010) to
simulate indoor air flow based on the assumption that this model is capable of
simulating convective heat transfer of buoyancy-driven air flow as long as a
reasonable value of Y+ is achieved. Energy equation was activated. Continuity
equation and momentum equations were solved to obtain velocity distribution.
Species transportation equation was activated to study the personalized air distribution
and exhaled air spread. The SIMPLE algorithm is used to couple the pressure and
+
y
velocity fields. Considering the convection and diffusion, second order upwind was
used to solve the momentum and energy equations. PRESTO was used for pressure.
The room air was defined as incompressible air since the speed of room air flow was
insignificant compared to the speed of sound of the fluid medium. As shown in
Figure4.2, a four way ceiling supply air diffuser, demonstrated to be able to predict
the air flow pattern accurately (Cheong et al, 2001), was modelled for the MV inlet
since it is the most commonly used diffuser for MV. In addition, Under-Floor Air
Distribution (UFAD) system was also considered. The UFAD outlet with a diameter
of 200 mm is modelled in the simulation. Both the axial-velocity and tangential-
velocity were assigned in boundary conditions in order to represent the swirling flow
from a floor-mounted circular diffuser. Detailed boundary conditions used in this
study are listed in Table 4.1.
Figure 4.2 Models for the four way air diffuser
Table 4.1: Detailed boundary conditions in pilot simulation study
Turbulence model
Standard k–epsilon model
Number of cells used in the Fluent
model
3,763,604 cells
Mixing ventilation inlet
Velocity inlet; T = 23 °C; I = 10%
UFAD ventilation inlet
Velocity inlet; flow rate=20l/s ; I = 20%;
D=0.2
Room air outlet
Pressure outlet; Gauge pressure=0 Pa
Room wall
Adiabatic wall
Manikin body
T =34°C
Mouth
L = 8.4 l/min; I = 0.5%; D = 0.02 m
RMP ATD
Velocity inlet; I =10%; D =0.12 m
VDG ATD
Velocity inlet; I =10%; D =0.04 m
Personalized exhaust outlet
Pressure outlet
4.2.4 Parametric Variation Studies
Two sets of CFD simulation were carried out. The first set was conducted to evaluate
the influence on PEE by adding a Personalized Exhaust (PE) working together with
PV. In this simulation, both the manikins keep inhaling at a velocity of 8.4 l/min. Two
different kinds of PV air terminal devices (ATD) were simulated: Round Moveable
Panel (RMP) and Vertical Desk Grill (VDG). Two different background air supply
systems were simulated: ceiling supply Mixing Ventilation (MV) system (Figure 4.3)
and Under-Floor Air Distribution (UFAD) system (Figure 4.4). Detailed conditions
used in this study are listed in Table 4.2.
Figure 4.3 Configuration of the simulated office with mixing ventilation (1-MV
four- way inlet; inlet d=200 mm; 2-MV outlet 500x500 mm; 3-RMPd=120 mm;
4-PE 80x80 mm; 5-VDG 220x20 mm; 6-Numerical manikin)
Figure 4.4 Configuration of the simulated office with UFAD ventilation (1-
UFAD inlet d=200 mm; 2- UFAD outlet 500x500 mm; 3-RMP d=120 mm; 4-PE
80x80 mm; 5-VDG 220x20 mm; 6-Numerical manikin)
Table 4.2: Detailed ventilation combinations studied in Set 1 simulation
Backgr
ound air
supply
Mixing Ventilation
UFAD ventilation
Workst
ation
Configu
ration
RMP +PE
VDG +PE
RMP+PE
VDG+PE
PV
flow
rate
(l/s)
8
12
16
8
12
16
8
12
16
8
12
16
Chair
PE
device
Gauge
Pressur
e (Pa)
-10;
-30;
-50
-10;
-30;
-50
-10;
-30;
-50
-10;
-30;
-50
-10;
-30;
-50
-10;
-30;
-50
-10;
-30;
-50
-10;
-30;
-50
-10;
-30;
-50
-10;
-30;
-50
-10;
-30;
-50
-10;
-30;
-50
In order to evaluate the ability of personalized exhaust (PE) system in preventing the
spread of contaminated air exhaled by infected people, another set of CFD simulation
was conducted. The dimensions of the simulated room were the same. One manikin
(Healthy Manikin) keeps inhaling at a velocity of 8.4 l/min through mouth (20 × 10
mm) and the other manikin (Infected manikin) keeps exhaling at the same velocity
through mouth (20 × 10 mm). Tracer gas was introduced in the exhaled air. Based on
Set I simulation results, the combination of MV and Vertical Desk Grill (VDG) has
the lowest PEE. Set II simulations chose this worst case combination as the
ventilation combination to do further studies. Detailed conditions used in this study
are listed in Table 4.3.
Table 4.3: Detailed ventilation combinations studied in set 2 simulations
Ventilat
ion
Mixing Ventilation +VDG
combin
ation
PV
flow
rate
(l/s)
8
12
16
Chair
PE
device
Gauge
Pressur
e (Pa)
-10
-30
-50
-80
-10
-30
-50
-80
-10
-30
-50
-80
4.2.5 Evaluation Index
Two indices, i.e. Personalised Exposure Effectiveness (PEE) and Intake Fraction (iF)
were used to assess the performance of personalized exhaust system which has been
discribed in Chapter 3.
4.2.6 Results and Discussion - Ability to change the PV air direction and profile
The first objective of the pilot study was to examine the advantages and feasibilities
of the novel PV-PE system, which are mainly focused on the ability to pull the PV
fresh air by the chair integrated PE devices. CFD simulation performed in Set I
studies compared the PV air streamlines in each PV-background combination with PE
and without PE. Figure 4.5 to Figure 4.8 show that there are great differences between
each case. The streamlines in Figures 4.5 through 4.8 use the “Unique option” which
gives each streamline a different color along its whole length, and can be used to track
individual streamlines through the domain. The purpose of the figures is to show how
the PE diverts the PV air. So only streamline from PV is shown. The streamlines from
UFAD or MV inlet are not shown in these figures. When PV ATD (either RMP or
VDG) was coupled with a PE device, almost 100% PV air went through the seated
occupant towards the PE device, compared with only a small portion reaching the
seated human being without PE device. After hitting the surface of the manikin in the
face region, a fraction of the air flow may move up towards the ceiling exhaust grill.
This fraction depends largely on the gauge pressure of the PE.
(a)
(b)
(c)
(a) No PE device (b) Gauge pressure at -10Pa (c) Gauge pressure at -50Pa
Figure 4.5 Streamlines under the combination of VDG and MV
(a)
(b)
(c)
(a) No PE device (b) Gauge pressure at -30Pa (c) Gauge pressure at -50Pa
Figure 4.6 Streamlines under the combination of RMP and MV
(a)
(b)
(c)
(a) No PE device (b) Gauge pressure at -30Pa (c) Gauge pressure at -50Pa
Figure 4.7 Streamlines under the combination of RMP and UFAD
(a)
(b)
(c)
(a) No PE device (b) Gauge pressure at -10Pa (c) Gauge pressure at -50Pa
Figure 4.8 Streamlines under the combination of VDG and UFAD
4.2.7 Results and Discussion - Personalized Exposure Effectiveness (PEE)
The second objective of the first pilot study was to evaluate the improvement of the
inhaled air quality. Hence, the PEE is calculated and compared.
Figures 4.9 and 4.10 display the changes of Personalized Exposure Effectiveness
(PEE) with the change of gauge pressure of PE. From the two figures, it can be
deduced that the percentage of personalized air in inhaled air has a different trend
with mixing ventilation and with UFAD ventilation. In the following analysis, the
profile of PEE will be discussed separately together with different background
ventilation types.
For MV systems, PEE concentration distributions increase when air flow rates
increase. When PE is added, PEE remains unchanged at low flow rate level (8 l/s) and
decreases with the decrease of gauge pressure of PE at higher flow rate level (12 l/s
and 16 l/s). The largest reduction is around 20% when gauge pressure is -50 Pa
compared with no PE devices. This is because the suction force of PE devices tends to
divert the PV air in front of the face instead of reaching the breathing zone.
For UFAD systems, PEE concentration distributions increase when air flow rates
increase as well. For the same air flow rate, RMP has a better performance than VDG
in terms of PEE. PEE shows an obvious increasing trend by adding a PE device. For
both RMP and VDG, PE device enlarged the concentration of personalized air in the
breathing zone. For RMP, the increased PEE is only applicable for higher flow rates
(12 l/s and 16 l/s). The PEE remains unchanged for low flow rate, such as 8l/s. For
VDG, the increase of PEE is obvious and the increased amount is larger when PV
supply flow rate is at 8 l/s.
Figure 4.9 Comparison of PEE at different gauge pressures of PE with Mixing
Ventilation
0"
0.1"
0.2"
0.3"
0.4"
0.5"
No"PE" -10"Pa" -30"Pa" -50"Pa"
PEE
Gauge pressure of PE
Mixing ventilation
RMP8l/s"
RMP12l/s"
RMP16l/s"
VDG8l/s"
VDG12l/s"
VDG16l/s"
Figure 4.10 Comparison of PEE at different gauge pressures of PE with UFAD
ventilation
4.2.8 Results and Discussion - Intake Fraction
As stated before, Intake Fraction can be calculated by inhaled tracer gas concentration
for the Healthy Manikin over the exhaled tracer gas concentration from the Infected
Manikin. For all the cases in Set II studies, the exhaled air was marked as ‘exhaled air’
in FLUENT software. The concentrations of exhaled air at the mouth of the Infected
Manikin for all the cases are the same as shown in Figure 4.11
Figure 4.11 Concentrations of exhaled air at the mouth of the Infected Manikin
The inhaled tracer gas concentrations at the mouth of Healthy Manikin when PV air
flow rate was set at 8 l/s are shown in Figure 4.12
0"
0.1"
0.2"
0.3"
0.4"
0.5"
0.6"
No"PE" -10"Pa" -30"Pa" -50"Pa"
PEE
Gauge pressure of PE
UFAD ventilation
RMP"8l/s"
RMP"12l/s"
RMP"16l/s"
VDG"8l/s"
VDG"12l/s"
VDG"16l/s"
(a) No PE device
(b) Gauge pressure at -10Pa
(c) Gauge pressure at -30 Pa
(d) Gauge pressure at -50 Pa
(e) Gauge pressure at -80 Pa
Figure 4.12 Concentrations of exhaled air at the mouth of Healthy Manikin with
a PV flow rate of 8 l/s
The inhaled tracer gas concentrations at the mouth of Healthy Manikin when PV air
flow rate was set at 12 l/s are shown in Figure 4.13
(a) No PE device
(b) Gauge pressure at -10 Pa
(c) Gauge pressure at -30 Pa
(d) Gauge pressure at -50 Pa
(e) Gauge pressure at -80 Pa
Figure 4.13 Concentrations of exhaled air at the mouth of Healthy Manikin with
a PV flow rate of 12 l/s
The inhaled tracer gas concentrations at the mouth of Healthy Manikin when PV air
flow rate was set at 16 l/s are shown in Figure 4.14
(a) No PE device
(b) Gauge pressure at -10 Pa
(c) Gauge pressure at -30 Pa
(d) Gauge pressure at -50 Pa
(e) Gauge pressure at -80 Pa
Figure 4.14 Concentrations of exhaled air at the mouth of Healthy Manikin with
a PV flow rate of 16 l/s
Figure4.15 illustrates the iF for all the cases in Table 4.3 for at the mouth of the
Healthy Manikin. Generally, iF reduces with the increase of PV supply rate, which
indicates that PV has the potential to protect people from inhaling pollutant air.
Furthermore, for PE with gauge pressure of -80 Pascal, iF of all the three supply flow
rates was about one order of magnitude lower than without PE. In terms of protecting
the healthy manikin from pollutants exhaled by the polluting manikin, adding a PE
device is much more effective than increasing the PV flow rate. This is because PE
devices are able to exhaust the exhaled air directly before it mixes with the room air,
as shown in Figure4.16.
Figure 4.15 Comparison of iF at different Gauge pressure of PE
Figure 4.16 Air streamlines showing exhaled air from Infected Manikin
0.00E+00"
2.00E-07"
4.00E-07"
6.00E-07"
8.00E-07"
1.00E-06"
1.20E-06"
1.40E-06"
1.60E-06"
No PE -10 -30 -50 -80
Intake fraction
PE Gauge Pressure (Pascal)
MV+ VDG
8l/s"
12l/s"
16l/s"
4.3 Pilot study II - Evaluation of different Personalized Exhaust devices
The first pilot study has examined the feasibility of Personalized Ventilation -
Personalized Exhaust (PV-PE) system and supports the idea of supplying more fresh
air to a person as well as to exhaust the exhaled contaminated air directly around the
Infected Person before it mixes with the room air in hospitals and healthcare centres.
Thus, the location and design parameter of the PE devices can be further explored
since it plays a major role in the distribution of air around the human body.
In pilot study II, three different PE devices were developed, simulated and compared:
a chair-PE, the same as used in Pilot study I; a top-PE, which is a round device above
the human head; a shoulder-PE, which are two local exhaust devices installed at the
chair, just above the shoulder level. The PV air terminal devices chosen in this study
are VDG and Desk-top PV (DPV). The performance of the PV-PE system in regard to
occupants’ inhaled air quality and the transmission of exhaled aerosols between two
occupants was studied and investigated numerically by computational fluid dynamics.
4.3.1 Methodology
Figure 4.17 illustrates the configuration of the simulated consultation room in a health
centre, the same as in pilot study I. The origin of the coordinate system was selected
at the centre of the room volume. The Infected Manikin was to simulate an Infected
Person who is sitting below the ceiling supply diffuser. The other Healthy Manikin
was to simulate a Healthy Person who is sitting below the ceiling return grill. DPV
was put on the desktop at a distance of 550 mm from the manikin’s mouth and the
Vertical Desk Grill was located 390 mm from the manikin’s mouth. Three kinds of
newly conceptualized localized exhaust device were simulated. Top-PE was located
50 mm above the manikin’s head, Chair-PE and Shoulder-PE had a dimension of 80
mm x 80 mm. Table 4.4 shows the details of the simulated conditions in this study.
PV flow rate was set at 4 l/s or 8 l/s.
Figure 4.17: Configuration of the simulated consultation room (1-Mixing
Ventilation four-way inlet; 2-Mixing Ventilation outlet 500x500 mm; 3-DPV
96x80 mm; 4-VDG 220x20 mm; 5-Top-PE d=120 mm; 6-Chair-PE 80x80 mm;7-
Shoulder-PE 80x80 mm)
According to Holmgren et al. (2010), the size distribution of exhaled particles peaks
at around 0.07 µm, and an additional broad and strong peak was found between 0.2
and 0.5 µm. Gao (2008) and He et al. (2011) found that the concentration profile of
exhaled particles with diameter smaller than 0.8µm was similar to gas. Thus, in this
study, the exhaled particles were simulated as gas and the exhaled air from the
Infected Manikin was marked as contaminated air. The experimental results of
Pantelic (2009) demonstrated that droplets concentrations measured in the breathing
zone of a thermal manikin were similar with and without a normal breathing process.
Therefore, the respiratory process of the Infected Manikin was simplified to constant
exhalation with a flow rate of 8.4 l/min. The Healthy Manikinwas simulated as
keeping inhalation at the same velocity through mouth (20 × 10 mm). Although the
actual expiratory process is through the nose, the experimental results of Rim and
Novoselac (2009) demonstrated that breathing of a sedentary manikin has small
impact on the airflow field in the breathing zone as well as the occupant’s thermal
plume.
Table 4.4: Detailed ventilation combinations studied in Set 1 simulation
PV air
terminal
devices
Vertical Desk Grill (VDG)
Desktop PV Devices(DPV)
Personali
zed
Exhaust
device
Top-PE
Chair-PE
Shoulder-
PE
Top-PE
Chair-PE
Shoulder-
PE
PV flow
rate (l/s)
4
8
4
8
4
8
4
8
4
8
4
8
PE
device
Gauge
Pressure
(Pascal)
-10;
-20;
-30
-10;
-20;
-30
-10;
-20;
-30
-10;
-20;
-30
-10;
-20;
-30
-10;
-20;
-30
-10;
-20;
-30
-10;
-20;
-30
-10;
-20;
-30
-10;
-20;
-30
-10;
-20;
-30
-10;
-20;
-30
CFD simulation was conducted using Fluent 6.3. Considering the complexity of
combined buoyant flow, PV air flow and background air flow for the PV-PE study, it
was difficult to find one turbulence transport model capable of resolving every aspect
of the flows. Nielsen (1998) suggested having a compromise to select one turbulent
model for the room airflow prediction. Similar to the pilot study I, standard k-ɛ model
was adopted for the Pilot Study II. Energy equation was activated. Continuity
equation and momentum equations were solved to obtain velocity distribution.
The convection and diffusion term for all variables were the same as described in pilot
study I. The boundary conditions applied in the simulation are shown in Table 4.5.
The supply air temperature was 26° C for mixing ventilation system and 23° C for
personalized ventilation. The exhaled air was set to be 34°C.
Table 4.5: Detailed boundary conditions in simulation
Turbulence model
Standard k–epsilon model
Number of cells used in FLUENT
model
4,605,081 cells
Mixing ventilation inlet
Velocity inlet; T = 23 °C; I = 10%