Application of the lean philosophy to reduce carbon emissions in the precast concrete industry of singapore
Bạn đang xem bản rút gọn của tài liệu. Xem và tải ngay bản đầy đủ của tài liệu tại đây (4.33 MB, 499 trang )
APPLICATION OF THE LEAN PHILOSOPHY TO REDUCE CARBON
EMISSIONS IN THE PRECAST CONCRETE INDUSTRY OF
SINGAPORE
WU PENG
NATIONAL UNIVERSITY OF SINGAPORE
2011
APPLICATION OF THE LEAN PHILOSOPHY TO REDUCE CARBON
EMISSIONS IN THE PRECAST CONCRETE INDUSTRY OF
SINGAPORE
WU PENG
(B.Sc., Tsinghua, China; M.Sc. (Constr. Mgt.), Loughborough, UK)
A THESIS SUBMITTED
FOR THE DEGREE OF DOCTOR OF PHILOSOPHY
DEPARTMENT OF BUILDING
SCHOOL OF DESIGN AND ENVIRONMENT
NATIONAL UNIVERSITY OF SINGAPORE
2011
i
DECLARATION
I hereby declare that the thesis is my original work and it has been written by me in its
entirely. I have duly acknowledged all the sources of information which have been used in the
thesis.
This thesis has also not been submitted for any degree in any university previously.
Wu Peng
20 September 2012
ii
ACKNOWLEDGEMENTS
I would like to express my gratitude to all those who have helped me complete the thesis. I
want to thank my supervisor, Professor Low Sui Pheng, who gave useful and innovative
feedback throughout the research period. This work owed much to his patience and
constructive feedback. In addition, without his diligent efforts on the improvement of the
academic papers, the publication of these papers arising from this research would not have
been possible.
I would like to thank Professor George Ofori who offered constructive advice during my
research, especially in the section on the theoretical background. I would also like to thank
Associate Professor Ling Yean Yng Florence for the useful feedback she provided on my
thesis. Special thanks to Associate Professor Teo Ai Lin Evelyn and Assistant Professor Kua
Harn Wei who provided many useful feedbacks on this research. The feedbacks they have
provided on sustainable development and LCA studies are of great importance to this
research.
This study would not be possible without the financial support rendered by the National
University of Singapore through the award of the NUS research scholarship for the entire
duration of my stay in Singapore.
My heartfelt gratitude also go to the many precasters and contractors who have so freely
given of their time to talk to me and to provide the much needed information and direction for
this study. I would like to thank Mr. Kwong Sin Keong from the Prefabrication Technology
Centre of Housing and Development Board for providing the contact information of all the
precasters in Singapore. This research would not be possible without their help. However, for
the reason of confidentiality, I am unable to name other precasters and contractors here to
preserve their anonymity.
I am indebted to my colleagues and friends in the Department of Building, National
University of Singapore for providing assistance. Last but not least, I am greatly indebted to
my family, especially my mother, who has supported me in my academic pursuits all these
years.
iii
TABLE OF CONTENTS
DECLARATION i
ACKNOWLEDGEMENTS ii
TABLE OF CONTENTS iii
SUMMARY viii
LIST OF TABLES x
LIST OF FIGURES xiii
LIST OF APPENDICES xvi
ABBREVIATIONS xvii
Chapter One: Introduction 1
1.1 Introduction 1
1.2 Problem statement 3
1.3 Research aim and objectives 6
1.4 Scope of the study 9
1.5 Significance and contribution of the research 11
1.6 Description of chapters 13
Chapter Two: Sustainable Development 17
2.1 Introduction 17
2.2 The concept of sustainable development 18
2.2.1 Economic sustainability 19
2.2.2 Environmental sustainability 21
2.2.3 Social sustainability 23
2.3 Sustainable construction and the green building 28
2.3.1 Green building rating systems – history 28
2.3.2 Green building rating systems – overview 31
2.3.3 Green building rating systems – in-depth investigation 33
2.3.4 Project management and sustainable construction 37
2.4 Global climate change 42
2.4.1 Global climate change and the construction companies 46
2.4.2 Measuring carbon emissions – the Building Research Establishment (BRE)
methodology 49
2.4.3 Measuring carbon emissions – The IPCC methodology 53
2.5 Summary 60
Chapter Three: Lean Production Philosophy 62
3.1 Introduction 62
3.2 History - the Toyota Production System 63
3.3 Lean production concept 66
3.4 Linking lean production with the JIT concept 72
3.4.1 Principles 74
3.4.2 Similarities and differences 81
3.5 Linking lean production with green 84
3.6 Summary 86
Chapter Four: The Precast Concrete Industry 88
4.1 Introduction 88
4.2 Production considerations 89
4.2.1 Production processes 89
iv
4.2.2 Concrete 90
4.2.3 Reinforcement 91
4.2.4 Moulds 92
4.2.5 Demoulding and stacking 92
4.2.6 Equipment in precast concrete production 93
4.3 Transportation and erection considerations 96
4.4 Benefits of precast concrete components 97
4.5 Applicability of the lean principles to reduce carbon emissions 100
4.5.1 Precasters 101
4.5.2 Contractors 107
4.6 Pilot studies 110
4.6.1 Background of pilot studies 111
4.6.2 Results from the pilot study: Precaster A 112
4.6.3 Results from the pilot study: Precaster B 118
4.6.4 Discussions 120
4.7 Summary 122
Chapter Five: Theoretical Background 124
5.1 Introduction 124
5.2 Sustainability science 125
5.3 Model of manufacturing – complex systems 128
5.4 Model of manufacturing - lean production system 136
5.4.1 The transformation concept of production 137
5.4.2 The flow concept of production 141
5.4.3 The value concept of production 144
5.4.4 TFV (Transformation-Flow-Value) framework of production 147
5.5 Economic explanation of production 149
5.5.1 Demand theory (Consumer choice theory) 150
5.5.2 The theory of the firm 151
5.5.3 The cost of production theory of value 153
5.6 Economic explanation of the environment 153
5.6.1 The theory of public goods 154
5.6.2 The theory of externality 155
5.6.3 Economic solution to environmental problems 156
5.7 Environmental management 158
5.7.1 Environmental management: the science of ecology 159
5.7.2 Environmental management: a dynamic equilibrium 160
5.7.3 Environmental management: a systems concept 162
5.7.4 Environmental management and management theories in production 164
5.8 Conceptual framework 168
5.9 Summary 173
Chapter Six: Research Methodology 175
6.1 Introduction 175
6.2 Research methodology 175
6.2.1 Identifying non-value adding activities 180
6.2.2 Assessing carbon emissions 183
6.2.3 Case study 186
6.3 Justification 189
6.4 Summary 190
Chapter Seven: Lean Applications in Precast Concrete Factories 192
7.1 Introduction 192
7.2 Response rate and representativeness of data 193
v
7.3 Lean site layout management in precast concrete factories 194
7.3.1 Descriptive analysis 195
7.3.2 Factors description 198
7.3.3 Ranking procedure 202
7.3.4 Non-parametric tests 212
7.3.5 Specific analysis 214
7.4 Lean supply chain management in precast concrete factories 215
7.4.1 Descriptive analysis 215
7.4.2 Factors description 218
7.4.3 Ranking procedure 220
7.4.4 Non-parametric tests 225
7.4.5 Specific analysis 227
7.5 Lean production management in precast concrete factories 228
7.5.1 Descriptive analysis 228
7.5.2 Factors description 232
7.5.3 Ranking procedure 234
7.5.4 Non-parametric tests 240
7.5.5 Specific analysis 241
7.6 Lean stock management in precast concrete factories 242
7.6.1 Descriptive analysis 242
7.6.2 Factors description 244
7.6.3 Ranking procedure 247
7.6.4 Non-parametric tests 252
7.6.5 Specific analysis 253
7.7 Mitigation strategies and actions for precasters 254
7.7.1 The general procedure to develop mitigation actions 254
7.7.2 Developing the mitigation actions for precasters 257
7.8 Summary 260
Chapter Eight: Lean Applications in Precast Concrete Factories – A Case Study 262
8.1 Introduction 262
8.2 General procedure to quantify the lean improvements 263
8.3 Embodied carbon of raw materials and finished products 266
8.3.1 Calculation method 266
8.3.2 Estimation criteria 267
8.3.3 Estimation assumptions 269
8.3.4 Inputs 271
8.3.5 Embodied carbon of the precast concrete column 273
8.4 Screening and estimation process 275
8.4.1 Site layout management 275
8.4.2 Supply chain management 280
8.4.3 Production management 282
8.4.4 Stock management 285
8.5 Results 287
8.6 Summary 292
Chapter Nine: Lean Applications in Construction Sites Using Precast Concrete Products 294
9.1 Introduction 294
9.2 Response rate and representativeness of data 295
9.3 Lean site layout management in the precast concrete construction sites 296
9.3.1 Descriptive analysis 297
9.3.2 Factors description 300
9.3.3 Ranking procedure 303
9.3.4 Parametric tests 314
9.3.5 Specific analysis 317
vi
9.4 Lean transportation management in the construction sites 318
9.4.1 Descriptive analysis 318
9.4.2 Factors description 321
9.4.3 Ranking procedure 324
9.4.4 Parametric tests 331
9.4.5 Specific analysis 333
9.5 Lean stock management in the construction sites 333
9.5.1 Descriptive analysis 334
9.5.2 Factors description 335
9.5.3 Ranking procedure 336
9.5.4 Parametric tests 342
9.5.5 Specific analysis 343
9.6 Lean erection management in the construction sites 343
9.6.1 Descriptive analysis 344
9.6.2 Factors description 346
9.6.3 Ranking procedure 348
9.6.4 Parametric tests 354
9.6.5 Specific analysis 356
9.7 Mitigation strategies and actions for contractors 356
9.7.1 General procedure to develop mitigation actions 356
9.7.2 Developing the mitigation actions for the contractors 357
9.8 Summary 361
Chapter Ten: Lean Applications in Construction Sites using Precast Concrete Components – A
Case Study 362
10.1 Introduction 362
10.2 General procedure to generate the case study 363
10.2.1 Observations from Contractor A1 364
10.2.2 Observations from Contractor A2 365
10.2.3 Observations from Contractor A3 366
10.2.4 The case study – Contractor A3 367
10.3 General procedure to calculate the lean improvements 368
10.4 Methodology 370
10.5 The screening and estimation process 375
10.5.1 Carbon emissions in one complete erection cycle 375
10.5.2 Site layout management 376
10.5.3 Transportation management 382
10.5.4 Stock management 385
10.5.5 Erection management 387
10.6 Results 391
10.7 Summary 396
Chapter Eleven: Discussions and Implications 397
11.1 Introduction 397
11.2 Lean in carbon labelling programmes 398
11.2.1 Introduction 398
11.2.2 LCA in environmental labelling programmes 398
11.2.3 Lean in environmental labelling programmes 402
11.3 Applying the lean concept to other construction materials 407
11.4 The value concept in the TFV framework 408
11.5 Implication I: Precasters 414
11.6 Implication II: Contractors 416
11.7 Implication III: Regulatory authorities 417
11.8 Validation of results 419
vii
Chapter Twelve: Conclusions, recommendations and further research 422
12.1 Summary 422
12.1.1 Part I: Literature Review 422
12.1.2 Part II: Theoretical background 423
12.1.3 Part III: Lean applications by precasters 423
12.1.4 Part IV: Lean applications by contractors 424
12.1.5 Implications and conclusions 424
12.2 Main findings 427
12.3 Contributions to theory and knowledge 428
12.4 Contributions to practice 431
12.5 Limitations of the research 433
12.6 Suggestions for future research 436
References 439
Appendix 1 Questionnaire for precasters in the Singapore precast concrete industry (Pilot
studies) 461
Appendix 2 Questionnaire for precasters in the Singapore precast concrete industry
(Empirical study) 465
Appendix 3 Questionnaire for contractors in the Singapore precast concrete industry
(Empirical study) 471
Appendix 4 List of publications 479
viii
SUMMARY
Climate change has emerged as one of the most pressing environmental issues in recent years.
The construction industry contributes to the increase in the level of carbon dioxide (CO
2
) in
many aspects. For example, the cement sector alone accounts for 5% of global man-made
CO
2
emissions. Manufacturing of raw materials (e.g. cement and steel) and chemicals have
considerable impact on CO
2
emissions.
The lean concept has proven to be effective in increasing environmental benefits by
eliminating waste, preventing pollution and maximizing value to owners. However, an
in-depth investigation of the lean concept‟s role in reducing carbon emissions should be
conducted before any recommendations can be made. Prefabrication systems are believed to
have the potential for better environmental performance and have been adopted by the
construction industry to meet the challenges posed by sustainable development. However,
there remains many areas in the prefabrication systems that can be improved in order to
achieve sustainability, such as site layout, work flow and inventory control. This research
therefore seeks to identify the non-value adding activities in precast concrete production and
installation to reduce carbon emissions. The non-value adding activities identified in this
research can be used to help guide the precasters‟ and contractors‟ decision-making process to
meet the challenges of global climate change.
Four stages in the precast concrete production cycle are investigated, which are site layout
management, supply chain management, production management and stock management. In
addition, four stages in the precast concrete erection cycle are investigated, which are site
layout management, transportation management, stock management and erection
management. The importance of the non-value adding activities identified in this research is
ix
rated by a weighted factor model using both the non-parametric tests (for precasters) and the
parametric tests (for contractors). The results suggest that many lean principles can be applied
in precast concrete factories and in the construction sites to reduce carbon emissions, e.g. the
pull system, total quality control and benchmarking.
In addition to the data collected from the survey work, four case studies (one precaster and
three contractors) are presented in this study. Various theoretical and practical implications
and conclusions of this research are provided for precasters, contractors and regulatory
authorities. It is argued that the lean production philosophy can be used to achieve low-carbon
production and low-carbon installation in terms of eliminating non-value adding activities
from waste of raw materials, waste of finished products as well as inappropriate
production/erection arrangements. The lean improvements will enable precasters and
contractors to perform better in many sustainability-related rating systems, such as the
Singapore Green Labelling Scheme, and the Building and Construction Authority (BCA)
Green Mark Scheme provided for under the Building Control Act. It also suggests that the
practitioners should pay special attention to the “continuous improvement” characteristics of
the lean concept to focus on long-term improvement.
Keywords: Sustainability, Prefabrication, Climate change, Lean, Carbon emissions
x
LIST OF TABLES
Table 2.1 Points allocation of LEED 2.2, Green Globes and BCA Green Mark 3.0 32
Table 2.2 Comparison of LEED 2.2, Green Globes and BCA Green Mark 3.0 in the area of
project management 36
Table 3.1 Major links between lean and JIT principles 79
Table 5.1 Complex systems‟ characteristics 130
Table 5.2 Transformation, flow and value generation concepts of design 149
Table 7.1 Profile of respondents 194
Table 7.2 General questions in the section of site layout management 195
Table 7.3 Seven major categories of non-value adding activities in site layout management
198
Table 7.4 Five-scale value range to assess the probabilities of non-value adding activities . 202
Table 7.5 Five scale value range to assess the impact of non-value adding activities 203
Table 7.6 Probability, impact and severity of the non-value adding activities in site layout
management 205
Table 7.7 Test statistics for factor 1.6.3 and 1.6.1 212
Table 7.8 Ranking and grouping of non-value adding activities in site layout management 213
Table 7.9 General questions in the section of supply chain management 216
Table 7.10 Two major categories of non-value adding activities in supply chain management
218
Table 7.11 Probability, impact and severity of the non-value adding activities in supply chain
management 223
Table 7.12 Ranking and grouping of non-value adding activities in supply chain management
226
Table 7.13 General questions in the section of production management 229
Table 7.14 Five major categories of non-value adding activities in production management
232
Table 7.15 Probability, impact and severity of the non-value adding activities in production
management 235
Table 7.16 Ranking and grouping of non-value adding activities in production management
241
Table 7.17 General questions relating to stock management 243
Table 7.18 Five major categories of non-value adding activities in stock management 245
Table 7.19 Probability, impact and severity of the non-value adding activities in production
management 248
xi
Table 7.20 Ranking and grouping of non-value adding activities in stock management 253
Table 7.21 Ranking, grouping and mitigation actions for non-value adding activities in
precast concrete factories 259
Table 8.1 Information sources for materials and energy consumption data 269
Table 8.2 Mix design of the 16HPC1 precast concrete columns 271
Table 8.3 Calculation of CO
2
intensity during transportation 273
Table 8.4 Embodied carbon of 16HPC1 precast concrete column 274
Table 8.5 Quantification of the lean improvements in site layout management 281
Table 8.6 Quantification of the lean improvements in supply chain management 282
Table 8.7 Quantification of the lean improvements in production management 286
Table 8.8 Quantification of the lean improvements in stock management 287
Table 8.9 Carbon reduction achieved by applying the lean production philosophy 288
Table 8.10 The breakdown of carbon reduction when the embodied carbon is reduced 291
Table 9.1 General questions in the section for site layout management 297
Table 9.2 Seven major categories of non-value adding activities in site layout management
300
Table 9.3 Five-point scale to assess the probabilities of non-value adding activities 304
Table 9.4 Five scale to assess the impact of non-value adding activities 305
Table 9.5 An example to show the difference between the LR of severity and the results (PxI)
305
Table 9.6 Probability, impact and severity of the non-value adding activities in site layout
management 308
Table 9.7 Test statistics for factors 1.1.3 and 1.1.1 315
Table 9.8 Ranking and grouping of non-value adding activities in site layout management 316
Table 9.9 General questions in the section of transportation management 319
Table 9.10 The categories of non-value adding activities in transportation management 322
Table 9.11 Probability, impact and severity of the non-value adding activities in
transportation management 326
Table 9.12 Ranking and grouping of non-value adding activities in transportation
management 332
Table 9.13 General questions in the section on stock management 334
Table 8.14 Four major categories of non-value adding activities in stock management 335
Table 9.15 Probability, impact and severity of the non-value adding activities in stock
management 338
xii
Table 9.16 Ranking and grouping of non-value adding activities in stock management 343
Table 9.17 General questions in the section of erection management 345
Table 9.18 Five major categories of non-value adding activities in erection management 346
Table 9.19 Probability, impact and severity of the non-value adding activities in erection
management 350
Table 9.20 Ranking and grouping of non-value adding activities in erection management . 355
Table 9.21 Ranking, grouping and mitigation actions for non-value adding activities in the
construction sites 358
Table 10.1 Energy consumption and emissions factors used in this case study 372
Table 10.2 Fuel consumption and emissions factors of the tower crane 374
Table 10.3 Carbon emissions in one complete erection cycle without non-value adding
activities 376
Table 10.4 Quantification of the lean improvements in site layout management 381
Table 10.5 Quantification of the lean improvements in transportation management 385
Table 10.6 Quantification of the lean improvements in stock management 387
Table 10.7 Quantification of the lean improvements in erection management 391
Table 10.8 Carbon reduction achieved by applying the lean production philosophy 392
Table 10.9 The breakdown of carbon reduction when applying the lean production
philosophy 393
Table 11.1 Some carbon labelling practices in current environmental labelling programmes
401
Table 11.2 The carbon emissions value of the precast concrete product (modified) 403
Table 11.3 Non-value adding activities in the precast concrete production process 404
Table 11.4 The sources of carbon emissions of the precast concrete column 415
Table 12.1 Contributions to theory and knowledge 429
xiii
LIST OF FIGURES
Figure 1.1 U.S. CO
2
emissions by sectors 2
Figure 1.2 The need for research into other viable options 4
Figure 1.3 Structure of the thesis 14
Figure 2.1 Generalized decision tree for estimating emissions from fuel combustion 55
Figure 3.1 House of the Toyota Production System 66
Figure 3.2 Comparison of lean and JIT management philosophy 74
Figure 3.3 Continuous improvement which progressively helps to eliminate non-value
adding activities and improve the efficiency of value adding activities 76
Figure 3.4 A U-shaped line with multiple-function workers 78
Figure 3.5 Classified requirements for a facility and their possible priorities for different
customers 85
Figure 4.1 Gantry lifting system 94
Figure 4.2 Forklift truck used for transportation of materials 95
Figure 4.3 The Spoke Delivery System and the Rim Delivery System 103
Figure 4.4 Lean applications in the production stages of precast concrete components 104
Figure 4.5 Typical physical factory layout for bridge beam prefabrication 105
Figure 4.6 Lean based physical factory layout 106
Figure 4.7 Factory layout of Precaster A 114
Figure 4.8 Quality control steps during production processes 116
Figure 4.9 Quality control processes of Precaster B 120
Figure 5.1 The three systems of sustainability science 126
Figure 5.2 Innovation structure in the flight simulation industry 132
Figure 5.3 The transformation view of production 138
Figure 5.4 The development of the transformation concept of production 141
Figure 5.6 The development of the value concept of production 147
Figure 5.7 The dynamic equilibrium between man and the environment 161
Figure 5.8 Environmental management as a systems concept 164
Figure 5.9 Conceptual framework 171
Figure 6.1 The selection of research methods in accordance with the research objectives 177
xiv
Figure 6.2 Research methodology 179
Figure 7.1 The probability of non-value adding activities in site layout management 204
Figure 7.2 The impact of non-value adding activities in site layout management 208
Figure 7.3 The severity of non-value adding activities in site layout management 210
Figure 7.4 P-I table for non-value adding activities in site layout management 211
Figure 7.5 The probability of non-value adding activities in supply chain management 221
Figure 7.6 The impact of non-value adding activities in supply chain management 222
Figure 7.7 The severity of non-value adding activities in supply chain management 224
Figure 7.8 P-I table for non-value adding activities in supply chain management 225
Figure 7.9 The probability of non-value adding activities in production management 236
Figure 7.10 The impacts of non-value adding activities in production management 237
Figure 7.11 The severity of non-value adding activities in production management 239
Figure 7.12 P-I table for non-value adding activities in production management 240
Figure 7.13 The probability of non-value adding activities in stock management 247
Figure 7.14 The impact of non-value adding activities in stock management 250
Figure 7.15 The severity of non-value adding activities in stock management 251
Figure 7.16 P-I table for non-value adding activities in stock management 252
Figure 7.17 The process flow to define mitigation actions for single non-value adding
activity 256
Figure 8.1 Screening procedure to identify factors that could be estimated 264
Figure 8.2 Four steps to conduct a LCA study 267
Figure 8.3 System boundaries of the LCA for precast concrete columns 268
Figure 8.4 The precast concrete column that was examined in this study 270
Figure 8.5 The site layout design of the ground floor (not to scale) 277
Figure 8.6 The site layout design of the 2
nd
, 3
rd
and 4
th
floor of the 4-storey building (not to
scale) 278
Figure 8.7 A lean notice board in one Japanese company 279
Figure 8.8 A type of unnecessary movement in precast concrete production 284
Figure 9.1 The probability of non-value adding activities in site layout management 307
Figure 9.2 The impact of non-value adding activities in site layout management 310
Figure 9.3 The severity of non-value adding activities in site layout management 312
Figure 9.4 P-I table for non-value adding activities in site layout management 314
xv
Figure 9.5 The probability of non-value adding activities in transportation management 327
Figure 9.6 The impact of non-value adding activities in transportation management 329
Figure 9.7 The severity of non-value adding activities in transportation management 330
Figure 9.8 P-I table for non-value adding activities in transportation management 331
Figure 9.9 The probability of non-value adding activities in stock management 339
Figure 9.10 The impact of non-value adding activities in stock management 340
Figure 9.11 The severity of non-value adding activities in stock management 341
Figure 9.12 P-I table for non-value adding activities in stock management 342
Figure 9.13 The probability of the non-value adding activities in erection management 351
Figure 9.14 The impact of non-value adding activities in erection management 352
Figure 9.15 The severity of non-value adding activities in erection management 353
Figure 9.16 P-I table for non-value adding activities in erection management 354
Figure 10.1 The value stream of precast concrete products in construction sites 363
Figure 10.2 Site layout plan of the project carried out by Contractor A1 (not to scale) 364
Figure 10.3 Site layout plan of the project carried out by Contractor A2 (not to scale) 366
Figure 10.4 Screening procedure to identify factors that could be estimated 368
Figure 10.5 The systems boundaries of this case study 371
Figure 10.6 Site layout of the project (not to scale) 374
Figure 10.7 Re-allocating TC1 to achieve smooth work flow 379
Figure 10.8 Previous on-site fabrication yard 380
Figure 10.9 Re-designed fabrication yard 380
Figure 10.10 The delivery vehicles that were left idling caused by overlapping of the delivery
times 383
Figure 10.11 Inappropriate stacking of the precast concrete products in the storage area 386
Figure 11.1 Lean benchmarking process in carbon labelling programmes 406
Figure 11.2 Classified requirements for a facility and their possible priorities for different
customers 414
Figure 12.1 How lean production principles help to reduce carbon emissions 425
xvi
LIST OF APPENDICES
Appendix 1 Questionnaire for precasters in the Singapore precast concrete industry (Pilot
studies) 461
Appendix 2 Questionnaire for precasters in the Singapore precast concrete industry
(Empirical study) 465
Appendix 3 Questionnaire for contractors in the Singapore precast concrete industry
(Empirical study) 471
Appendix 4 List of publications 479
xvii
ABBREVIATIONS
AIA
ASCE
ASTM
BCA
BRE
BREEAM
CFC
CSR
DETR
EFDB
EMA
EPA
GBI
GDP
GHGs
GNP
HDB
HKSAR
ICE
IPCC
IUCN
JIT
LCA
LCC
LEED
MCDM
MtF
NCCC
NEA
OECD
QC
QFD
SDC
SEC
SETAC
SGLS
TPM
TPS
TQC
TQM
UNEP
UNFCCC
USGBC
USGS
WBCSD
WCED
WRI
WSA
American Institute of Architects
American Society of Civil Engineers
American Society of Testing and Materials
Building and Construction Authority
Building Research Establishment
Building Research Establishment Environmental Assessment Method
Chlorofluorocarbons
Corporate Social Responsibility
Department of the Environment, Transport and the Regions
Emission Factor Database
Energy Market Authority
Environmental Protection Agency
Green Building Initiative
Gross Domestic Product
Greenhouse Gases
Gross National Product
Housing and Development Board
Hong Kong Special Administrative Region
Inventory of Carbon and Energy
Intergovernmental Panel on Climate Change
International Union for Conservation of Nature
Just-In-Time
Life Cycle Analysis
Life Cycle Costing
Leader in Energy and Environmental Design
Multi-Criteria Decision-Making
Make-to-Forecast
National Climate Change Committee
National Environment Agency
Organisation for Economic Co-operation and Development
Quality Control
Quality Function Deployment
Sustainable Development Charity
Singapore Environment Council
Society for Environmental Toxicology and Chemistry
Singapore Green Labelling Scheme
Total Productive Maintenance
Toyota Production System
Total Quality Control
Total Quality Management
United Nations Environment Programme
United Nations Framework Convention on Climate Change
U.S. Green Building Council
U.S. Geological Survey
World Business Council for Sustainable Development
World Commission on Environment and Development
World Resources Institute
World Steel Association
1
Chapter One: Introduction
1.1 Introduction
Climate change is said to be one of the biggest threats to future development. According to
the Intergovernmental Panel on Climate Change (IPCC, 2007), eleven of the last twelve years
(1995-2006) ranked among the twelve warmest years in the instrumental record of global
surface temperature since 1850. At the same time, global average sea level has risen since
1960 at an average rate of 1.8 mm/year and since 1993 at 3.1 mm/year, which has
considerable impact on future development, especially on countries like Singapore which is
surrounded by sea from all sides (IPCC, 2007). Billions of people are exposed to natural
disaster risks, including weather-related disasters that take lives, damage infrastructure and
natural resources, and disrupt economic activities (Pelling, et al., 2004). There is broad
consensus that global climate change has been caused by an increase in greenhouse gas (GHG)
emissions from both natural and man-made sources (Environment Agency, 2005). However,
human activity is believed to be the most significant source of emissions, which is mainly
caused by fossil fuel consumption such as petrol, gas, oil and diesel.
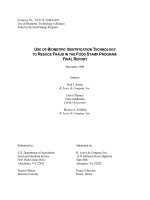
The building sector is the largest source of greenhouse gas emissions in the US, as shown in
Figure 1.1. According to the American Institute of Architects (2007), it is estimated that
nearly 50% of all the greenhouse gas emissions are generated by buildings and their
construction in terms of the energy used in the production of materials, transportation of
materials from production factories to construction sites, as well as energy consumed in the
operation stage. According to the United Nations Environment Programme (UNEP, 2007a),
the life cycle of energy consumption in buildings can be divided into five phases, from
production to demolition. The first phase is related to the production of construction materials,
which is referred to as “embodied energy” (also known as “Cradle-to-Gate”). Building is a
complex combination of different materials, contributing to embodied energy of the whole
2
building. In the construction industry, concrete, steel and aluminum are considered as
materials with high embodied energy due to the complexity of the materials and large amount
of processes required for their manufacture. The second and third phases correspond to the
energy used to transport construction materials from production factories to construction sites,
as well as the building construction, which are referred to as grey energy and induced energy
respectively. The fourth consumption phase is the operation stage of the building, which
corresponds to the energy consumption in the running of the building and is often referred to
as operation energy. Finally, energy is consumed in the demolition stage as well as in
recycling of the parts. The building sector is responsible for almost 50% of the greenhouse
gas emissions but there is considerable potential to control and cut down the emissions (AIA,
2007).
Figure 1.1 U.S. CO
2
emissions by sectors
(Source: AIA, 2007)
Most research relating to carbon emissions reduction is concerned about technical innovations,
many of which are highly costly and may take several decades before promising
breakthroughs can actually happen. Little has been done about how management
improvements can help to eliminate carbon emissions. This can be seen from one
phenomenon that all major green building rating systems, including LEED, Green Globes and
BCA Green Mark, rely heavily on innovative design, technologies and materials. Only limited
credits are allocated to management practices (Wu and Low, 2010). However, not all
3
production and construction activities are always efficient. There remains many non-value
adding activities which consume energy, leading to carbon emissions. The role of project
management, which is represented through the cutting down of non-value adding activities
(also known as the lean philosophy), in reducing carbon emissions in the precast concrete
industry, should be identified.
1.2 Problem statement
Global actions have been made to reduce GHGs emissions to achieve long term sustainable
development. According to Stern (2007), most actions that have been taken to reduce carbon
emissions are focused on technical issues, including:
1. Increased energy efficiency;
2. Changes in demand for energy intensive technologies;
3. Adoption of clean power, heat and transport technologies;
4. Carbon pricing and budgeting through tax, trading and regulations;
5. Supporting innovation and deployment of low carbon technologies; and
6. Remove barriers to energy efficiency: inform, educate and persuade individuals to
change their behaviour.
Kruse (2004) stated that general strategies that are currently adopted in the construction
industry to address climate change include:
1. Government taxation and regulations, which include rewards for energy efficiency,
raising energy efficiency standards for construction, as well as calling for increased
transparency in energy consumption (e.g. Singapore National Climate Change Strategy
2008).
2. Voluntary targets. The construction industry should set reporting metrics, while
individual companies should set targets (Rehan and Nehdi, 2005).
3. Process and technology innovation (Spence and Mulligan, 1995).
4
4. Adopting low carbon fuels (Hendriks et al., 1999).
5. Identifying alternative low carbon raw materials (Ellis, 2004).
6. CO
2
capture and sequestration (Herzog, 2001).
7. Emissions trading (Szabo et al., 2006).
However, these actions are not always feasible in the construction industry, especially when
global recognition to reduce carbon emissions is still in its infancy. It can take years before
the costs of adopting clean power and energy efficient materials and resources are affordable
to construction companies. In addition, the development of innovation and deployment of low
carbon technologies cannot be done once and for all. It is a long term improvement and may
take several decades before promising breakthroughs can actually happen, which seems to be
contradictory with the current situation that reducing carbon emissions is imperative. Carbon
pricing is not sufficient to the industry on the scale and pace required as future pricing
policies of governments and international regulatory bodies cannot be 100% credible (Stern,
2007). Thus, investigation of other viable, affordable and beneficial options for the
construction industry is important. This is the reason why management improvements are
investigated in this research to provide a more cost effective solution to the current urgency in
reducing carbon emissions, as illustrated in Figure 1.2.
Barriers: Drivers:
High costs Tax incentives
Long research duration Regulations
Not 100% credible Public perceptions
Figure 1.2 The need for research into other viable options
In addition, the literature and information relating to the carbon inventory in the Singapore
5
construction industry are very limited. Although world-wide average data can be applied in
Singapore to obtain first-level calculations of the carbon emissions from construction
activities, these calculations are not accurate enough, because one needs to consider that
Singapore is a small country which relies heavily on the import of resources. The
Singapore-specific emissions factors are necessary for the country to develop its own carbon
inventory. Methodologies and results presented in the research will offer useful information
for Singapore to develop its own carbon inventory.
The conventional economic analysis of the environmental impacts, especially in carbon
related studies, are based on cost-benefits analysis (e.g. Peck and Teisberg, 1992; Manne et al.,
1995). However, this cost-benefit analysis may lead to several problems, which include:
Conventional economic analysis of the environmental impacts gives less importance to
flows that take place in the future (Broome, 1992; Price, 1993, 1996). As Padilla (2004,
p527) stated: “the application of conventional discounting devalues and practically
removes from the analysis the impacts that occur in the distant future in such a way that
for these models the maintenance of the necessary conditions for life far in the future is
of negligible present value”. There are certain rights of future generations that should be
respected and be taken account in the analysis (Padilla, 2002).
Monetary compensation is not always appropriate when evaluating the environmental
impacts. The intrinsic values of the ecosystems are not well understood and analysts
tend to use the monetary values to determine the preferred policies (Lave and
Dowlatabadi, 1993). Many authors argued that extreme care should be paid when
conducting value judgements in environmental studies (Padilla, 2002, 2004; Broome,
1992).
Conventional economic analysis of the environmental impacts assumes that the Earth
6
and all its resources, including the climatic system, belong to the present, and that it has
the right to do with whatever the analysis shows as acceptable – including the right to
destroy them (Padilla, 2002). According to Padilla (2002), the analysts tend to
undervalue the losses and overvalue the economic gains, hence leading to the
recommendation that either say emissions control should be mild, or that there should
be no control, at least in the short term.
It seems that the evaluation method of the environmental impacts, especially in the
carbon-related studies, should evolve to overcome the problems stated above. A new
measurement should be introduced to the evaluation system.
1.3 Research aim and objectives
Originated from the Toyota Production System, the lean production philosophy was
developed as a new way of thinking which advocates reducing or eliminating non-value
adding activities, as well as improving the efficiency of value adding ones at the same time.
The lean philosophy can be considered as a new way to design and make things differentiated
from mass and craft forms of production by the objectives and techniques applied on the shop
floor, in design and along supply chains (Howell, 1999).
By applying the lean principles in the construction industry, non-value adding activities,
which consume energy and generate carbon emissions in the production, delivery and
construction processes can be identified and eliminated. Unlike other carbon reducing
techniques, such as introducing high performance building components to reduce energy
consumption, which often incorporate high investment costs, the lean principles are more
amenable at a managerial level. It seeks to build up a sustainable managerial environment
which promotes an aggressive search for non-value adding activities, which are often referred
to as wasteful, inefficient and ineffective activities.