Topological and kinetics considerations in the glass formation of AL rich AL ni based alloys
Bạn đang xem bản rút gọn của tài liệu. Xem và tải ngay bản đầy đủ của tài liệu tại đây (16.56 MB, 171 trang )
TOPOLOGICAL AND KINETICS CONSIDERATIONS IN
THE GLASS FORMATION OF AL-RICH AL-NI BASED
ALLOYS
LIM KAI YANG
(B.Eng. (Hons.), NTU)
A THESIS SUBMITTED
FOR THE DEGREE OF DOCTOR OF PHILOSOPHY
DEPARTMENT OF MATERIALS SCIENCE &
ENGINEERING
THE NATIONAL UNIVERSITY OF SINGAPORE
2008
Acknowledgement
I am especially grateful to my supervisor A/Prof. Li Yi for his invaluable guidance
and advice throughout my entire candidature in the department. His mentorship is
instrumental in helping me mature as a research scientist.
To all members in the research group of Non-equilibrium Materials Laboratory, my
sincere thanks for their help rendered, and the fruitful discussions.
Special mention also to all the Laboratory Officers of the Department of Materials
Science and Engineering for their assistance.
Last but not the least, I would like to acknowledge the support of the National
University of Singapore for granting me the scholarship, and for offering the cradle to
nurture me as a research scientist.
Mar 2008
Singapore Kai Yang, LIM
i
TABLE OF CONTENTS
Acknowledgements i
Table of Contents ii
Abstract vi
List of Tables vii
List of Figures ix
1 Introduction 1
1.1 Background 1
1.2 Motivation of Study 2
1.3 Scope of Thesis 3
References 4
2 Literature Review 5
2.1 Introduction 5
2.1.1 Development of Metallic Glass 5
2.1.2 Understanding Glass Formation 8
2.1.2.1 The Driving Force for Glass Formation 9
2.1.2.2 The Kinetics of Glass Formation 10
ii
2.2 Background to Al-based Amorphous Alloys 12
2.2.1 Background to Al-based Alloys 12
2.2.2 History of Al-based Amorphous Alloys 13
2.2.2.1 Binary Al-based Alloys 13
2.2.2.2 Ternary Al-based Alloys 17
2.3 Mechanical Properties of Al-based Amorphous Alloys 24
2.4 Structural Studies at the Atomic Level of Amorphous Alloys 27
2.4.1 Atomic Level Structural Studies of Al-based
Amorphous Alloys
30
2.5 Current Criteria/Parameters/Models to Locate Metallic Glass 33
2.5.1 Turnbull’s T
rg
Criterion – Avoidance of Nucleation 33
2.5.2 Li’s Phase Competition - Suppression of Growth of
Nuclei
35
2.5.3 Egami’s Topological Instability Criterion 39
2.5.4 Other Criteria and Parameters to Locate Glass 40
2.5.5 Miracle’s Efficient Cluster Packing – Structural Model 41
2.5.6 Modified ECP Model 42
2.5.7 Other Structural Models 43
References 44
3 Experimental Procedures 53
3.1 Sample Preparation 53
3.1.1 Alloy Preparation 53
3.1.2 Melt Spinning Technique 54
3.1.3 Wedge Casting Technique 55
3.2 Thermal Analysis 56
3.2.1 Differential Scanning Calorimetry - Isochronous 56
3.2.2 Differential Scanning Calorimetry - Isothermal 57
3.2.3 Melting Studies 57
3.3 Microstructure Characterization 57
3.3.1 Crystallography - X-Ray Diffractometry 57
3.3.2 Microstructure Characterisation 58
References 58
iii
4 Glass Forming Ability of Al-Ni Alloys 59
4.1 Introduction 59
4.2 Results 60
4.2.1 Melting Studies 60
4.2.2 DSC Studies 63
4.2.3 XRD Studies 65
4.2.4 Microstructure Studies 67
4.3 Analysis and Discussion 71
4.3.1 Skewed Eutectic Coupled Zone 71
4.3.2 Glass Forming Ability of Al
78.5
Ni
21.5
73
4.3.3 Topological Instability Criterion 75
4.4 Summary 77
References 79
5 Glass Forming Ability of Al-Ni-(Zr, Hf or Ti) Alloys 81
5.1 Introduction 81
5.2 Results and Analysis 84
5.2.1 Equilibrium Ternary Phase Diagrams 84
5.2.2 Results of Al-rich Al-Ni-Zr Alloys 86
5.2.2.1 Initial GFA Study on the Al
94-x
Zr
6
Ni
x
alloys
Multiple Maxim
86
5.2.2.2 a in GFA in the Al-Ni-Zr 88
ys
l-Ni-Zr Alloys
.2.3 of
5.2.3.1
99
5.2.3.2 103
s
.2.3.4 ummary of Results of Al-Ni-Hf Alloys 109
Alloy System
5.2.2.3 Melting Studies of Al-rich Al-Ni-Zr Allo 95
5.2.2.4 Summary of Results of A 97
5 Results Al-rich Al-Ni-Hf Alloys
Optimum Glass Former in the High Solute
99
Content Region of Al-rich Al-Ni-Hf Alloys
Optimum Glass Former in the Low Solute
Content Region of Al-rich Al-Ni-Hf Alloys
5.2.3.3 Melting Studies of Al-rich Al-Ni-Hf Alloy 107
5 S
iv
5.2.4 of
5.2.4.1 XRD Results of Al-rich Al-Ni-Ti 111
s
4.3 Summary of Results of Al-Ni-Ti Alloys
.3 s
erations
.3.3 ic
5.3.3.1 Topological 120
ster Packing Model
.3.3 Modified ECP Model
.4
eferen es 130
ss F ility of Al-Ni-Y Alloys
.2 s
6.2.2 Forming Zones in both Al-Ni-Y and 135
t Glass Former due to Topological Factors
.3 s
rs
6.3.3 a in Glass Formability in Al-rich Al-
-RE Alloys
144
.4
eferences 147
Conclusion 149
Results Al-rich Al-Ni-Ti Alloys
DSC and
110
Alloys
5.2.4.2 Melting Studies of Al-rich Al-Ni-Ti Alloy 114
5.2. 115
5 Discus ion 116
5.3.1 Thermodynamics Consid 117
5.3.2 Kinetics Considerations 117
5 Topolog al Considerations
Egami and Waseda’s
120
Instability Criterion
5.3.3.2 Miracle’s Efficient Clu 122
5.3 126
5 Summary 127
R c
6 Gla orming Ab 132
6.1 Introduction 132
6 Result and Analysis 134
6.2.1 Equilibrium Ternary Phase Diagram
Two Amorphous
134
Al-Ni-La Alloys
6.2.3 Bes 140
6 Discus ion 142
6.3.1 Best Glass Former due to Topological Facto 143
6.3.2 Best Glass Former due to Kinetics Factors
Multiple Maxim
144
Ni
6 Summary 147
R
7
v
Abstract
pointed to the composition at high solute contents where the addition of large sized
vi
Our meticulous study of the glass forming ability (GFA) of the Al-rich Al-Ni
composition range, pointing to a skewed eutectic coupled zone, which coincided
alloy revealed the existence of a fully eutectic microstructure at a hypereutectic
atoms with strong chemical affinity were effective in suppressing eutectic growth.
alloys where atomic arrangement most efficiently fill space.
optimal glass formers were located in a single eutectic. Kinetic considerations
On the other hand, topological considerations directed to the lower solute content
with the observation of a possible glass formation at a Ni-enrich alloy. This finding
prompted us to give equal weight to both the high, and low Ni content compositions
in our subsequent study of the GFA of Al-Ni based alloys containing Zr, Hf, Ti and Y
Indeed, in each of the Al-rich Al-Ni-Zr, Al-Ni-Hf and Al-Ni-Y alloys system, two
ist of Tables
.1 morphous formation by various quenching techniques and the critical
thicknesses achieved in binary Al-based alloy systems to date.
16
.2 morphous formation by melt spinning and the critical thicknesses
achieved in ternary Al-LTM-Metalloid alloy systems to date.
18
.3 morphous formation by melt spinning and the critical thicknesses
achieved in ternary Al-LTM-ETM alloy systems to date.
19
2.4 ation by melt spinning and wedge casting, and the
ritical thicknesses achieved in key multinary Al-LTM-RE alloy
systems to date.
22
.5 ummary of Structural studies on amorphous Al-RE-LTM alloy
systems studied to date.
32
.1 omparison of the calculated effective atomic radii of Al and Ni, against
that of the standard Goldschmidt atomic radii.
76
.2 hermal properties, crystallography and microstructure of 20-40 μm
thick melt spun ribbons of the Al
100-x
Ni
x
alloy system.
78
.1 ffect of ETM on the GFA of Al
70
LTM
20
ETM
10
alloys by melt
spinning, adapted from Ref [4].
82
L
2 A
2 A
2 A
Amorphous form
c
2 S
4 C
4 T
5 E
vii
5.2 abulated data on optimum glass formers in the Al-Ni-Ti, Al-Ni-Zr and
Al-Ni-Hf alloy systems and their critical sizes for full glass formation
116
5.3 actual and predicted (both bcc and fcc) topologies of the
ptimum glass formers in the Al-rich Al-Ni-Zr, Al-Ni-Hf and Al-Ni-Ti
alloy systems.
124
5.4 on of actual and predicted compositions based on modified
CP model, of the optimum glass former in the Al-Ni-ETM alloy
systems.
128
.5 hermal properties, crystallography and critical sizes of representative 129
.1 Table listing Heats of Mixing between RE metal and Al, and the atomic
sizes of various common RE metals.
146
T
Comparison of
o
Comparis
E
5 T
alloys in the Al-Ni-Zr, Al-Ni-Hf and Al-Ni-Ti systems.
6
viii
ist of Figures
2.1 n of Gun Quenching Technique developed at at the California
stitute of Technology for the amorphization of metallic alloys, after
Ref. [2].
6
.2 ritical casting thickness in cm for glass formation as a function of the
year the corresponding alloy has been discovered, after Ref. [38].
7
2.3 iagram showing the high stability of the BMG forming
percooled liquid for long time-scale up to several thousand seconds,
after Ref. [41].
11
2.4 engineering
lloys, moderate strengths coupled with low densities means Al-based
alloys has one of highest specific strengths, after Ref. [43].
13
2.5 position and wheel speeds on the observed
icrostructure of melt spun ribbons of (a) Al-Cu and (b) Al-Ni alloys,
after Ref. [53].
15
.6 olyhedra formed by the dense random packing of hard spheres,
according to Bernal [103].
28
2.7 trigonal prismatic coordination polyhedron and (b) edge-
aring of polyhedra observed in the Fe
3
C, cementite structure, after
Ref. [104].
29
L
Illustratio
In
2 C
Schematic TTT d
su
Ashby Chart showing specific strengths of various common
a
Influence of com
m
2 P
(a) Regular
sh
ix
2.8 omogeneous nucleation rate, Log I vs reduced temperature, T
r
plot for
metallic liquids with various T
RG
values. Dashed line at Log I = -6,
34
2.9
zone, and (b) an irregular eutectic system with an asymmetrical
kewed) eutectic coupled and glass forming zone; and the growth
temperature of the constituents as function of the growth rate, after Ref.
37
3.1 llustration showing the amorphous, nanocrystalline, and
rystalline regions. The curved line that separates the amorphous region
from the composite area is taken to be the critical size for full glass
56
4.1 Equilibrium phase diagram on the Al-rich side of the Al-Ni alloy, after
.
61
4.3 mposed on the equilibrium phase
iagram. “●” delineate the solidus temperature, “▼” and “▲” mark the
temperatures of peritectic reactions, and “■” traces the liquidus
63
4.4 DSC traces of 20-40 μm thick melt spun ribbons of the Al
100-x
Ni
x
64
4.5 DSC traces of 20-40 μm thick melt spun ribbons of the Al
100-x
Ni
x
64
4.6 XRD pattern on free-side of 20-40 μm thick of melt spun ribbons of the 65
4.7 XRD pattern on free-side of 20-40 μm thick of melt spun ribbons of the 66
4.8 pun ribbons of the
l
100-x
Ni
x
alloys, for x = 26.0 – 30.0 at%.
66
H
below which the solid is taken to be fully glass, after Ref. [122].
(a) A regular eutectic system with a symmetrical eutectic and glass
forming
(s
[127].
Schematic i
c
formation.
Ref [16]. Green box shows the composition range of alloys studied
4.2 Melting curves at 0.17 Ks
-1
of Al
100-x
Ni
x
(x = 11 - 29 at%) alloys.
Results from melting studies superi
62
d
temperatures of the alloys studied.
alloys, for x = 11 – 30 at%, at a heating rate of 0.33 Ks
-1
. .
alloys, for x = 21.0 – 22.0 at%, at a heating rate of 0.33 Ks
-1
.
Al
100-x
Ni
x
alloys, for x = 11.0 – 22.0 at%.
Al
100-x
Ni
x
alloys, for x = 19.5 – 22.0 at%.
XRD pattern on free-side of 20-40 μm thick of melt s
A
x
4.9 Schematic illustration of the evolution of crystallography of the as-spun
ribbons as Ni content is changed from 11 to 30 at%.
67
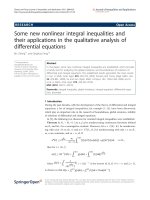
4.10 BSE images of cross-section of as-spun ribbons at low magnification 68
.11 SE images of cross-section of as-spun ribbons at low magnification for
(a) x = 20.5, (b) x = 21.5, (c) x = 22.5 and at high magnification (d-f) x =
69
4.12 BSE images of cross-section of as-spun ribbons at low magnification for
e)
70
,
4.16 Graph showing change of critical size factor, λ as a function of Ni
77
5.1 Schematic diagram showing heats of mixing between Al and the solute 83
5.2 Al-rich corner of ternary phase diagrams of (a) Al-Ni-Zr (800
0
C
)
85
5.3 l rich Al-Zr-Ni
lloy series Al
94-x
Zr
6
Ni
x
, where x = 8-22 at % at 2 at% interval, at a
heating rate of 0.33 Ks
-1
.
87
for (a) x=11, (b) x=13, (c) x=15, and at high magnification (d-f) x = 11,
13, 15.
4 B
20.5 - 22.5. Dashed line encircled thin layer of ribbon (e) possibly
showing amorphous phase.
(a) x = 23, (b) x = 29, (c) x = 30 and at high magnification (d) x = 23, (
x = 29, and (f) x =30.
4.13 Schematic illustration of microstructure of cross-section of 20-40 μm
thick melt spun ribbons in this alloy series.
72
4.14 Schematic illustration of expected microstructure of this alloy system
superimposed in a cooling rate, V, against Ni content space.
72
4.15 DSC traces for 20-40 μm thick melt spun ribbons at 40 and 45 ms
-1
of
the Al
100-x
Ni
x
alloys, for x = 21.5 and 22.5 at%, heating rate - 0.33 Ks
-1
.
74
content superimposed on the equilibrium phase diagram of the Al-Ni
binary alloy.
atoms and their standard atomic sizes in comparison with that of Al for
the (a) Al-Ni-Zr, (b) Al-Ni-Hf and (c) Al-Ni-Ti alloy systems.
isothermal section), (b) Al-Ni-Hf (600
0
C isothermal section), and (c
Al-Ni-Ti (600
0
C isothermal section), adapted from Ref [9].
DSC traces of 20-40 μm thick as-spun ribbons of the A
a
xi
5.4 Change in heat of crystallization of the Al
94-x
Zr
6
Ni
x
alloy series, as x,
the Ni content increases from 8-22 at % at 2 at% interval.
87
5.5 XRD patterns on free side of 20-40 μm thick as-spun ribbons of the Al-
3 Ks .
s adjacent alloys.
5.11 DSC traces of 20-40 μm thick as-spun ribbons of Al
82.0
Zr
5.0
Ni
13.0
92
d) and its adjacent alloys.
Al
81
Zr
5
Ni
14.
Zr-Ni alloy series, Al
94-x
Zr
6
Ni
x
, where x = 8-22 at 2 at% interval.
88
5.6 DSC traces of 20-40 μm thick as-spun ribbons of Al
75.5
Zr
5.5
Ni
19.0
-1
(center, in red) and its adjacent alloys, at a heating rate of 0.3
89
5.7 XRD patterns on free side of 20-40 μm thick as-spun ribbons of the
Al
75.5
Zr
5.5
Ni
19.0
alloy (center, in red) and it
90
5.8 Isothermal DSC curves up to 30 min at temperatures 648 and 653 K
for the alloy composition Al
75.5
Zr
5.5
Ni
19.0
.
90
5.9 SEM micrographs of (a) as-spun ribbon at a rotating wheel speed of 30
ms
-1
, and (b) wedge cast ingot of alloy Al
75.5
Zr
5.5
Ni
19.0
.
91
5.10 SEM micrographs of (a) as-spun ribbon at a rotating wheel speed of 30
ms
-1
, and (b) wedge cast ingot of alloy Al
74.5
Zr
5.5
Ni
20.0
.
92
(second from top, in red) and its adjacent alloys, at a heating rate of 0.33
Ks
-1
.
5.12 XRD patterns on free side of 20-40 μm thick as-spun ribbons of
Al
82
Zr
5
Ni
13
(second from top, in re
93
5.13 Isothermal DSC curves up to 30 min at temperatures 598 and 601 K for
the alloy composition Al
82
Zr
5
Ni
13
.
94
5.14 SEM micrographs of (a) as-spun ribbon at a rotating wheel speed of 30
ms
-1
, and (b) wedge cast ingot of alloy Al
82
Zr
5
Ni
13.
94
5.15 SEM micrographs of (a) as-spun ribbon at a rotating wheel speed of 30
ms
-1
, and (b) wedge cast ingot of alloy
94
xii
5.16 Melting behaviour of Al
75.5
Zr
5.5
Ni
19
(centre, in brown) and its adjacent
alloys, at a heating rate of 0.17 Ks
-1
.
96
5.17 Melting behaviour of Al
82
Zr
5
Ni
13
(second from top, in orange) and its
adjacent alloys, at a heating rate of 0.17 Ks
-1
.
96
5.18 Liquidus and solidus surfaces of the Al-rich Al-Zr-Ni alloys. Optimum 97
5.20 DSC traces of as-spun ribbons of alloys in the vicinity of alloy
a
100
, in red), at ≤1 at% interval.
40
5.25 DSC traces as-spun ribbons of alloy series Al
100-3x
Hf
x
Ni
2x
, x = 4 to 7
104
his
5.27 oy series Al
100-
Hf
x
Ni
2x
, x = 4 to 7 at% at ≤1 at% interval, and Al
100-2.5x
Hf
x
Ni
1.5x
, x =
5 to 8 at% at ≤1 at% interval
105
best glass formers: Al
75.5
Zr
5.5
Ni
19.0
and Al
82
Zr
5
Ni
13
marked with blue
and red spheres, respectively.
5.19 Schematic illustration of alloys studied in this work, best glass formers
in each amorphous forming region are highlighted in red.
98
Al
75.5
Hf
6.5
Ni
18
(third from top, in red)
,
at ≤1 at% interval, and at
heating rate of 0.33 Ks
-1
.
5.21 XRD patterns on free-side of as-spun ribbons of alloys in the vicinity
of alloy Al
75.5
Hf
6.5
Ni
18
(third from top
101
5.22 Isothermal DSC curves up to 30 min at temperatures 663 and 668 K for
the alloy composition Al
75.5
Hf
6.5
Ni
18
.
102
5.23 SEM micrographs of (a) as-spun ribbon at a rotating wheel speed of 40
ms
-1
, and (b) wedge cast ingot of alloy Al
75.5
Hf
6.5
Ni
18
.
102
5.24 SEM micrographs of (a) as-spun ribbon at a rotating wheel speed of
ms
-1
, and (b) wedge cast ingot of alloy Al
74.5
Hf
6.5
Ni
19
.
103
at% at ≤1 at% interval, and Al
100-2.5x
Hf
x
Ni
1.5x
, x = 5 to 8 at% at ≤1 at%
interval, at a heating rate of 0.33 Ks
-1
.
5.26 Change in heat of crystallization of the Al-Ni-Hf alloys studied in t
work, against the Ni content in the alloys.
105
XRD patterns on free-side of as-spun ribbons of all
3x
xiii
5.28 SEM micrographs of (a) as-spun ribbon at a rotating wheel speed of 40
ms
-1
, and (b) wedge cast ingot of alloy Al
85
Hf
6
Ni
9
106
5.29 SEM micrographs of (a) as-spun ribbon at a rotating wheel speed of 40
Al
85
Hf
5
Ni
10
5.33
Liquidus and solidus surfaces of Al-rich Al-Hf-Ni alloys. Optimum best
d
109
st potential
5.35 DSC traces of as-spun ribbons of Al-rich Al-Ti-Ni alloys 112
.
ith black sphere.
5.39 ,
,
119
ms
-1
, and (b) wedge cast ingot of alloy
106
5.30 Isothermal DSC curves up to 30 min at temperatures 596 and 601 K
for the alloy composition Al
85
Hf
6
Ni
9
.
107
5.31 Melting behaviour of alloy series Al
93.5-x
Hf
6.5
Ni
x
, x = 17 to 19 at%, at
≤1 at% interval, and at a heating rate of 0.17 Ks
-1
.
108
5.32 Melting behaviour of low solute content alloy series Al
100-2.5x
Hf
x
Ni
1.5x
,
x = 6 to 8 at%, at ≤1 at% interval, and at a heating rate of 0.17 Ks
-1
.
108
glass formers: Al
75.5
Hf
6.5
Ni
18.0
and Al
85
Hf
6
Ni
9
marked with black an
red spheres, respectively.
5.34 Schematic illustration of alloys studied in this work, the be
glass former is highlighted in red.
110
adjacent to Al
85
Ti
5
Ni
10
and Al
75.5
Ti
5.5
Ni
19,
and at a heating rate of 0.33
Ks
-1
.
5.36 XRD patterns on free-side of as-spun ribbons of Al-rich Al-rich Al-Ti-
Ni alloys adjacent to Al
85
Ti
5
Ni
10
and Al
75.5
Ti
5.5
Ni
19
113
5.37 Liquidus and solidus surfaces of the Al-rich Al-Ti-Ni alloys. Optimum
glass former Al
80
Ti
8
Ni
12
marked w
114
5.38 Schematic illustration of alloys studied in this work, the best potential
glass former is highlighted in red.
115
XRD patterns of on free side of 20-40 μm thick as-spun ribbons
showing suppression of Al+Al
3
Ni eutectic with the addition of (a) Zr
and (b) Hf, best glass former highlighted in red.
xiv
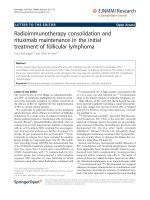
5.40 alculated topological instability factor, λ, as a function of solute
content in the (a) Al-Ni-Zr (b) Al-Ni-Hf and (c) Al-Ni-Ti alloy system.
lack,
121
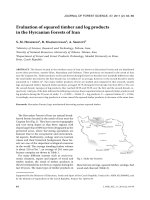
5.41
entric clusters, composed of one Zr
rrounded by 10 Al atoms, (e) Hf-centric clusters, one Hf surrounded
by 11 Al atoms, and (f) Ti-centric clusters, one Ti surrounded by 9 Al
125
5.42 Schematic illustration showing the experimentally determined heats of 128
6.1 Schematic diagram showing heats of mixing between Al, Ni and (a) Y; 134
6.5 Change in heat of crystallization of the (a) Al
94-x
Y
6
Ni
x
alloy series, as x,
5
Ni
x
, as x, the Ni content increases from 8-21 at % at <5 at%
interval.
137
.6 RD patterns of as-spun ribbons of Al-rich Al
94-x
Y
6
Ni
x
alloy series, as
x, the Ni content increases from 6-21 at % at <3 at% interval.
139
C
Best glass formers are represented as red, other alloys studied as b
and compositions at which λ=0.1 as blue spheres.
Schematic illustrations of the predicted topology of fcc packing
arrangement of (a) Zr-centric clusters, consisting one Zr surrounded by
8 Al atoms (white spheres), (b) Hf-centric clusters, one Hf surrounded
by 9 Al atoms, (c) Ti-centric clusters, one Ti surrounded by 8 Al atoms,
with Ni atoms (green spheres) occupying all of the β- and γ-sites; and
bcc-packing arrangement of (d) Zr-c
su
atoms, with Ni atoms (green spheres) occupying all of the β-sites. γ-sites
are unavailable in the bcc packing.
mixing between each atomic pair in the Al-Ni-ETM alloy systemsm
where ETM represents (a) Zr, (b) Hf, and (c) Ti.
and (b) La atoms and their standard atomic sizes in comparison with
that of Al.
6.2 Al-rich corner of ternary Al-Ni-Y phase diagram (800
0
C isothermal
section), adapted from Ref [11].
135
6.3 DSC traces of as-spun ribbons of Al-rich Al
94-x
Y
6
N
x
alloy series where
x = 6 - 23 at%, at <3 at% interval, and at a heating rate of 0.33 Ks
-1
.
136
6.4 DSC traces of as-spun ribbons of Al-rich Al
95-x
La
5
N
x
alloy series where
x = 8 - 21 at%, at <3 at% interval, and at a heating rate of 0.33 Ks
-1
.
137
the Ni content increases from 6-23 at % at <3 at% interval; and (b)
Al
95-
x
La
6 X
xv
xvi
6.7 erns of as-spun ribbons of Al-rich Al
95-x
La
5
Ni
x
alloy series, as
, the Ni content increases from 8-21 at % at <3 at% interval.
139
6.8 140
EM
set on right corner of (b) and (c) show a diffused ring only – ribbons
were fully amorphous.
.10 EM micrographs of wedge cast ingot of alloy (a) Al
85
Y
6
Ni
9
(critical
size = ~360 μm), and (b) Al
83.75
Y
6.5
Ni
9.75
(critical size = ~320 μm).
142
6.11 of alloy Al
87
La
5
Ni
8
(critical size
= ~376 μm).
142
6.12 Schematic illustration of alloys studied in this work, best glass formers
in each amorphous forming region in (a) Al-Ni-Y and (b) Al-Ni-La
alloys systems are highlighted in red.
145
XRD patt
x
(a) DSC traces and (b) XRD patterns of as-spun ribbons of Al-rich
Al
100-2.5x
Y
x
Ni
1.5x
alloy series where x = 5.5 – 7.0 at%, at <0.5 at%
interval.
6.9 SEM micrographs of as-spun ribbons of Al-rich Al
100-2.5x
Y
x
Ni
1.5x
alloy
series where x = (a) 5.5 at%, (b) 6 at%, (c) 6.5 at% and (d) 7 at%. T
in
141
6 S
SEM micrographs of wedge cast ingot
Chapter 1
Introduction
1.1 Background
Traditionally, glasses are closely associated with the oxides of silicon (Si),
sodium (Na), calcium (Ca), aluminum (Al) and boron (B); and silicon dioxide (silica,
SiO
2
) is a chief ingredient that often constitute more than 70% of the typical glasses
1
.
But in 1959, revolutionary work by Duwez et al at the California Institute of
Technology thrust metallic alloys into the limelight, by the successful quenching of a
molten Au-Si alloy in the laboratory, using a gun quenching technique
2,3
to form glass.
Since then, many binary and ternary metallic alloys have been found to amorphize to
form glass, this new class of materials was termed metallic glasses (MG’s). However,
more often than not, the quench from melt required extremely high cooling rates in
1
the order of 10
6
Ks
-1
, glasses so produced were in the micron-size, negating much
practicality.
Over the years, fervent research efforts have extended glass formation to many
other alloy systems, and have also increased tremendously the critical size for full
glass formation to the order of centimeters. Today the record holder for the largest
critical size for full glass formation stands at 72 mm in the Pd-based alloy system
4
. On
the contrary, critical sizes for Al-based amorphous alloys remained in the microns
sized range, despite much effort by researchers to enhance the glass forming ability
(GFA) of the Al-based amorphous alloys.
1.2 Motivation of Study
It is under this backdrop of challenging scientific hurdle that we embarked on
our research study, aiming to carve a niche for ourselves in the study of glass
formation in Al-based amorphous alloys. Current studies of glass formation in Al-
based metallic glasses were often focused on rare earth (RE) containing Al-based
MG’s (see Section 2.2.2). It was commonly believed that the strong chemical affinity
between the RE and the other elements in the alloy, as evidenced by the large negative
heats of mixing between the atomic pairs can lead to better GFA
5
. Yet this chemical
affinity is also enjoyed by Al-Ni-based alloys containing early transition metals like
Ti, Zr, and Hf. Ironically, this class of alloys were also amongst the first to be
reported to exhibit amorphous formation
6,7
, and yet has now been largely neglected by
most in glass formation studies.
Additionally, from studies of GFA in other alloy systems by our research
group, we have established that GFA is strongly composition dependent, small
2
changes of ~1 at% can greatly influence the critical size for full glass formation in
amorphous forming alloys
8,9
. Moreover, a recent rigorous study of the GFA of Al-Ni-
RE alloys discovered that the best glass former were unanimously located at a
composition of Al
85
Ni
10
RE
5
where (RE = La, Ce, Pr, Nd and Mm)
10
. The reason for
this “coincidence” was not clear. Therefore, in this work, by meticulously studying
the effect of compositional change on the GFA of the Al-Ni-based alloy systems
containing Ti, Zr, Hf, and Y, we hope to gain a better understanding of glass
formation in Al-based alloys.
Finally, it has been well-established that topological, kinetics and
thermodynamics considerations are essential to understanding glass formation. But
how these three factors interact with one another is still unclear. Through our study,
we provide strong evidence to show that topological and kinetics considerations each
point to one composition, in which glass formation is most favoured.
1.3 Scope of Thesis
This thesis begins with an introduction (Chapter 1) followed by a literature
survey (Chapter 2) on the development of, and properties of Al-based amorphous
alloys; and the structural studies, models, and criteria that would later be invoked to
explain and/or predict glass formation in the alloy systems in our study. The
experimental procedures are described in Chapter 3. In our study of the GFA of Al-Ni
binary alloys (Chapter 4) by melt spinning, the existence of a fully eutectic
microstructure at hypereutectic compositions, pointed to a severely skewed eutectic
coupled zone, and this composition range corresponded very well with the
observation of possible glass formation. This prompted us to give equal focus to both
3
4
the high and low solute content regions in our search for the optimum GFA in Al-rich
Al-Ni-based alloys containing Zr, Hf and Ti alloys in Chapter 5. Two peaks in GFA
in a single eutectic were found in the Al-Ni-Zr and Al-Ni-Hf, but not in the Al-Ni-Ti
alloy systems. The unique GFA of these alloy systems were discussed from
topological and kinetic considerations. The hypothesis that the optimum glass formers
in the low and high solute content regions can be explained by topological and kinetic
considerations, respectively, was eventually successfully proven in both the Al-Ni-Y
and Al-Ni-La alloy systems in Chapter 6. The thesis is concluded in Chapter 7.
References
1
R. W. Cahn, and P. Hassen, Physical Metallurgy, 4th ed. (New York, North-
Holland, 1996).
2
W. Klement, R. H. Willens, and P. Duwez, Nature 187, 869 (1960).
3
P. Duwez, R. H. Willens, and W. Klement, J. Appl. Phys. 31, 1136 (1960).
4
A. Inoue, N. Nishiyama, and H. Kimura, Mater. Trans. JIM 38, 179 (1997).
5
A. Inoue, K. Ohtera, A. P. Tsai, and T. Masumoto, Jpn. J. Appl. Phys. Part 2 - Lett.
27, L280 (1988).
6
A. P. Tsai, A. Inoue, and T. Masumoto, J. Mater. Sci. Lett. 7, 805 (1988).
7
A. Inoue, M. Yamamoto, H. M. Kimura, and T. Masumoto, J. Mater. Sci. Lett. 6,
194 (1987).
8
J. Zhang, H. Tan, Y. P. Feng, and Y. Li, Scr. Mater. 53, 183 (2005).
9
H. Yang, J. Q. Wang, and Y. Li, J. Alloy. Compd. 422, 86 (2006).
10
H. Yang, J. Q. Wang, and Y. Li, Philos. Mag. 87, 4211 (2007).
Chapter 2
Literature Review
2.1 Introduction
2.1.1 Development of Bulk Metallic Glass
In 1959, the revolutionary work by Duwez et al at the California Institute of
Technology thrust metallic alloys into the limelight, by the successful rapid quenching
of an Au-Si alloy from melt in the laboratory, using a gun quenching technique, as
shown in Figure 2.1
1,2
. Since then, many binary and ternary metallic alloys have been
found to form glass by quenching.
5
Figure 2.1 Illustration of Gun Quenching Technique developed at the California
Institute of Technology for the amorphization of metallic alloys, after Ref. [2].
The discovery of easy glass formation in Pd-based ternary alloys
3
led to
another milestone in the development of MG’s, when the alloy Pd-P-Ni was reported
to form fully glass cylindrical rods with a diameter of 1 mm
4
. Subsequently, metallic
alloys capable of forming fully glass phase exceeding 1 mm in diameter were coined
‘bulk metallic glass’ (BMG’s), and is somewhat a prestigious label reserved for alloys
with excellent GFA. Despite further improvements in the critical size for glass
formation in the years to follow, since research and discoveries on these MG’s were
often based on precious metals like Au
5,6
, Pd and Pt
7-9
, the hefty cost of the raw
materials in this field thus severely limited their practical applications.
Eventually much cheaper materials with comparable GFA was discovered in
the early 1980’s, by a research center headed by Prof. Inoue in Tohoku University of
Japan, which reported easy glass formation in La-based alloys
10-12
. Empirical results
also inspired Inoue to propose the three empirical criteria for glass formation: that the
alloy should be a multi-component alloy system; that the constituent atoms should
have widely differing atomic sizes exceeding 12%, and that the heats of mixing
6
between each of the atomic pairs should be negative
13,14
. Indeed, in the following two
decades since, bulk glass formation has been discovered in many multi-component
alloy systems with significant constituent atomic size mismatch based on Mg
15-18
,
Ca
19
, Nd
20
, Pr
21
, Zr
22-25
, Ti
26
, Cu
27-30
, Ni
31
, and Fe
32
.
In recent times, ever increasing size for full glass formation has been reported,
especially in Zr-
33
, La-
34
, Mg-
35
and Fe-based
36
alloy system. Despite much effort,
the record for the largest critical size for full glass formation still stands at 72 mm in
the Pd
40
Cu
10
Ni
30
P
20
alloy system
37
. Nevertheless, with increasing understanding of
the kinetics (Section 2.1.2) and thermodynamics (Section 2.1.3) factors governing
glass formation in metallic alloys, researchers remain optimistic of further increases
in the critical size for full glass formation, that can be achieved. Figure 2.2 illustrates
this linear relationship between the critical sizes for glass formation as a function of
time.
Figure 2.2 Critical casting thickness in cm for glass formation as a function of the
year the corresponding alloy has been discovered, after Ref. [38].
7
2.1.2 Understanding Glass Formation
The glassy state in metallic alloys exhibits an amorphous structure, where
atoms are randomly arranged and lack the long range periodicity in their crystalline
counterparts. Classically, solidification of an alloy from the molten liquid state takes
place via heterogeneous nucleation (or homogeneous in the idealized state) and
subsequent growth of the nuclei. In order to form glass, both the nucleation and
subsequent growth must be effectively suppressed. If the steady state nucleation is
assumed, the per unit volume crystal nucleation rate, I
v
, is the product of a kinetic
term, which depends on atomic diffusivity (or viscosity), and a thermodynamic term,
which depends on the probability of a fluctuation to overcome the nucleation barrier,
Tk
G
T
A
I
B
v
v
exp
)(
(2.1)
where A
v
is a constant, k
B
is the Boltzmann’s constant, T is the absolute temperature,
η(T) is the viscosity of the melt and ΔG
*
the activation energy which must be
overcome for the formation of stable nuclei. From classical nucleation theory, the
activation energy can be further expressed as,
2
3
3
16
sl
G
G
(2.2)
where σ is the interfacial energy between the nuclei and the liquid phase, and the term
ΔG
l-s
is the free energy difference between the liquid state and the crystalline state.
This term is the driving force for crystallization; the lower is the driving force, the
easier it is to form glass. This would be dealt with in further detail in Section 2.1.2.1.
8