Charge transport and thermal properties of a semicrystalline polymer semiconductor
Bạn đang xem bản rút gọn của tài liệu. Xem và tải ngay bản đầy đủ của tài liệu tại đây (3.12 MB, 132 trang )
Charge Transport and Thermal Properties of
A Semicrystalline Polymer Semiconductor
Li-Hong ZHAO
In partial fulfillment of the requirements for the
Degree of Doctor of Philosophy
Department of Physics
National University of Singapore
2010
To my mother
i
Acknowledgements
The work described in this thesis was carried out in the Organic Nano Device Lab (ONDL),
National University of Singapore (NUS), and was supported by research scholarship from the
Department of Physics in NUS.
I owe my deepest gratitude to the following people, without whom this thesis would not have
been possible. First, I am heartily thankful to Dr. Peter Ho and Dr. Chua Lay-Lay, for leading
me into this field, their continuous guidance, constant support and above all their patience
throughout my PhD. I am really delighted to work with both of you.
I would like to show my gratitude to all the senior members in ONDL: Dr. Siva, Dr. Chia Perq
Jon, Dr. Zhou Mi, Dr. Wang Shuai, Dr. Wong Loke Yuen, Dr. Roland Goh, Rui Qi, Jing-Mei, Dr.
Tang Jie-Cong, Guo Han and Bibin for their assistant, fruitful discussions and encouragement.
Without them, I could not have completed this project. I also thank all the junior members in
ONDL for their encouragement and friendship. It is indeed a pleasure to spend my PhD time
with all of you.
I would like to acknowledge Dr Tang Jie-Cong for the synthesis of PBTTT, NMR, GPC, DSC
measurements and Figure 3.1; Rui Qi for the POM, solution UV-Vis measurements, Figure 2.5,
Figure 3.2 and Figure 3.3; Jing-Mei for inducing lamellae in rrP3HT, AFM measurement of
rrP3HT terraces, Figure 2.11 and Figure 2.12.
ii
iii
Abstract
Five-membered-ring heterocycle polymers such as regioregular poly(3-alkylthiophenes)
(rrP3ATs) and poly(bithiophene-alt-thienothiophene) (PBTTT) are important prototype polymer
organic semiconductors (OSCs) that show the high charge-carrier mobility important for both
field-effect transistors (FETs) and photovoltaic (PV) applications. These typically orders into
lamellae comprising π-stacked polymer chains with anti-coplanar rings spaced by the alkyl
side-chains. This polymer morphology is suited to give high charge-carrier mobility owing to
relatively fast transport in the π-stacking direction. The charge carriers are fundamentally
polarons due to strong electron–phonon coupling, but they have been found to possess a
significant inter-chain character, which is a subject of ongoing intense interest, because of the
possibility to access highly mobile states.
PBTTT has recently been reported to give unprecedented molecular terraces on the surfaces
of thin films, which suggests a more superior lamellar ordering than known in rrP3ATs. This
lamellar order persists to both the air and substrate interfaces, which makes PBTTT a
particularly useful model to investigate several aspects of polymer physics and charge-
transport physics in ordered polymer OSCs. In this thesis, thermal excitation of the polymer
and its effect on field-effect transport are studied. In particular, a novel ring-twist transition in
π-conjugated polymers is established from detailed variable-temperature spectroscopy and
quantum-mechanical calculations, together with a novel layered nematic transition. The effects
of these ring-twist transition on the properties of the field-induced polarons and their transport
density-of-states has been characterised.
iv
In chapter 1, we give a brief introduction about the fundamentals of the organic semiconductor,
properties of rrP3HT and PBTTT, followed by working mechanism of the organic field-effect
transistors (OFETs), on which the charge transport property and modulation spectroscopy
aspects in this thesis are based, and finally the short review of charge modulation spectroscopy
(CMS).
In chapter 2, we propose a model based on the intrinsic viscosity measurement, solution
ultraviolet-visible (UV-Vis) spectroscopy and atomic force microscopy to explain the origin of
the molecular terrace morphology in PBTTT films. This model invokes the central role of a
borderline poor solvent in promoting the early π-stacking of the polymer chains, and the
subsequent deposition and growth of these π-stacks into continuous films on the
substrate. The model appears to be general, as lamellae have now also been found in rrP3HT
in this work. This explains the origin of the high degree of order present in PBTTT, which puts
the correlation of morphology and transport physics on a firm basis.
In chapter 3, we investigated the dependence of paracrystal to liquid crystal transition and
liquid crystal to isotropic phase transition in the temperature from 298 K to 500 K on molecular
weight. A set of nematic phase transition (T
k
‘ and T
k
”) and isotropic melting (T
i
) is observed in
wide-angle X-ray scattering and variable temperature polarised optical microscopy
measurements. The nematic phase transition and isotropic melting temperatures increase with
increasing chain length and saturate for polymer chain length n
o
> 10.
In chapter 4, we investigate the 320-K transition by variable temperature Fourier transform
infrared (FTIR), Raman and UV-Vis spectroscopies. This transition is established to be a
second-order cooperative ring-twist transition; denoted T
r
. Quantum chemical calculations
v
quantitatively determined the ring-twist angles above T
r
transition. Above T
r
, the mean
dihedral angles of the temperature-dependent vibrational and electronic spectra progressively
increase from ≈ 0º to ≈ 25º just below the paracrystal to nematic phase transition (T
k
), while
keeping a long-range correlation that preserves a long polymer persistence length.
In chapter 5, we studied the effects of this mild T
r
ring-twist transition on the interchain polaron
and transport density-of-state. We demonstrate that the ring-twist transition existing in the bulk
of PBTTT film has an impact on the polaron at the semiconductor/insulator interfaces. Although
disorder tends to cause polaron localisation, mild ring twist in well-ordered π-stacked chains, in
contrast, promotes interchain delocalisation by suppressing the electron-phonon coupling and
thus favour the formation of the most delocalized interchain polarons. As a result of this
thermally-induced ring twist, the transport density-of-states broaden near its centre but not in
the tail where the polarons reside, and so the field-effect transistor characteristics become non-
dispersive and well-behaved.
vi
vii
Table of Content
Acknowledgements i
Abstract iii
Table of Figures x
Chapter 1. Introduction 1
1.1 Organic semiconductor 1
1.2 Organic field-effect transistor (OFET) devices 3
1.3 High mobility π-conjugated polymer: polythiophene family 6
1.3.1 Poly(3-hexylthiophene) 7
1.3.2 Liquid-crystalline semiconducting polymer: Poly(bithiophene–alt-
thienothiophene) (PBTTT) 13
1.4 Charge modulation spectroscopy 17
1.5 References 18
Chapter 2. The origin of the monolayer-terraced morphology in PBTTT films 23
2.1 Introduction 24
2.2 Experimental methods 25
2.2.1 Synthesis of PBTTT polymers 25
2.2.2 Intrinsic viscosity measurement 26
2.2.3 Solution UV-vis-NIR absorption spectroscopy. 26
2.3 Results and discussions 27
2.3.1 Determination of the true polymer chain length by NMR 27
2.3.2 Determination of chain conformational properties in dilute chlorobenzene 31
2.3.3 Coil→rod transition of PBTTT onset in the highly-dilute regime 35
2.3.4 Mechanism for formation of the extended-chain monolayer lamellae. 41
2.3.5 Generality of mechanism: monolayer-terraced morphology in rrP3HT films 48
2.4 Summary 50
2.5 References 51
viii
Chapter 3. The nature of the liquid crystalline and isotropic transitions in PBTTT
and their dependence on molecular weight 53
3.1 Introduction 54
3.2 Experimental methods 55
3.2.1 Differential scanning calorimetry (DSC) 55
3.2.2 Variable temperature polarised optical microscopy (POM) 55
3.2.3 Wide-angle X-ray scattering (WAXS). 56
3.3 Results and discussions 57
3.3.1 Indication of a rich thermal transition behavior by DSC 57
3.3.2 Confirmation of the location of the T
i
transition by variable temperature POM 59
3.3.3 Resolving the T
k
’ and T
k
’’ transitions by WAXS 62
3.3.4 Phase diagram: dependence of T
k
and T
i
on chain length 70
3.4 Summary 72
3.5 References 73
Chapter 4. Evidence for the T
r
ring-twist transition in PBTTT 76
4.1 Introduction 77
4.2 Experimental methods 77
4.2.1 General PBTTT film preparation 77
4.2.2 Variable temperature spectroscopies 78
4.2.3 Quantum chemical calculations 79
4.3 Results and discussions 80
4.3.1 Evidences for a well-defined 320K transition in variable temperature
spectroscopies 80
4.3.2 Quantitative determination of dihedral ring-twist angle by quantum chemical
calculations 86
4.4 Summary 90
4.5 References 91
Chapter 5. Effects of the T
r
ring-twist transition on polaron and the transport
density-of-states 93
5.1 Introduction 94
5.2 Experimental methods 94
ix
5.2.1 Field-effect transistor (FET) characteristics 94
5.2.2 Charge modulation spectroscopy (CMS) in near-infrared-visible regime 95
5.2.3 Charge modulation spectroscopy (CMS) in IR regime using Fourier-transform
(FT) technique 96
5.3 Results and discussions 97
5.3.1 T
r
ring-twist transition enhances interchain polaron delocalisation 97
5.3.2 Temperature and charge carrier density dependence of µ
FET
101
5.3.3 Effect of ring-twist transition of density-of-state (DOS) 104
5.4 Summary 106
5.5 References 107
Chapter 6. Outlook 109
Appendix 110
A. Publications arising from this work 110
B. Publications (up till 2010) from work not described in this thesis 111
C. Conference presentations (presenting author underlined) 113
x
Table of Figures
Figure 1.1 Parallel π-orbitals and π-bond 2
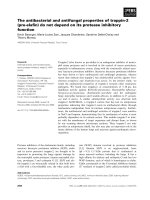
Figure 1.2 Schematics of neutral polymer π-conjugated backbone and polaron structure 3
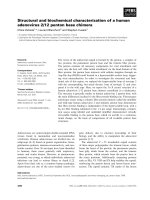
Figure 1.3 Structure and one-electron energy level diagram of radical cations and dications 3
Figure 1.4 Four possible FET device configurations 4
Figure 1.5 Field-effect transistor characteristics: bottom-gate, bottom-contact device using rrP3HT as
semiconductor layer. 5
Figure 1.6 Chemical structure of rrP3HT 7
Figure 1.7 (a) TEM of rrP3HT whiskers grown from cyclohexanone solution; (b) corresponding electron
diffraction pattern.
33
10
Figure 1.8 Schematic representation of the molecular arrangement within rrP3HT whiskers
33
11
Figure 1.9 AFM images and models for chain-packing in rrP3HT films. (a) Low-MW rrP3HT and (b)
high-MW rrP3HT.
10
12
Figure 1.10 Chemical structure of PBTTT 14
Figure 1.11 Schematic of molecular packing of PBTTT. Lamellar stacking due to the alkyl side chains
occurs along the a-axis, and π-stacking occurs along the b-axis. The positions of the
molecules in the cell are qualitative and are not meant to quantitatively describe the details
of the molecular packing, e.g., the extent of interdigitation of thesidechains.
44
However, the
work in this thesis will demonstrate that no side-chain interdigitation exist. In fact the side-
chains are significantly disordered at room temperature. 15
Figure 1.12 AFM images of 20-nm-thick PBTTT film on OTS treated SiO2 substrate. (a) As-spin-cast
chlorobenzene film. After anneling (b) chlorobenzene film.
47
16
Figure 2.1 Chemical structure of poly(2,5-bis(3-tetradecylthiophen-2-yl)thieno[3,2-b]thiophene (PBTTT),
a, b and c denote proton contribution from the biothiophene central unit, from the thiophene
central unit and thiophene end unit. 28
xi
Figure 2.2 End-group analysis by
1
H NMR of P3 (in CDCl3, 22ºC) , P5 (in CDCl3, 22ºC) and P11 (in
CDCl3, 50ºC). 29
Figure 2.3 Gel permeation chromatography of PBTTT in hot toluene. Polystyrene standards MW
marked on the plot to determine MW of PBTTT. All PBTTTs are narrowly dispersed. 32
Figure 2.4 Intrinsic viscosity plots against number weight-average. The experiment data fits the Mark-
Houwink equation nicely. MarkHouwink slope of 043 ± 0.06 and K of 0.85 ± 0.1 mLg
-1
were extracted 33
Figure 2.5 UV- visible absorption spectra of PBTTT solutions. (a) P3, P6, P11, P22 of volume fraction
1x10
-5
in the “infinite” dilution regime
.
Progressive increase in the population of red-shift
states (α,β and γ). (b) P22 of volume fraction 1x10
-5
taken from 20ºC to 50ºC with 5ºC step
increment (c) P3 taken at various volume fraction from 1x10
-5
to 9x10
-2
at 22ºC (d) P15
taken at various volume fraction from 1x10
-5
to 9x10
-2
at 22ºC 37
Figure 2.6 (a) Volume fraction of polymer (Φ) as a function of n
o
showing fraction of chains in the
random conformation(ξ) of 0.5, 0.7 and 0.9. ξ is obtained from quantitative modeling of
each UV-vis solution-state spectrum S(E) at different concentrations into S(E) = S
coil
(E) +
S
agg
(E) where S
coil
(E) is the infinite dilution for each n
o.
For typical solution concentration of
10−20 mg/mL, nearly half of the chains exist in π-stack clusters. (b) Dependence of ξ on
volume fraction of polymer Φ. Solid triangle (▲) and square (■) are experiment data and
solid line are fitted by solving applying mass balance equation together with stepwise
association equilibrium model. K=280Lmol
-1
fit P15 and K=18Lmol
-1
fit P3 relatively well. . 39
Figure 2.7 3 x 3 μm atomic force microscopy (AFM) of 30-nm-thick PBTTT film on HMDS-treated silicon
oxide substrate spin-coated from 10 mg/ml PBTTT in chlorobenzene after cooled down
from 85°C for 30min. (top) P3, P6, P11, P22 pristine films. (bottom) after annealed into
individual liquid crystalline phase for 10 min and quenched cool. (Inset) zoom-in of 500nm x
500nm areas. 42
Figure 2.8 Histogram of the width of the ribbons in PBTTT films. About 50 data points are taken for
each set. (a) P22 has typical width mostly between 50-125 nm. (b) P11 between 75-125
xii
nm. (c) P6 has broader width range from 50-250 nm, contributed by the coalescen of
underlying ribbons (d) P3 has narrow-dispersed width between 25-75 nm. 43
Figure 2.9 Histogram of the thickness of the ribbons in PBTTT films. About 50 data points are taken for
each set. (a) P6, P11 and P22 have typically molecular thickness of 2.2 nm. (b) P3
showing molecular thickness of 2.2 nm and multiples stacks. 44
Figure 2.10 The formation of extended-chain π-stacked 2-D lamellae onto the substrate. (a) in diluted
solution, the majority of the polymer chains extend while some inter-stack interaction starts
to take place. (b) 2-D π-stacked aggregates grow as concentration gets higher. (c) These
aggregates are deposite onto the substrates with π-stacking dierection parallel to the film
plane. (d) after annealing above LCP to nematic phase and cooling down to room
temperature, big lamellae with neighboring registration are formed. 47
Figure 2.111x1 μm AFM images of rrP3HT films. (a) pristine rrP3HT film spin-coated from
chlorobenzene:mesitylene (1:9) showing whisker ribbons, when annealed into LCP for 10
min and cool-down from hot plate to 50ºC at 10 ºC /min (b) shows molecular terrace. Z-
scale is 10 nm. 49
Figure 2.12 Histogram of the thickness of the rrP3HT whisker. About 50 data points are collected.
Molecular thickness of 1.6 nm and also multiples molecular stacks are observed. 50
Figure 3.1 DSC thermograms of PBTTT films recrystallized by annealing to 150ºC (10 min) followed by
slow cooling in the Al pans. (a) P22 (b) P11 (c) P6 (d) P3. First heating/ cooling cycle
(dotted red lines); second cycle (blue solid lines) under nitrogen at a heating rate of 10 °C
/min. Direction of scan is indicated. Ring-twist transition Tr, melting transition to liquid-
crystal Tk (comprising a pair of transitions for the lower-MW materials) and melting
transition to isotropic phase Ti are marked on the plot. The nature and location of Tk and Ti
transitions are separately determined by POM and variable-temperature XRD. 58
Figure 3.2 Variable temperature polarizing optical microscopy of P11 film. Images are taken at every
10K after equilibrated at each temperature for 1min but only select images are shown. The
intensity diminishes at about 240ºC indicating isotropic melting point has reached. 60
xiii
Figure 3.3 Temperature dependence of the intensity of the optical POM images for all PBTTT films.
Isotropic melting point is taken from near diminishing intensity of the images. P22 is at
525K, P11 at 505K, P6 at 470K and P3 at 415K. 61
Figure 3.4 XRD patterns of 100-µm-thick PBTTT films recrystallized by annealing to 160ºC (15 min)
followed by slow cooling. (a) P22, (b) P11, (c) P6 and (d) P3. Intensities are unnormalized,
for offset for clarity. 63
Figure 3.5 d-spacings of (100), (200) and (010) as a function of temperature. (010) spacing of rrP3HT
of 3.76Å is also shown. 64
Figure 3.6 Dependence of crystallinity on temperature. 69
Figure 3.7 Phase diagram showing the dependence of T
r
, T
k
, T
k
’ and T
i
transition with n
0
. The useful
liquid crystalline gap between T
k
and T
i
opens up significantly with n
0
. T
r
shows slow
increase with n
0
71
Figure 4.1 The second-order nature of the 320-K transition in well-ordered PBTTT films (pre-annealed
on hotplate 150ºC; 10 min; N
2
). (a) First-cycle differential scanning calorimetry in Al pans
measured in flowing N
2
. Inset: Chemical structure of PBTTT. (b) UV-visible transmittance
spectra on fused silica substrates measured in vacuum. (c) Plots of mean π–π* transition
energy and its temperature dependence against temperature. Lines are guides to the eye.
82
Figure 4.2 Temperature-dependent FTIR and Raman spectra reveal separate onset temperatures for
side-chain disordering (220 K) and ring-twisting (320 K) in well-ordered PBTTT films. (a)
Temperature dependence of the FTIR phonon modes: alkyl CH
2
rock (CH
2
ρ), bithiophene
(T
2
) and thienothiophene (TT) CH out-of-plane bend (CH δ
oop
), alkyl CH
2
bend (CH
2
δ), CH
2
symmetric (ν
s
) and asymmetric (ν
as
) stretch and aromatic CH stretch (CH ν). Scale bar
corresponds to 0.05 absorbance units. (b) Plot of mean phonon wavenumber against
temperature for selected phonon modes. Lines are guides to the eye. (c) Temperature
xiv
dependence of the Raman C=C–C backbone stretching phonon modes ν
1
–ν
4
. Inset: Plot
of ν4 against temperature. 85
Figure 4.3 Variable temperature-AFM images of pBTTT film from room temperature up to 423K 86
Figure 4.4 Computed spectral properties parametric in thiophene–thiophene dihedral angle (θ) and
thienothiophene−thiophene dihedral angle (φ) to extract their temperature dependence
from experimental results. Computed phonon mode frequency surface for: (a) T
2
CH
oop
,
(b) TT CH
oop
, (c) C=C–C ν
1
, and (d) C=C–C ν
4
. (e) Computed mean π–π* electronic
transition energy surface. (f) Schematic diagram of the conformer model used in the
quantum chemical calculations. The computed phonon mode frequencies and electronic
transition energy were scaled by standard corrections. The blue dots give the best (θ, φ)
coordinates that account for the experimental excess mode shift at various temperatures. A
self-consistent temperature trajectory was obtained in this way to fit all the phonon mode
data. This trajectory also describes excellently the π–π* transition energy data. 88
Figure 5.1 Schematic diagram of top-gate FET configuration 95
Figure 5.2 Schemetic diagram of the experimental set-up of optical CMS 96
Figure 5.3 Schematic diagram interferogram-modulated FT chargemodulation spectroscopy 97
Figure 5.4 Reflection charge-modulation spectroscopy (CMS) of PBTTT FETs. (a) In-phase CMS of
the C3 band region at different temperatures. (b) In-phase (red) and quadrature (orange)
IR–NIR–optical CMS spectra at 200 K and 373 K. Dotted lines give the absorbance
spectra. Gate-bias modulation frequency (1 kHz IR, 170 Hz NIR–optical) was well within
FET bandwidth. (c) Computed polaron relaxation loss with ring dihedral angle in an
oligothiophenes to illustrate the strong electron–phonon coupling. 99
Figure 5.5 Analysis of the temperature- and carrier-density-dependence of the linear-regime hole field-
effect mobility using the Coehoorn general hopping model: field-effect mobility against
inverse temperature at different hole densities. Symbols are data; lines give model
predictions. Inset: Zoom-in of the high temperature data revealing a transition at 320 K. 102
xv
Figure 5.6 Analysis of the temperature- and carrier-density-dependence of the linear-regime hole field-
effect mobility using the Coehoorn general hopping model. Plots of the same data explicitly
against hole densities. Inset: Plots of source–drain currents against gate bias for different
temperatures showing a transition from dispersive (i.e., trapping) to non-dispersive
behaviour at high temperatures. 103
Figure 5.7 Fermi energy against temperature for different hole densities, extracted from model. Inset:
schematic illustration of how the density-of-states varies from low to high temperatures
showing a soft pinning of the DOS tail despite thermal broadening of the centre states. 105
1
Chapter 1. Introduction
1.1 Organic semiconductor
The scientific research and technological applications of organic electronics have witnessed
phenomenal growth in the last two decades. Traditionally, plastics are known to be electrically
insulating and are thus commonly used as insulator in industry. In year 2000, Alan J. Heeger,
together with Alan G. MacDiarmid and Hideki.S won the Nobel Prize in Chemistry for their
discovery and development of conducting polymers.
1
A group of organic semiconductor (OSC)
materials, comprising of small molecules and π-conjugated polymers, is found to show the
semiconducting electrical characteristics. Organic light-emitting diodes made of small
molecules, by using double-layer structure consist of an aromatic diamine layer and 8-
hydroxyquinoline aluminum (Alq
3
) layer, and π-conjugated polymer, with poly( p-phenylene
vinylene) (PPV) serving as active layer, have been developed in 1987 by Tang et al.
2
and the
Cavendish laboratory
3
respectively. Initial demonstration of organic field-effect transistors
(FETs) with α-conjugated oligothiophenes has been initially demonstrated by Horowitz et al.,
4
while FETs made of π-conjugated polymers, e. g. polythiophene or polyacetylene, have also
been reported in 1980s by various groups.
5
6
The reason for the semiconducting electrical characteristics of this special group of
molecules/polymers lies in their alternating single and double carbon-carbon bonds present
along their backbone. The electronic structure of π-conjugated polymers results in a general
delocalisation of the π-electrons across all of the adjacent parallel-aligned π-orbitals (Figure
1.1) of the atoms, and the delocalised π-electron bonding along the main chain.
2
Figure 1.1 Parallel π-orbitals and π-bond
The energies of π-bonds and its anti-bonding π * are located between the σ and σ* bond. The
energy difference between the π-π* bonds is defined as the energy gap of the polymers, which
can be large for an insulator, but usually much smaller for a polymer that has π-conjugation.
Therefore, it is possible to inject electrons and holes or excited photoexcited electron-hole pairs
in these materials without causing a destruction of the polymer chain.
The introduction of charge carriers onto an isolated conjugated molecule is accompanied by a
polaronic structural and electronic relaxation of the π-conjugated backbone. Figure 1.2 shows
the bond alternation from benzenoid to quinoid form occuring when charges are located on the
backbone. Singly charged carriers are referred to as polarons (or radical cations in the case of
short oligomers) whereas doubly charged carriers are called bipolarons (dications), as shown
in Figure 1.3. This relaxation results in the appearance of new optical transitions in the
absorption spectrum at energies lower than the main π-π* transition. Note that transitions C3,
C4, and DC2 are usually disallowed due to symmetry considerations in isolated chains.
3
Figure 1.2 Schematics of neutral polymer π-conjugated backbone and polaron structure
LUMO
HOMO
Eg
π-π*
Neutral chain
C4
C1
C2
C3
Radical Cation
DC2
DC1
Dication
LUMO
HOMO
Eg
π-π*
Neutral chain
C4
C1
C2
C3
Radical Cation
C4
C1
C2
C3
Radical Cation
DC2
DC1
Dication
DC2
DC1
Dication
Figure 1.3 Structure and one-electron energy level diagram of radical cations and dications
1.2 Organic field-effect transistor (OFET) devices
Organic field-effect transistors (OFETs) are three-terminal devices comprising of a gate
electrode, source electrode and drain electrode. The semiconductor is deposited to bridge the
source and drain electrodes, and is itself spaced from the gate contact by an insulating gate
dielectric layer. A source-drain voltage (V
ds
) is applied across the drain-source electrodes while
a gate voltage (V
gs
) across the gate-source electrodes. This gate voltage provides an electrical
field that leads to the accumulation of charge carriers at the semiconductor-dielectric interface.
This in turn modulates the source-drain conductance for a given source-drain voltage (V
ds
).
4
Dielectric
Semiconductor
Gate electrode
Electrodes
glass
Bottom-gate, Bottom-contact
Semiconductor
Electrodes
Gate electrode
Dielectric
Semiconductor
Electrodes
Gate electrode
Dielectric
Bottom-gate, Top-contact
Top-gate, Bottom-contact
Semiconductor
Gate electrode
Electrodes
glass
Top-gate, Top-contact
Dielectric
Figure 1.4 Four possible FET device configurations
There are four possible FET device configurations: bottom-gate, bottom-contact; bottom-gate,
top-contact; top-gate, bottom-contact and top-gate, top-contact. (Figure 1.4) Two kinds of
configurations have been used in this thesis, which are bottom-gate, bottom contact and top-
gate, bottom-contact. In the bottom-gate bottom-contact configuration, Au source drain
electrodes are photolithographically patterned on p
++
-Si substrates with 200 nm of thermally
grown SiO
2
as dielectric separating the Si gate and the active semiconductor layer. This
configuration is commonly used to fabricate diagnostic OFETs to measure carrier mobility. In
this configuration electrons/holes are injected directly into the semiconductor/dielectric interface
by source-gate voltage V
gs
and subsequently driven by the V
sd
. In the top-gate bottom-contact
configuration, the source/drain electrodes are also predefined by photolithography on glass or
plastic substrate before the semiconductor is deposit. The top-gate electrode is fabricated by
thermal evaporated metal. The typical field-effect characteristics, transfer characteristic (left)
and output characteristic (right) are shown below (Figure 1.5).
5
0
300
600
900
1200
1500
-80-60-40-200
I
sd
(uA)
V
G
(V)
V
D
=
-25V
-20V
-15V
-10V
-5V
0V
-30V
0
100
200
300
400
500
600
700
-80-60-40-200
I
sd
(uA)
V
D
(V)
Vg=
-30V
-20V
-10V
0V
-40V
Figure 1.5 Field-effect transistor characteristics: bottom-gate, bottom-contact device using rrP3HT as
semiconductor layer.
Field effect mobility can be extracted from OFET in the linear and saturation regime. In the
linear regime when a small V
ds
is applied across source-drain electrodes, the charges flowing
from source to drain, the current flowing through the channel is directly proportional to V
ds
. In
this case the source-drain current I
ds
can be described by :
,
()
i lin gs gs th ds
ds
WC V V V
I
L
µ
−
=
Where L is the channel length, W is the channel width, C
i
is the capacitance per unit area of
the insulator, V
gs,th
is the threshold voltage, and μ
lin
is the liner field-effect mobility, which can
be calculated by plotting I
ds
versus V
gs
at a constant V
ds
, when
,ds gs gs th
V VV<−
. The V
gs,th
6
depends on the charge carrier trapping at the interfaces and the nature of the
semiconductor/dielectric interface.
When
,
-
ds gs gs th
V VV>
, source-drain current begins to saturate due to the pinch-off of the
accumulation layer near the drain electrode and can be given by:
2
,
()
2
i sat gs gs th
ds
WC V V
I
L
µ
−
=
where μ
sat
can be calculated by plotting
ds
I
versus V
gs
. The saturation mobility is usually
higher than the liner mobility, which is speculated to be artifact due to contact resistance.
1.3 High mobility π-conjugated polymer: polythiophene family
π-conjugated polymers with highly extended π-conjugation in their conjugated backbone have
attracted considerable attention from both fundamental and practical points of view. Thiophene-
contaning polymers, among π-conjugated polymer family, have exhibited amongst the highest
charge carrier mobility from OFETs. In these materials, thiophene rings are coupled together
on their 2
nd
and 5
th
positions. Alkyl side-chains on the thiophene rings promote solubility in
organic solvents. These polymers thus can form uniform films through solution processable
methods, such as spin-casting, drop-casting and inject printing. The thiophene rings are
conjugated together in a co-planar conformation to provide a delocalised electronic system,
and a molecular configuration to achieve highly crystalline thin films. The first semicrystalline
polythiophene polymer to give high charge-carrier mobility up to 0.1 cm
2
V
-1
s
-1
is regioregular
poly(3-hexylthiophene) (rrP3HT),
7
fundamental properties of which have been extensively
studied since 1980s.