Growth and characterization of germanium and silicon nanostructures
Bạn đang xem bản rút gọn của tài liệu. Xem và tải ngay bản đầy đủ của tài liệu tại đây (10.18 MB, 185 trang )
Growth and Characterization of
Germanium and Silicon Nanostructures
Huang Jinquan
A Thesis Submitted for the Degree of
Doctor of Philosophy
Department of Electrical and Computer Engineering
National University of Singapore
2010
i
Abstract
In this dissertation, the growth and characterization of five different types of
germanium (Ge) and silicon (Si) nanostructures are presented. The nanostructures
include one-dimensional Ge nanowires (GeNWs), GeSi oxide nanotubes (GeSiO
x
NTs),
heterostructures of GeNW-GeSiO
x
NT, Si nanowires (SiNWs) and near zero-
dimensional Ge nanodots (GeNDs). The first three were obtained using bottom-up
approaches where the materials were self-assembled together with the aid of metal
catalysts. The formation of the SiNWs, on the other hand, was b y a top-down process
making use of metal nanodots formed using an anodized aluminium oxide (AAO)
template. AAO was also utilized as a thermal evaporation mask for the deposition of
the regular arrays of GeNDs.
The formation mechanism of each type of nanostructure was investigated in detail.
GeNWs were obtained via the vapour-liquid-solid growth catalyzed by active gold (Au)
droplets. On the other hand, the formation of the GeSiO
x
NTs required passivation of
the Au catalyst so that growth was limited to the rims of the Au dots. Consequently,
the GeNW-GeSiO
x
NT heterostructure was a result of timely control of the Au
passivation such that formations of hollow tubes and solid wires took place at different
time. For the top-down fabrication of SiNWs, uniform and well-aligned SiNWs were
produced by chemical wet etching using AAO-templated chromium/gold nanodots as a
hard mask blocking material. This dissertation also explored some unique properties of
the as-synthesized nanostructures. In particular, thermal conductance measurements
have shown that the wire-tube heterostructure demonstrated a thermal rectification as
high as 6%. The different charge-trapping characteristics of the GeNDs were also
studied using the scanning capacitance microscopy technique.
ii
Acknowledgements
First and foremost, I am particularly grateful to my thesis supervisors: Wai Kin for
his support and guidance, especially his enigmatic encouragement in looking out for
serendipity which indeed miraculously happened; Shijie for allowing me extreme
freedom in pursuing any area of my interest in my Ph.D. studies. I am also extremely
fortunate to have worked with Sing Yang, my “master” in all areas including the
correct approach to research, the intelligent tricks, e.g. how to be at least not-wrong
when I cannot prove I am right, in manuscript preparation, the happy hours in Wala-
Wala, my first Kilkenny beer (and the countless ones after), etc.
Special thanks also go out to: Nancy for the numerous TEM sessions she
performed for me and I sincerely wish that her eyesight did not suffer as a result; Prof.
John Thong for his gracious accommodation in CICFAR, and Mrs. Ho and Chee
Keong for their help in preventing a logistical nightmare. Their hearts must still be
fluttering with fear after my two unintentional, and fortunately unsuccessful, attempts
to “destroy” the lab using fire and flood. Meng Lei and Chee Leong for the regular tea
sessions during my thesis writing days though they seldom helped to wash the tea sets.
Rongguo and Cong-Tinh for the thermal rectification measurements. Folks like Anna,
Pi Can, Ren Yi, Wang Rui, Huijuan, Ziqian, Alfred, Heng Wah, Shi Fa, Jason and
many others for their wonderful company; some must have profited a lot over the bets
and the mahjong games that I lost during my stay in CICFAR.
Lastly, I am eternally grateful to my family. My sisters and my brother for taking
care of my mum, who has always treated me with unconditional love and care. My dad,
who now must have been blessing me in the other world. His strict home teachings had
trained me well and helped me tide over the difficult time in my Ph.D. studies.
iii
Table of Contents
Table of Contents
Abstract i
Acknowledgements ii
Table of Contents iii
List of Figures vii
List of Tables xiii
Chapter 1 Introduction and Motivation 1
1.1 Nanotechnology 1
1.2 Semiconductor Nanostructures 1
1.3 Challenges and Opportunities in Syntheses of Si and Ge Nanostructures 4
1.4 Organization of Thesis 5
Chapter 2 Literature Review 7
2.1 VLS Growth of Si and Ge Nanowires 7
2.1.1 VLS Mechanism and Its Variants 7
2.1.2 Factors affecting VLS Growth 12
2.2 SiNWs through Catalytic Etching 22
2.2.1 One-step Etching in Ionic Metal HF Solutions 23
2.2.2 Etching in HF/H
2
O
2
with Patterned Metal Catalyst 29
2.3 VLS and Catalytic Etching as Complementary Methods 30
2.3.1 Material Types 30
2.3.2 Axial Orientation 31
iv
Table of Contents
2.3.3 Nanowire Morphology 34
Summary 36
Chapter 3 Theory 37
3.1 Anodic Aluminium Oxide 37
3.1.1 Anodization Process 38
3.1.2 Mechanism for Formation of Regular Hexagonal Pore Arrays 39
3.1.3 Anodization of Al with Pre-textured Surface 44
3.1.4 Ultra-Thin AAO as an Evaporation Mask 47
3.2 Scanning Capacitance Microscopy (SCM) 49
3.2.1 SCM Operation Principle 50
3.2.2 SCM Operation Modes 56
Summary 62
Chapter 4 GeNWs and GeSiO
x
NTs 63
4.1 Introduction 63
4.2 Experiment and Results 64
4.2.1 Sample preparation 64
4.2.2 GeNWs 66
4.2.3 GeSiO
x
NTs 69
4.3 Growth Mechanism 76
Summary 82
Chapter 5 Heterostructures of GeNW and GeSiO
x
NT 83
5.1 Introduction 83
5.2 Experimental Details 85
v
Table of Contents
5.3 Results and Analysis 86
5.3.1 Structural Characterization 86
5.3.2 Chemical Composition 90
5.4 Growth Mechanism 93
5.5 Application in Thermal Rectification 98
Summary 104
Chapter 6 Well-aligned and Uniform SiNWs by Catalytic Etching 105
6.1 Introduction 105
6.2 Experimental Setup and Procedures 108
6.2.1 Control Experiment 108
6.2.2 Fabrication Procedure 110
6.3 Results and Discussion 112
6.3.1 General Morphology 112
6.3.2 Crystallinity 116
6.3.3 Precise Diameter Control 117
6.3.4 Other Masking Metals 121
Summary 127
Chapter 7 GeNDs and Their Charge Trapping Characteristics 129
7.1 Introduction 129
7.2 GeND Fabrication 130
7.3 Results and Discussion 131
7.3.1 Surface Morphology of GeNDs 131
7.3.2 SCM Characterization 133
7.3.3 Group II GeNDs 142
vi
Table of Contents
Summary 144
Chapter 8 Conclusion 145
8.1 Summary of Findings and Conclusion 145
8.2 Future Works 148
References 149
Appendix A: List of Publications 170
A1. Thesis-related Publications 170
A2. Other Publications 170
vii
List of Figures
List of Figures
Figure 1-1. Intel central processing unit (CPU) transistor count trend. 2
Figure 2-1. (a) Au-Si binary phase diagram showing the compositional and phase
evolution during the nanowire VLS growth process. (b) Schematic depiction of the
nanowire VLS growth. 9
Figure 2-2. Plot of the optimum growth temperature as a function of the diameter of
the gold particle seeds for CVD growth of GeNWs. 16
Figure 2-3. Variation in the shapes of GeNWs at different temperatures. 20
Figure 2-4. Variation in the diameter and the aspect ratio of the GeNWs as (a) a
function of pressure of GeH
4
at 290 °C, and (b) a function of the growth temperature at
40 Torr of GeH
4
. 21
Figure 2-5. (a) Scanning electron microscopy (SEM) micrographs of large-area SiNWs
obtained in this project by catalytic etching in HF/AgNO
3
. (b) SEM image of the
SiNWs at a higher magnification. 24
Figure 2-6. Schematic depiction of the formation of vertically aligned SiNWs on a Si
surface in ionic AgNO
3
/HF solution. 27
Figure 2-7. HRTEM images of (a) an alloy-wire interface of a SiNW with a <111>
growth axis, (b) an alloy-wire interface of SiNW with a <110> growth axis, (c)
HRTEM cross-sectional image, and (d) the equilibrium shape for the wire cross
sections predicted by Wulff construction. 32
Figure 2-8. SEM micrographs of regular arrays of (a) Si nanowires of oval cross-
sections, (b) Si nanofins and (c) cylindrical nanowires obtained through laser
interference lithography with different conditions combined with catalytic etching. 35
Figure 3-1. Scanning electron microscopy (SEM) micrographs taken at (a) a 0
o
-tilt
view and (b) a 45
o
-tilt view of an AAO template (with barrier layer removed) used in
this project. (c) SEM images of regular metal nanodots and (d) carbon nanotubes
synthesized through the use of AAO templates. 38
Figure 3-2. Simplified schematic of an electrolytic cell for aluminium anodization. 39
Figure 3-3. Schematic diagrams for the electric-field strength distribution in some
typical oxide barrier layers with the electrolyte-oxide interface marked by A, B, C and
the oxide-metal interface marked by A’, B’, C’. 41
viii
List of Figures
Figure 3-4. (a) Two neighbouring pores having a separation larger than 2d
E
. (b) The
pores move towards each other to achieve a wall thickness of 2d
E
. (c) The pores move
closer with 2d
W
< 2d
E
(not drawn to scale) and a balanced curvature of 2θ < 180
o
. (d)
Two neighbouring pores that are too close to each other and (e) their self-adjustment to
increase the wall thickness. 42
Figure 3-5. SEM micrographs of (a) a barrier layer with hexagonally packed structure,
viewed at a 0
o
-tilt, and (b) an oblique angle view of the cross-section of a typical AAO
used in this project. 43
Figure 3-6. SEM micrographs of AAO templates obtained from different acid
electrolytes. 44
Figure 3-7. Schematic depiction of formation of self-ordered porous AAO through a
two-step anodization. 46
Figure 3-8. Effect of surface pretexturing on anodization. 47
Figure 3-9. SEM micrographs of ordered AAOs with inter-pore distances of (a) 100
nm, (b) 150 nm, and (c) 200 nm. 47
Figure 3-10. Procedures of formation of metal dot arrays by evaporation through an
AAO template. 48
Figure 3-11. (a) Typical setup for atomic force microscopy (AFM). (b) Force-distance
diagram showing the different regimes of tip deflection. 51
Figure 3-12. Basic SCM detection system. 53
Figure 3-13. The capacitance measured by the SCM sensor varies as the carriers move
towards and away from the conductive cantilever tip. 54
Figure 3-14. (a) High-frequency CV curves for a heavily and a lowly doped n-type
semiconductor. The CV curves in (b) shows the δC/δV for both n- and p-type materials
55
Figure 3-15. (a) 2D Topography image by AFM of the SRAM test sample used in this
project, and (b) its reconstruction in 3D. 56
Figure 3-16. SCM contrast images of the SRAM sample taken in (a) amplitude mode,
and (b) hybrid-data mode with a 90
o
lock-in phase. 58
Figure 3-17. Section analysis along the white line indicated in Figure 3-16(b). 58
Figure 3-18. High frequency CV curves and the corresponding differential capacitance
δC/δV dependence on the dc bias for (a) n-type, and (b) p-type semiconductors. 60
ix
List of Figures
Figure 3-19. Effect of different charges on (a) the high frequency CV curve, and (b)
the δC/δV curve. 61
Figure 4-1. Block diagram of a thermal evaporation system. 65
Figure 4-2. (a) SEM micrograph of individual Au-dots obtained by annealing a 2 nm
Au film. (b) Size distribution of 100 typical Au-dots randomly selected across the
sample. 66
Figure 4-3. (a) Setup, and (b) temperature setting for GeNW growth. 67
Figure 4-4. (a) and (b) SEM images showing GeNWs with smooth surface morphology.
(c) TEM image of several Ge nanowires, which have a uniform diameter of about 80
nm.(d) High resolution TEM (HRTEM) image of a single Ge nanowire showing the
<111> growth direction and its SAED image (inset) 69
Figure 4-5. Block diagram of the experimental setup for the growth of GeSiO
x
NTs. . 70
Figure 4-6. (a) SEM image of the as-synthesized GeSiO
x
NTs. (b) Close examination of
the nanotubes reveals that each nanotube is a long, tubular structure with uniform
diameter. (c) and (d) SEM images showing the open-ended GeSiO
x
NTs and the wavy
surface of the walls of the tubular structure. 71
Figure 4-7. (a) TEM image of a single GeSiO
x
NT and (b) its HRTEM image. 72
Figure 4-8. (a) Ge3d core level XPS spectra and (b) Si2p XPS spectra of GeSiO
x
NTs.
74
Figure 4-9. STEM-EDX mapping of (b) Ge, (c) O and (d) Si of a typical GeSiO
x
NT in
(a). 74
Figure 4-10. TEM spot EDX spectrum of a typical GeSiO
x
NT. 75
Figure 4-11. (a) to (c): TEM images of a single GeSiO
x
NT showing gradual shape
transformation under electron beam bombardment in the TEM. (d) TEM images of a
GeSiO
x
NT of 80 nm in diameter collapsing into (e) a solid nanowire of 50 nm in
diameter. 76
Figure 4-12. Schematic depiction of the growth mechanism of the GeSiO
x
NTs. 80
Figure 4-13. (a) SEM image showing the Au dots on the surface of a growth sample
with nanotubes removed. (b) SEM-EDX on the Au dots in (a) reveals little Ge
incorporation into the Au catalyst dots. 81
Figure 5-1. Temperature profiles of Ge and GeI
4
sources and Au-dotted Si substrate for
the growth of (a) GeSiO
x
NT homostructures and (b) GeNW-GeSiO
x
NT
heterostructures. 85
x
List of Figures
Figure 5-2. (a) Low-magnification SEM image showing the general density of the as-
synthesized heterostructures. (b) and (c) SEM images of type-1 heterostructures. (d)
SEM image showing the smooth surface morphology and the abrupt wire-tube junction
of type-1 heterostructures. (e) SEM image of type-2 heterostructures. (f) Close-up
view of type-2 heterostructures showing the rough surfaces. 87
Figure 5-3. (a) and (b) Low-magnification TEM images of type-1 and type-2
heterostructures, respectively. HRTEM images of the GeNW portion in (c) a type-1
heterostructure and (d) a type-2 heterostructure. Both the GeNWs have a preferential
<111> growth direction. (e) to (g): FFT patterns of the GeNW segment in type-1 and
type-2 heterostructures, and the spherical ball at the wire-top of type-2 heterostructures,
respectively. (h) TEM image showing the abrupt wire-tube hetero-junction of a typical
type-2 heterostructure. 88
Figure 5-4. (a) Bright-field image of a type-1 heterostructure and STEM-EDX
mapping of (b) Ge, (c) Si, (d) O and (e) Au respectively. (f) TEM spot EDX spectrum
at the wire tip showing the strong presence of Au. 91
Figure 5-5. STEM-EDX mapping of (b) Ge, (c) Si and (d) O in a typical type-2
heterostructure shown in (a). 92
Figure 5-6 TEM spot EDX spectrum of a typical spherical ball at the tip of a type-2
heterostructure. 92
Figure 5-7. Temperature profiles of Ge and GeI
4
sources and Au-dotted Si substrate for
the growth of the wire-tube heterostructures. 93
Figure 5-8. Schematic depiction of the growth mechanism of type-1 heterostructures.
94
Figure 5-9. SEM images showing (a) an incomplete GeO
x
ball, (b) a complete
spherical ball near the tube open-end, (c) the initial wire growth, and (d) further OAG-
GeNW growth underneath the GeO
x
ball. 95
Figure 5-10. Growth mechanism of type-2 heterostructures. 95
Figure 5-11. Placement of an individual wire-tube heterostructure for thermal
rectification measurements. 99
Figure 5-12. Equivalent circuit representation of the thermal conductance measurement
setup. 100
Figure 5-13. (a) to (c) SEM images showing three GeNW-GeSiO
x
NT heterostructures
connected across the sensor/heater electrodes. The measured rectification for the three
heterostructures was 5.2%, 6.0% and 4.9% respectively. 102
xi
List of Figures
Figure 5-14. Graphical representation of ∆T
h
and ∆T
s
for the GeNW-GeSiO
x
NT shown
in Figure 5-13(a) obtained from the heat flows from wire to tube and vice versa. 102
Figure 6-1. Blocking property against catalytic etching by Cr/Au. 110
Figure 6-2. Schematic of the SiNW fabrication process. 111
Figure 6-3. (a) SEM micrograph of a pore-widened, through-pore AAO membrane and
(b) the corresponding Cr/Au nanodots deposited through the AAO membrane onto Si
(100). SEM images of etched SiNWs taken at (c) a 30
o
-tilt view (tilt angle from the
normal) and (d) a 0
o
-tilt view. 113
Figure 6-4. Size distributions of 100 individual masking Cr/Au dots and SiNWs for the
case of using an AAO template with an average pore size of 70 nm. 114
Figure 6-5. SEM images taken at a 45
o
-tilt view of the SiNWs fabricated after
immersion in the etching solution for (a) 30 sec, (b) 60 sec and (c) 120 sec. 115
Figure 6-6. (a) TEM image of a typical SiNW at low maginification. (b) HRTEM
image of another SiNW showing the well-defined lattice fringes throughout the wire.
117
Figure 6-7. SEM images of AAOs with average pore diameters of (a) 40 nm, (b) 50 nm,
(c) 60 nm, (d) 70 nm and (e) 80 nm. The corresponding SiNWs produced using these
AAO templates are shown in (f) to (j), respectively. 119
Figure 6-8. SEM image of SiNWs formed at the edge of an AAO-templating area. . 121
Figure 6-9. Masking effect by Ti/Au in catalytic etching of Si. 124
Figure 6-10. Masking effect by Cu/Au and Ni/Au in catalytic etching of Si. 126
Figure 6-11.SiNWs formed by AAO-templated Cu/Au nanodots as a hard mask
showing (a) a loss in alignment (viewed at a 45
o
tilt), and (b) irregular wire cross-
sections viewed from the top. 127
Figure 7-1. (a) SEM image of GeND arrays fabricated using an ultra-thin (~300 nm)
AAO template as an evaporation mask. (b) SEM image of regular arrays of GeNDs at
a highly magnification. 132
Figure 7-2. (a) AFM image of the GeNDs nanodots on a scan area of 500x500 nm
2
,
and (b) the corresponding SCM image of the GeNDs on the same area. 134
Figure 7-3. SCM images of Group I GeNDs illustrating the presence of contrast
reversal. 135
xii
List of Figures
Figure 7-4. SCM images of Group II GeNDs illustrating the absence of contrast
reversal. 136
Figure 7-5. δC/δV vs. V
tip
characteristics of the highly doped p-type silicon substrate at
a sweep rate of 0.1 V/sec showing negligible hysteresis between the forward sweep
(FS) and the reverse sweep (RS). 137
Figure 7-6. SCM δC/δV forward sweep (FS) and reverse sweep (RS) on a typical
GeND belonging to Group I before forming gas anneal. 138
Figure 7-7. SCM δC/δV forward sweep (FS) and reverse sweep (RS) on the same
Group I GeND (as in Figure 7-6) before forming gas anneal at a scan rate of (a) 10, (b)
2, (c) 1, and (d) 0.2 V/sec 140
Figure 7-8. Forward and reverse sweep δC/δV vs. V
tip
characteristics of a typical
Group I GeND before and after forming gas anneal. 141
Figure 7-9. Forward and reverse sweep δC/δV vs. V
tip
characteristics of a typical
Group II GeND before and after forming gas anneal. 143
xiii
List of Tables
List of Tables
Table 2-1. Summary showing the relationship between the average nanowire diameter
and standard deviation and the four process factors. 28
Table 4-1. Summary of experimental details on the growths of GeNWs, GeSiO
x
NTs
and the control experiments. 77
Table 6-1. Table of electronegativity of selected metals and Si. 123
1
Introduction and Motivation
Chapter 1 Introduction and Motivation
1.1 Nanotechnology
In 1959, Professor Richard Feynman presented a seminal talk at the annual
meeting of the American Physical Society at the California Institute of Technology
during which he first envisioned the impact of “things on an ultra-small scale” on
future science and technology.
1
He considered the possibility of direct manipulation of
individual atoms as a more powerful form of synthetic chemistry than those used at
that time. This was later termed as “nanotechnology” which encompasses broadly all
fields of applied science and technology whose unifying theme is the control of matter
at the atomic and molecular scale.
After Feynman’s talk, the world has witnessed phenomenal developments in
nanotechnology. Nanotechnology can now be found in a myriad of areas such as
biomedical and material engineering, life science, electronics, optics, magnetics and
electrochemistry. Novel and nanostructured materials, the fundamental building blocks
upon which nanotechnology is based, hold great promise for all these application fields.
1.2 Semiconductor Nanostructures
In the semiconductor industry, tremendous effort has been devoted to develop
nanoscale materials and devices that could enable new functions and/or greatly
enhance performance so as to meet the demand for ever more compact and powerful
systems. This is especially true in the field of electronics. It is widely acknowledged
that new materials, structures and device concepts are needed to sustain the relentless
2
Introduction and Motivation
trend of device scaling, which has now enabled more than one billion transistors to be
packed into a single chip from an initial number of 4000 in the early days (Figure
1-1).
2
In fact, the introduction of high dielectric constant (high-k) dielectrics and metal
gates into the production of complementary metal-oxide-semiconductor (CMOS) gate
stacks has already marked the onset of transistor scaling that has clearly become
dependent on novel nanostructured materials.
3,4
More such heterogeneous integrations
of new materials/technologies with the current CMOS platform are expected to further
device miniaturization in the near term. The CMOS transistor, however, cannot be
scaled down indefinitely as there are fundamental physical limits beyond which
quantum phenomena such as direct tunnelling of electrons between the source and
drain will occur.
5,6
In other words, the industry is facing an exciting yet daunting
challenge in the long run to invent fundamentally new approaches for information and
signal processing. This will likely require a revolutionary means of physically
representing, processing, storing and transporting of information via new materials,
processes and system architectures.
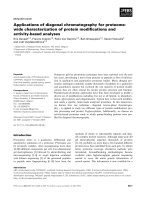
Figure 1-1. Intel central processing unit (CPU) transistor count trend. The dotted line
represents Moore’s Law, with a transistor count doubling every two years.
2
3
Introduction and Motivation
Semiconductor nanoparticles, nanotubes and nanowires, as explicitly pointed out
in the Emerging Research Devices (ERD) section in the International Technology
Roadmap for Semiconductors (ITRS) 2005 and reiterated in all the subsequent
revisions, are realistic solutions when the transistor downsizing reaches its limits.
7
Among the various nanostructures investigated, germanium (Ge) and silicon (Si)
nanowires receive particular attention. This could be partly due to the relatively low
cost of the materials and their compatibility with the current CMOS technology. More
importantly, due to the size effect, these nanostructures possess interesting properties
that are inaccessible or hard to achieve in their bulk counterparts. For example, Ge/Si
nanowires exhibit long carrier mean free path and improved mobility at room
temperature owing to reduced carrier scattering.
8
Transistor devices employing these
nanowires as channel materials yield substantially better performance than the planar
silicon metal-oxide-semiconductor field-effect transistors (MOSFETs).
9
Also, single-
electron transistors have been fabricated on the basis that the Schottky barriers at the
metal/Si contacts of a SiNW transistor can serve as tunnel barriers.
10
Not only have Ge and Si nanostructures demonstrated strong potentials in the field
of nanoelectronics, they have also showed great promises in ma n y other areas.
Applications of Ge and Si nanowires in various fields like photonics, photovoltaics,
sensing, thermoelectrics, nanoelectromechanical systems etc. have been reported.
11-19
Apart from the one-dimensional (1-D) nanowires, zero-dimensional (0-D)
nanocrystals/nanoparticles of Ge and/or Si are also intensively researched. Increasing
resources have been channelled into applying the enhanced electronic and/or optical
properties of these nanoparticles to device applications in optoelectronics, memory and
sensors.
20-22
4
Introduction and Motivation
1.3 Challenges and Opportunities in Syntheses of Si and Ge
Nanostructures
Despite the fact that Si and Ge nanostructures are gaining increasing popularity
from the industry and transistor devices based on these nanostructures are promising
candidates for new manufacturable information processing technologies “beyond
CMOS”, there still remains a number of unsolved problems and difficult challenges
before they can be fully adopted in the semiconductor industry.
Firstly, most of the works thus far focused on the synthesis and applications of
homogeneous nanostructures of Si and Ge, mainly Si and Ge nanowires. Studies on
other structures, for example nanotubes or heterogeneous nanostructures, are not so
extensive. Exploration of other Si and Ge nanostructures in addition to nanowires and
nanoparticles will be important since a rich variety of Si and Ge nanostructures not
only offers more freedom in the design and fabrication of future nanosized devices, but
also allows the potential development of devices with new functionalities and/or
reduced cost.
Furthermore, an important issue in realizing applications of various Si and Ge
nanostructures is obtaining a precise control of the key nanomaterial parameters,
including chemical composition, structure, morphology, size etc. It is these parameters
that determine, for example, the electronic and optoelectronic properties of the devices.
A significant challenge for the synthesis of Si and Ge nanomaterials therefore lies with
how to rationally control the nanostructures assembly so that their size, dimensionality,
interfaces, and ultimately, their two-dimensional and three-dimensional superstructures
can be tailor-made towards desired functionalities.
5
Introduction and Motivation
The works described in this thesis focus on the above-mentioned two aspects, i.e.
(a) exploration of self-assembled synthesis and the possible applications of new Si
and/or Ge nanostructures and, (b) achieving a controlled growth of Si and Ge
nanostructures.
1.4 Organization of Thesis
This thesis consists of eight chapters describing studies on syntheses on new Si
and Ge nanomaterials/nanostructures as well as attempts in achieving controlled
nanostructure growths.
Following the present chapter (Chapter 1) on the background of the project, there
are two chapters reviewing the theoretical and practical information needed for the
works carried out in this thesis. Chapter 2 gives a detailed literature survey on the
synthesis of Si and Ge nanowires that are the most intensively researched Ge and Si
nanostructures. The theory of the formation of anodic aluminium oxide (AAO), as well
as the working principle of a specialized characterization technique, scanning
capacitance microscopy (SCM), used in this project are briefly described in Chapter 3.
There are four main chapters that discuss the experimental findings. Chapter 4
gives a detailed description of the fabrication and characterization of a new type of
nanostructure, germanium-silicon oxide nanotubes (GeSiO
x
NTs). A follow-up work on
the oxide nanotubes is presented in Chapter 5, in which the formation of novel
heterostructures of germanium nanowires (GeNWs) and GeSiO
x
NTs is discussed in
detail. The potential application of such heterostructures in thermal rectification is also
investigated and reported in the chapter.
6
Introduction and Motivation
Chapter 6 reports on a simple and cost effective method to fabricate uniform,
high density and well-aligned silicon nanowires (SiNWs). The SiNW synthesis is
achieved by using metal nanodot arrays as a blocking material in catalytic chemical
etching. The metal nanodots are formed by thermal evaporation through an AAO
template. The application of the AAO template as an evaporation mask is also utilized
in the fabrication of regular arrays of free-standing germanium nanodots (GeNDs),
which are presented in Chapter 7. The chapter also examines the charge trapping
characteristics in the GeNDs and the passivation of the hole trap sites.
Lastly, Chapter 8 summarizes the findings reported in this project. The thesis
then concludes by suggesting a number of possible directions for future works.
7
Literature Review
Chapter 2 Literature Review
Among various Si and Ge nanostructures, homogenous Si and Ge nanowires
(SiNWs and GeNWs) are most intensively researched. While the synthesis of SiNWs
and GeNWs encompasses a wide variety of methods and tools, the underlying
mechanisms in many cases are remarkably similar. This chapter reviews the two
mechanisms that have been widely used to explain the nanowire formation: the
vapour-liquid-solid (VLS) growth in bottom-up processes and the metal-assisted
chemical etching in top-down approaches. The details of each mechanism, as well as
the properties of nanowires produced are also discussed.
2.1 VLS Growth of Si and Ge Nanowires
2.1.1 VLS Mechanism and Its Variants
Si and Ge nanowires, though chemically different, can be synthesized through a
common technique employing the VLS mechanism. The VLS growth mechanism was
first proposed by Ellis and Wagner in 1964 to explain the formation of micrometer-
sized single crystal silicon wires.
23
Today, the VLS mechanism has been frequently
referred in numerous literatures and it has been extended to explain the bottom-up
growths of NWs of other materials, for example Ge and III-V materials.
As the name suggests, the VL S growth mechanism of nanowires involves three
different phases, which are the vapour precursor, the liquid alloy of the reactive
species with the catalyst (usually metal), and the solid wire. The transitions from one
phase to the next, as well as the wire formation are made possible by the presence of
8
Literature Review
the catalyst, which is of prime importance and also the most prominent element of a
VLS growth.
In general, VLS growth of SiNW or GeNW can be divided into three stages:
alloying, nucleation and precipitation.
24
Here, SiNW using gold (Au) catalyst is
discussed for the ease of illustration; GeNW growth and growths using other types of
catalysts are analogous.
a) Alloying
Vapour precursor containing the reactive species is first introduced to the growth
chamber. Different methods have been employed to generate the precursor that
contains the semiconductor atoms of interest in vapour state. For chemical vapour
deposition (CVD) systems, gaseous sources are commonly used.
25,26
Generation of
elemental Si or Ge vapour can also be achieved through physical means such as laser
ablation in laser-assisted depositions,
27
electron-beam heating on Si targets in
molecular beam epitaxy (MBE) growths,
28,29
or simply by thermal evaporation.
30
When the vapour precursor is allowed to flow over the metal catalyst,
physisorption of the precursor on the catalyst surface occurs and this is followed by the
subsequent incorporation of the Si atoms into the catalyst. For the case of a molecular
precursor, a bond breaking process after the physisorption is necessary to produce free
Si atoms before they can be absorbed into the metal catalyst. Incorporation of the
semiconductor atoms into the metal catalyst results in the formation of a binary alloy
whose physical state depends on its eutectic temperature, T
eutectic
, and the growth
temperature. In the case of a system with low T
eutectic
, for example, Au-Si, the alloy is
usually in liquid state since the growth temperature is generally higher than T
eutectic
.
9
Literature Review
b) Nucleation
With further inclusion of the Si atoms into the Au catalyst, the atomic
concentration of the semiconductor in the alloy increases and eventually reaches
supersaturation. Supersaturation is a condition where the maximum percentage of Si is
reached and beyond which Si and the Au catalyst can no longer coexist in the liquid
state at a given temperature. Once supersaturation is reached, the composition of the
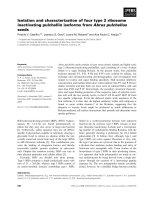
alloy crosses the second liquidus line in the binary phase diagram (Figure 2-1) and
enters a dual phase region, i.e. Au-Si liquid alloy and Si crystal, marking the onset of
the nucleation of Si atoms and the nanowire growth.
Figure 2-1. (a) Au-Si binary phase diagram showing the compositional and phase evolution
during the nanowire V LS growth process. (b) Schematic depiction of the nanowire VLS
growth.
c) Axial Growth
When nucleation of the Si commences, it manifests itself as crystal growth of Si at
the alloy-substrate (i.e. the liquid-solid) interface rather than individual suspended
solid precipitates in the liquid alloy as less energy will be involved with the crystal
step growth as compared with secondary nucleation events in a finite volume. Once the
Si atoms start to crystallize, further dissolution of the Si vapour into the system will
increase the amount of Si crystal precipitating out from the alloy. As a result, the
10
Literature Review
existing liquid-solid interface will then be pushed forward (or upwards) and a solid
wire grows underneath the catalytic tip. After the growth and the system cools, the
alloy droplet will solidify and is often observed on the wire tip as a hemispherical cap.
This metal alloy cap is commonly referred as a direct evidence of the VLS growth
mechanism.
2.1.1.1 VLS vs. VSS Growth
Though most of the nanowire syntheses are usually performed at temperatures
higher than T
eutectic
, nanowire growths below the eutectic temperatures have also been
reported.
31-34
This has created a long-standing controversy on whether the nanowire
growth below the eutectic temperature involves a liquid droplet or a solid particle of
the catalytic material. Kodambaka et al.
35
addressed this issue by conducting a
nanowire growth in a transmission electron microscope equipped with deposition
facilities and monitoring the growth process in situ.
Whether the nanowire growth occurs via a VLS or vapour-solid-solid (VSS) route
can be determined from the shape of the gold alloy at the nanowire tip during growth.
A liquid gold droplet has a smooth, almost half-spherical shape, whereas solid gold
shows planes, edges, and pointed corners that can be easily identified. Kodambaka and
co-workers observed that, as expected, nanowire growth above the eutectic
temperature had a liquid droplet on top of the nanowire which clearly indicated the
VLS mechanism was involved. However, two distinctly different phenomena were
noted for growths below the eutectic temperature. While the VSS mechanism prevailed
for sub-eutectic growths of small nanowires, the V L S mechanism was observed for
nanowires of relatively large diameters. In some cases, the gold nanodroplets remained
liquid even though the growth temperature was 100
o
C lower than T
eutectic
. The authors
11
Literature Review
concluded that the catalyst state depended not only on the nanowire diameter, but also
on the growth pressure and the thermal history.
35
2.1.1.2 SLS Growth
The solution-liquid-solid (SLS) growth is analogous to the VLS growth process,
with the only difference lying in the physical form of the precursor. As the name
suggests, the precursor in a SLS process is in solution form. SLS growth was first
explained by Buhro et al. for the fabrication of highly crystalline III-V semiconductor
nanowires at relatively low temperatures.
36
In a typical procedure, the desired
semiconductor material is generated through a solution-based growth in which
nanometer-scale metallic droplets catalyze the decomposition of metallo-organic
precursors. Since T
eutectic
of most binary systems exceed the boiling temperatures,
which are known as the critical points, of the conventional solvents, nanowire growth
in solution usually requires the pressurization of the solvents. When pressurized, the
solvents can be heated above their critical points and are not vapourized. This is
known as a supercritical condition. The supercritical solution-phase approach was soon
extended to the synthesis of semiconductor nanowires using mono-dispersed metal
nanoparticles as catalyst. Si and Ge nanowires with well-controlled diameters and high
crystal quality can be readily obtained in these cases.
37-39
2.1.1.3 Comparison of VLS (VSS) and SLS Growths
At the present stage of development, only tentative predictions can be made about
relative strengths and weaknesses of the different catalyzed nanowire growth methods.
The results reported to date indicate that VLS and SLS growths are probably
equally capable of controlling the wire diameter distributions through the utilization of