Investigating risky decisions of construction contractors in competitive bid mark ups
Bạn đang xem bản rút gọn của tài liệu. Xem và tải ngay bản đầy đủ của tài liệu tại đây (2.88 MB, 158 trang )
INVESTIGATING RISKY DECISIONS OF CONSTRUCTION
CONTRACTORS IN COMPETITIVE BID MARK-UPS
BUDI HARTONO
NATIONAL UNIVERSITY OF SINGAPORE
2010
INVESTIGATING RISKY DECISIONS OF CONSTRUCTION
CONTRACTORS IN COMPETITIVE BID MARK-UPS
BUDI HARTONO
(B.Eng. (Hons.), ITB; MPM, UQ)
A THESIS SUBMITTED
FOR THE DEGREE OF DOCTOR OF PHILOSOPHY
DEPARTMENT OF INDUSTRIAL AND SYSTEMS ENGINEERING
NATIONAL UNIVERSITY OF SINGAPORE
2010
i
Acknowledgement
For indeed, with hardship (will be) ease [QS 94:5]
It is my pleasure to show appreciation to outstanding people who made this thesis possible.
I would like to express my deep gratitude to my supervisor Dr. Yap Chee Meng. Dr. Yap has
always inspired me to improve the quality of my work and at the same time has provided a lot of
opportunity for me to work independently. I would like to show my appreciation to Prof. Ang
Beng Wah and Assistant Prof. Chai Kah Hin who serve in the thesis committee for their valuable
feedbacks and comments.
My warm thanks are due to Prof. George Ofori who, in the early stage of this study, had provided
remarkable insights on doing research in the construction management field. I warmly thank
A/Prof. Tan Kay Chuan who had provided support and suggestion especially during the empirical
study. I also thank all participating respondents of the empirical study. I am grateful to A/Prof
Aaron Chia Eng Seng for his advice and friendly encouragement. I am also indebted to the
anonymous external examiner who had provided constructive feedbacks.
I wish to thank to the efficient assistance of staff of the ISE Department, NUS as well as the
cheerful support from the AUN/SEED-NET staff in Bangkok. The financial support of the joint
AUN/SEED-NET and NUS scholarship is gratefully acknowledged.
My gratitude also goes to my friends and colleagues for their warm friendships.
Last but not least, I owe my loving thanks to my wife Andriana, daughters Kirani and Aruni, and
my entire family in Indonesia. Thank you for your patience, understanding, support, and pray.
ii
Summary
The bid mark-up decision is considered important and complex from a construction
contractor‟s perspective. This study aims at examining contractors‟ risky bid mark-up decisions in
a competitive bidding setting from a descriptive research school of thought.
Grounded to Prospect Theory and One-Reason Decision Model, a contingency-based
theoretical framework of three scenarios was developed to explain and to predict bid mark-up
decisions in lights of four identified determinants, namely: perceived „rate of returns‟, „revenues‟,
„project backlogs‟, and „project strategic importance‟.
The three scenarios according to this framework were verified by means of a self-
administered survey in Singapore construction industry. By using taxonomic approach, five
groups of bidders with distinctive bid profiles were identified and the associated bid mark-ups
were calculated. Characteristics of the groups were found in agreement with pertinent scenarios of
the theoretical framework. One group of bidders (n=16) supported Scenario 1 of the framework in
which participating bidders had considered the reported project bid as having high strategic
importance to their organizations and hence made aggressive, low bid mark-ups. Another group
(n=4) supported Scenario 2 where bidders deemed the reported projects being non-strategically
important and assessed their own companies‟ project backlogs being above aspirations; and
therefore made risk averse, high bid mark-ups. Three different groups (n=22, n=5, and n=3)
respectively supported different subsets of Scenario 3 of the framework. Scenario 3 refers to
conditions where bidders perceive the observed projects as having low strategic importance and
their own companies had performed below aspirations for at least one of the three performance-
related determinants and hence made low bid mark-ups. The verified framework could be used by
contractors to improve their own bidding strategy in anticipating the likely behavior of the
competitors.
Keywords: bid mark-ups, construction, prospect theory, one-reason decision model, taxonomy
iii
Table of Contents
Acknowledgement _________________________________________________________ i
Summary _______________________________________________________________ ii
Table of Contents _______________________________________________________ iii
List of Tables ____________________________________________________________ vi
List of Figures __________________________________________________________ vii
1 Introduction _________________________________________________________ 1
1.1 Bid Mark-ups ____________________________________________________________ 1
1.2 Motivation ______________________________________________________________ 3
1.3 Objective _______________________________________________________________ 4
1.4 Scope __________________________________________________________________ 4
1.5 Contribution _____________________________________________________________ 4
1.6 Organization of the Report _________________________________________________ 5
2 Past Studies on Bid Mark-up Decisions __________________________________ 7
2.1 Decision under Uncertainty: the Risky Choice Problem ___________________________ 7
2.2 Prospect Theory (PT) as a Descriptive Model __________________________________ 10
2.3 Prescriptive and Descriptive: the Two Research Camps __________________________ 14
2.4 Prescriptive Studies in Bid Mark-up Decisions _________________________________ 16
2.5 Descriptive Studies in Bid Mark-up Decisions _________________________________ 16
2.6 Categories of Determinants affecting Bid Mark-up Decisions _____________________ 22
3 Theoretical Model ___________________________________________________ 27
3.1 The Selected Four Determinants and a Control Variable _________________________ 27
3.2 Posited Individual Propositions _____________________________________________ 30
3.2.1 Relationships between Performance-related Determinants and Bid Mark-ups _________ 30
3.2.2 Relationships between Rate of Returns and Bid Mark-Ups _______________________ 37
3.2.3 Relationships between Revenues and Bid Mark-Ups ____________________________ 38
3.2.4 Relationships between Project Backlogs and Bid Mark-Ups ______________________ 39
3.2.5 Relationships between Project Strategic Importance and Bid Mark-Ups _____________ 40
3.3 Contingency Framework to Explain and to Predict Bid Mark-up Decisions __________ 41
3.4 Operational Definitions of Key Variables _____________________________________ 47
3.4.1 Bid Mark-ups (Y) _______________________________________________________ 47
3.4.2 Rate of Returns (X
1
) _____________________________________________________ 48
3.4.3 Revenues (X
2
) __________________________________________________________ 48
3.4.4 Project Backlogs (X
3
) ____________________________________________________ 48
3.4.5 Project Strategic Importance (X
4
) ___________________________________________ 49
3.4.6 Contractor Size (Control Variable) __________________________________________ 52
iv
4 Instrument Development and Evaluation ________________________________ 53
4.1 Instrument Development Procedure __________________________________________ 53
4.2 Qualitative Evaluation of Instrument Validity __________________________________ 55
4.2.1 Objective _____________________________________________________________ 56
4.2.2 Methods of Inquiry ______________________________________________________ 57
4.2.3 Results _______________________________________________________________ 58
4.2.4 Discussions ____________________________________________________________ 61
4.3 Quantitative Evaluation of Instrument Reliability and Validity _____________________ 61
4.3.1 Objective _____________________________________________________________ 62
4.3.2 Methods of Inquiry ______________________________________________________ 62
4.3.3 Respondents ___________________________________________________________ 62
4.3.4 Descriptive Statistics of Key Variables ______________________________________ 65
4.3.5 Assessing Instrument Reliability ___________________________________________ 66
4.3.6 Assessing Instrument Convergent and Discriminant Validities ____________________ 67
4.3.7 Evaluating Common Method Biases ________________________________________ 69
4.4 Concluding Remarks _____________________________________________________ 70
5 Main Empirical Study Administration and Descriptive Data ________________ 71
5.1 Data Inquiry ____________________________________________________________ 71
5.1.1 Targeted Respondents ___________________________________________________ 71
5.1.2 Methods of Inquiry ______________________________________________________ 72
5.1.3 Response Rate and Sampling Size __________________________________________ 73
5.2 Data Treatment and Cleansing ______________________________________________ 76
5.2.1 Data Transformation ____________________________________________________ 76
5.2.2 Checking Eligibility of Respondents ________________________________________ 76
5.2.3 Dealing with Missing Data ________________________________________________ 77
5.3 Post Hoc Evaluation on Validity ____________________________________________ 77
5.3.1 Assessing Discriminant and Convergent Validities (Post Hoc) ____________________ 78
5.3.2 Assessing Possible Existence of Common Method Biases (Post Hoc) ______________ 79
5.3.3 Assessing Possible Existence of Multicollinearity among Independent Variables _____ 80
5.3.4 Assessing Correlations between Covariate and Independent Variables ______________ 82
5.4 Descriptive Data _________________________________________________________ 82
5.4.1 Participating Companies and Respondents ___________________________________ 82
5.4.2 Key Variables __________________________________________________________ 88
6 Taxonomic Approach to Verifying the Theoretical Framework _____________ 91
6.1 Why Taxonomic Approach? _______________________________________________ 91
6.2 Assumptions and Procedures _______________________________________________ 92
6.3 Identified Clusters ______________________________________________________ 100
6.3.1 Profiles of Emerging Clusters ____________________________________________ 100
6.3.2 Does Contractor Size as a Covariate Matter? _________________________________ 102
6.4 Bid Clusters and the Theoretical Framework __________________________________ 104
6.5 Further Discussions _____________________________________________________ 110
v
6.6 Limitations and Future Extensions _________________________________________ 113
6.6.1 Validity of Instrument ___________________________________________________ 113
6.6.2 Representativeness and Non-Response Bias __________________________________ 113
6.6.3 Sample Size and Selected Statistical Analysis ________________________________ 114
6.6.4 Future Extensions ______________________________________________________ 115
7 Conclusion ________________________________________________________ 118
References ____________________________________________________________ 120
Appendices ____________________________________________________________ 127
vi
List of Tables
Table 2.1 Comparison between Expected Utility Theory and Prospect Theory 14
Table 2.2 Past Studies on Construction Bid Mark-up Decisions 18
Table 2.3 Significant Factors Affecting Bid Mark-up Decisions according to Past Studies 19
Table 3.1 Two Competing Conceptions on Risky Bidding 34
Table 3.2 Contingency Framework of Bid Mark-Up Decisions 45
Table 3.3 Item List for Project Strategic Importance 50
Table 4.1 List of Questionnaire Items 54
Table 4.2 Items for the Pilot Study 56
Table 4.3 Profile of the Qualitative Pilot Respondents (n = 8) 58
Table 4.4 Results Summary of the Qualitative Pilot Study 58
Table 4.5 Experience of Respondents (n = 13) 64
Table 4.6 Descriptive Statistics of Variables* 65
Table 4.7 Results of the Inter-Item Reliability Analysis for „Project Strategic Importance‟ 67
Table 4.8 Matrix of Correlation Coefficients of Items (Pearson‟s, n = 25) 69
Table 5.1 Information relevant to the Survey Administration 74
Table 5.2 Post Hoc Analysis of Matrix of Correlation Coefficients of Items (Pearson‟s, n = 50) 79
Table 5.3 Pearson‟s Correlation Coefficients, Tolerances, and VIFs 81
Table 5.4 Companies‟ Bid Success Rate in the Last Three Years (n = 46) 85
Table 5.5 Bid Success Rates across Different Contractor Groups 86
Table 5.6 Bid Success Rates across Different Bid Methods 86
Table 5.7 Experience of Respondents (n = 50) 88
Table 5.8 Descriptive Statistics of Key Variables (n = 50) 89
Table 6.1 Ten Bid Cases with the Highest Values of Mahalanobis Distances (D
2
) 95
Table 6.2 Descriptive Statistics of the Five Emerging Clusters 101
Table 6.3 Results of ANOVA and ANCOVA for Bid Mark-Up Values (Y) across Five Clusters
103
Table 6.4 Theoretical Framework and Emerging Bid Clusters 105
vii
List of Figures
Figure 2.1 Case 1 of a Revised Version of Allais Paradox (Kahneman and Tversky 1979) 7
Figure 2.2 Utility Function according to Utility Theory 8
Figure 2.3 Case 2 of a Revised Version of Allais Paradox (Kahneman and Tversky 1979) 10
Figure 2.4 Value Function of Prospect Theory 11
Figure 4.1 Company Financial Classifications [CW01, General Building] (n = 13) 63
Figure 4.2 Current Designations of the Respondents (n = 13) 64
Figure 4.3 Number of Involvement in Bid Mark-up Decisions (n = 13) 64
Figure 5.1 Company Financial Classifications [CW01, General Building] (n = 50) 83
Figure 5.2 Proportion Comparison between Sample and Population of Company Financial Grades
(n = 50) 83
Figure 5.3 Most Preferred Bid Mark-up Methods (n = 50) 84
Figure 5.4 Comfortable Level of Currently Applied Bid Methods (n = 50) 84
Figure 5.5 Current Designations of the Respondents (n = 50) 87
Figure 5.6 Number of Involvement in Bid Mark-up Decisions (n = 49) 87
Figure 6.1 Dendogram of Cluster Analysis (n = 50) 94
Figure 6.2 Changes of Agglomeration Coefficients for the Last Ten Stages of Cluster Formations
98
Figure 6.3 Normalized Profiles for a 5-Cluster Solution 99
1
1 Introduction
1.1 Bid Mark-ups
Construction contractors define „bid mark-ups‟ differently
1
. Consistent with the finding by
Hegazy and Moselhi (1995), this research defines the bid mark-up decision as a contractor‟s
decision making process to determine the monetary value in terms of percentage which needs to
be added on top of the estimated firm overhead, project direct and indirect costs, and contingency.
It follows the traditional cost-plus strategy in the sense that the total project bid price is
determined by summing up all the relevant cost elements as mentioned previously and marking
them up by a certain percentage to cover the expected project profit margin.
The bid mark-up decision is deemed crucial and complex from a contractor‟s business
perspective. It has a direct bearing towards contractors‟ well-being in the long run. For
construction firms, performing projects for other organizations (the project owners, clients) is
their core business. Doing projects and earning adequate profits from the projects are key factors
for contractors‟ sustainable survival and growth (Egemen and Mohamed, 2007). Tenah and
Coulter (1999) asserted that mark-up determinations in construction competitive bidding projects
were “more critical than ever” (p.39). Shash (1995) argued that bid mark-up decisions had a direct
effect to the firms‟ business. Arditi et al. (2000) conducted an analysis using a series of U.S.
business failure records which were compiled in (Dun and Bradstreet, 1989-1993) to identify
factors affecting contractors‟ business failures in construction industry. It was found that out of
twenty identified factors; contractors‟ insufficient profits were positioned on top of the list,
accounting for about a quarter of the entire reported business failures in construction industry.
Discussing the finding, Arditi et al. (2000) argued that insufficient profit could be attributed
1
For example, study by Hegazy and Moselhi (1995) in US and Canada found that 44% of respondents included only
profit margin in the bid mark-up, 33% included profit and contingency, 17% included profit and general overhead, 4%
included profit, general over head, and contingency, 3% included profit, general and project overhead, and contingency.
Moreover, it was found that the definition of the base cost varied. Forty percent used (direct cost + project overhead +
general overhead) as a base cost in which the percentage of mark-up would be added, 27% used (direct cost + project
overhead), 33% used only the direct cost.
2
mainly to the highly competitive construction environment and a difficulty on determining the
right bid mark-ups.
In many occasions, project contracts are pursued by contractors participating in a competitive
bidding process. Contractors compete with each other to win a contract on the basis of project bid
price and other criteria (Shash, 1995). An open announcement or a selective invitation usually
precedes the bidding. Eligible contractors may then decide whether or not to participate in the
particular bidding process. Once a contractor has decided to take part on the process, a major
decision for the contractor is to decide the „right‟ level of monetary value of the bid mark-up for
the project being offered. The „right‟ decision on bid mark-ups is vital for contractors to secure
business objectives of their own organizations.
Determining bid mark-up values is surely not an easy task even for the most seasoned
contractors‟ bidders. In the lowest-cost-as-a-winner bidding system
2
, the traditional key decision
trade-off includes determining the mark-up value low enough to increase the chance to win the
contract yet high enough to earn expected profit (Akintoye and Skitmore, 1992). Moreover,
winning a particular project contract is not necessarily good news from a contractor‟s financial
perspective. In many occasions, contractors may win bids only to find out later that the actual
revenues are substantially lower than the costs required delivering the projects. In a lump sum
contract (for explanation refer to (Shash, 1995)), such a situation implies that contractors earn
negative profits even though they win the contract. In construction industry, the condition of
winning the bid but losses the project often occurred (Betts and Brown, 1992). In a more general
context of auctions, the term winner‟s curse was used to reflect the situation (Bazerman, 1998;
Bazerman and Samuelson, 1983).
Empirical research supported the assertion that a traditional goal of maximizing the expected
project profit was not always the case in project bids. According to Friedman (1956) and Oo et al.
(2007), bid mark-up strategy might be driven by various motivations other than maximizing
profits, such as: minimizing expected losses, minimizing profit for competitors, maintaining
2
Assuming that the efficiency level of the competing bidders is on par and the estimated total costs are similar across
different bidders (see for instance (Tenah & Coulter 1999)).
3
current level of capacity, and strategic concerns (e.g. market penetration). Empirical findings also
suggested that bid mark-up decisions were performed mostly by senior management by using
subjective judgment, gut feeling, and heuristics (Ahmad and Minkarah 1988; Egemen and
Mohamed 2007; Mochtar and Arditi 2001; Ofori 1993).
Bidding process is a tense process. Betts and Brown (1992) asserted that a short tendering
timeline combined with extensive document requirements were commonly observed. In addition,
knowing the (usually large) number of competing bidders put more pressure on the contractor side
during the process. This might be compounded by delayed feedbacks from prospective key sub-
contractors which purposely withhold their work package quotations until the last minutes to
prevent other competing sub-contractors making an advantage on early disclosures (Ling and Liu,
2005). Fayek et al. (1998) and Wallwork (1999) mentioned that the decision of bid mark-ups was
often carried out shortly before the tender submission. Pressures during the process may affect
emotional responses of the decision makers (Xu and Tiong, 2001).
The fact that a bid mark-up decision is a difficult, tense process and it heavily relies on
human judgment suggests that the process is prone to human errors. The limited mental
processing capability of human decision makers may cause errors in judgment which could
eventually lead to less than optimum decisions. It was argued by Hogarth (1980) that judgmental
biases were likely to occur on conditions where tasks were characterized by the following
attributes: high level of stress, high complexity, and high procedural uncertainty. The bid mark-up
decision seems to fit all the conditions leading to judgmental biases.
1.2 Motivation
This current study is motivated by the fact that some research opportunities in bid mark-up
studies could still be identified as fully elaborated in Chapter 2. Past empirical studies in the
prescriptive stream mainly focused on developing tools or methods to aid bid decisions with a
rather overemphasis on an objective to maximize profits. On the other hand, majority of studies in
the descriptive decision theory camp aimed at identifying a wide range of determinants affecting
bid mark-ups. The wide coverage results in limited in-depth analysis leading to few insights
4
which could be learned from the studies. In addition, the studies often assumed isolated,
independent relationships between respective determinants and bid mark-ups thus overlooked the
possible interrelationships among determinants. Contingency effects were not accounted in the
studies leading to a less than accurate prediction and explanation of bid mark-ups. Last but not
least, most studies did not explicitly incorporate a relevant theory of risky decision making. This
would hinder the development of a rigorous theoretical model on bid mark-up decisions.
Accordingly, a research is needed to address the identified research opportunities and, in turn, to
advance the existing knowledge in a practically important and complex topic of bid mark-up
decisions.
1.3 Objective
This research aims at investigating risky bid mark-up decisions of senior management from
construction contractors in a competitive bidding setting. In particular, the specific objective is to
develop and to empirically verify a contingency-based theoretical framework which explains and
predicts bid mark-up decisions.
1.4 Scope
This research can be categorized as a quantitative research under the descriptive decision
theory school of thought. This research is not to develop a method or technique to assist bid mark-
up decisions as studies in the prescriptive camp to be described later. The unit of analysis of this
research is individual decision makers or bidders. In particular, the targeted respondents are senior
managers from Singapore construction contractors who directly involve in bid mark-up decisions.
The invited Singapore contractors are those with tendering limits at least SGD 5 Millions or
Grade C1 for the General Building (CW01) category. Research is to be limited to the context of
competitive bidding.
1.5 Contribution
This study promises two significant contributions. From an academic standpoint, this
research provides an advancement of knowledge on competitive bid mark-up decisions. In
5
particular, it extends the existing studies by providing an alternative theoretical model for
examining bid mark-up decisions from a contingency perspective. The model is believed to be
parsimonious and theoretically grounded, and it is supported by past relevant empirical findings.
Furthermore, the theoretical model is verified by means of an empirical study.
In the long-run, for researchers in the descriptive decision theory camp, this research could
be seen as a starting point for a series of studies focusing on identifications of the possible
existence of judgmental biases in bid mark-up decisions. If evidence of such studies supports the
speculation, procedures might be developed to minimize biases leading to quality improvement of
bid decisions. For prescriptive researchers, this research may provide a further motivation to
venture beyond an objective of profit maximization when developing models to aid bid mark-up
decisions.
From a practical perspective, this research can help to reveal the general pattern of bid mark-
up behavior in a competitive setting in light of the selected determinants. The verified framework
could be used by contractors which mostly depend on gut feelings to improve their own bidding
strategy in anticipating the likely behavior of the competitors.
Results of this study would also complement the more quantitative tools of bid decisions
which were developed under the prescriptive decision theory camp as asserted by Boughton
(1987):
“[Outcome of quantitative bidding models] … must be evaluated in light of judgements concerning
the competitors‟ current economic and psychological predisposition. A qualitative profile of
competitors should be developed that would include an evaluation of each competitor‟s workload,
financial situation, attitude toward risk, and overall management philosophy. This qualitative
assessment places emphasis on the current and likely future behavior of the competition rather than on
the past.” [pp. 92-93].
1.6 Organization of the Report
The remainder of this report is organized as follow. Chapter 2 provides a review of relevant
literatures on risky decision making and bid mark-up decisions. It elaborates the existing studies
6
on bid mark-ups and highlights some research opportunities. Chapter 3 focuses on theoretical
model development. Chapter 4 provides information on the procedure of developing the survey
instrument. Main empirical study administration is described in Chapter 5 while results and
discussions of the empirical analysis are presented in Chapter 6. Chapter 7 provides conclusion of
this study.
7
2,500
Prob. 0.33
2,400
0.66
0
0.01
A
B
2,400
2 Past Studies on Bid Mark-up Decisions
In this section, existing literatures relevant to studies of bid mark-ups are reviewed. Section
2.1 provides a brief literature review on past studies pertinent to human risky decision making.
Section 2.2 elaborates Prospect Theory which is considered as one the most influential descriptive
theory of decision making. Section 2.3 highlights distinctions of two research camps of individual
decision making, namely: prescriptive and descriptive. Sections 2.4 and 2.5describes past studies
in bid mark-ups from the prescriptive and descriptive camps. Section 2.6 presents an elaboration
on specific key studies of bid mark-up decisions which serve as an empirical foundation for this
study.
2.1 Decision under Uncertainty: the Risky Choice Problem
Scholars in the domain of cognitive psychology, economics, and management have a great
interest on examining human decision making behavior in the face of uncertain outcomes. The
topic is particularly appealing because virtually any decision making process involves uncertainty.
In the most generic level, decision making under uncertainty may also be represented as an
acceptance of a gamble (Kahneman and Tversky 1984). A typical simple choice problem
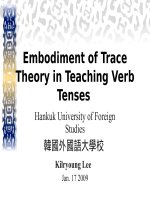
commonly observed is presented by Figure 2.1 (taken from (Kahneman and Tversky 1979)):
Case 1
Figure 2.1 Case 1 of a Revised Version of Allais Paradox (Kahneman and Tversky 1979)
In case 1, decision makers are required to choose between two alternatives or prospects,
namely: A or B. Prospect A has uncertain outcomes with three possibilities: a 2,500 monetary unit
pay-off with a probability of 0.33; 2,400 with a probability of 0.66; and 0 with 0.01. Prospect B,
8
utility
Cumulated
wealth
Risk
averse
Risk
seeker
Risk
neutral
on the other hand, has a sure outcome of 2,400. Kahneman and Tversky (1979) argued that risky
choice problems (as exemplified in Case 1) may represent a broad problem of decision making
under uncertainty.
The traditional way of selection among prospects is by using simple calculation of expected
monetary value (EMV). EMV for each prospect is calculated as the sum of products of probability
and its associated pay-off. Rational decision makers will choose a prospect with the highest EMV.
In Case 1, prospect A with an EMV of 2,409 will be normatively preferred to B with an EMV of
2,400.
According to Kahneman and Tversky (1984) and Bazerman (1998), Daniel Bernoulli first
proposed concepts of expected utility to substitute the EMV. According to Bernoulli, degree of
pleasure (or utility) perceived by decision makers is not necessarily linearly associated with the
monetary value or wealth of a prospect. Decision makers will rationally select an alternative with
the highest expected utility which does not always bear the maximum EMV as suggested by the
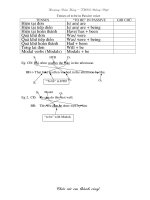
non-linear relationship. Bernoulli argued that on the face of uncertain outcomes, different decision
maker might behave differently. Their behaviors reflect one of three risk preferences: risk
seeking, neutral, or averse. Figure 2.2 depicts three different risk preferences in a utility function.
Risk aversion is modeled by a concave curve, risk neutral by a linear curve, and risk seeking by a
convex curve. The building block of the utility-based decision concepts is termed Utility Theory
(UT).
Figure 2.2 Utility Function according to Utility Theory
9
Revisiting Case 1, according to UT, the selection of the prospects depends on the risk
preference of the decision maker. For risk averse decision makers, Prospect B may be preferable
because they prefer a sure pay-off with less monetary value to a risky choice which bears higher
EMV. For the same case, risk neutrals or risk seekers will choose Prospect A. Risk neutrals will
compare the EMV of the risky choice and the sure pay-off and choose the one with higher worth.
For risk takers, they are willing to take a risky choice which bears lower EMV compared to the
sure prospect. While utility theory acknowledges three types of risk preferences, the most
commonly used assumption in analysis is that decision makers are risk averse (Nickel &
Rodriguez 2002).
Since the pioneering work of UT by Bernoulli, the original concept of expected utility has
been extended by many scholars. Von Neumann and Morgenstern (1947) developed the axioms of
UT which should govern the preferences of any rational decision makers. Hence the development
of UT can be seen as using deductive approach grounded to some first principles (axioms).
Behaviour of decision makers who comply with the axioms will be consistent to rational decision
making procedures which attempt to maximize expected utility (Clemen and Reilly 2001).
Reversely, violations of the axioms will result in decisions which do not maximize the expected
utility.
Many empirical works in the field was carried out to test the descriptive and predictive
powers of UT. In a number of occasions, some violations of UT had been reported concerning UT
as a descriptive model. One of the most prominent cases is the Allais Paradox (Allais 1953) cited
by (Kahneman and Tversky 1979). Case 1 presented earlier is part of a pair of a choice problem
representing the revised version of Allais Paradox. The complementary choice problem is
depicted on Figure 2.3. Using the revised hypothetical choice problem, Kahneman and Tversky
(1979) conducted a study and found that the majority of subjects chose B in Case 1 (see Figure
2.1) and C in Case 2 (Figure 2.3). Analysis of individual choices indicated that a majority of
respondents made decision consistent to the pattern. Both cases can be re-presented as follow:
10
2,500
Prob. 0.33
0
0.67
C
D
2,400
Prob. 0.34
0
0.66
Case 1: U(2400) > 0.33 x U(2500) + 0.66 x U(2400) 0.34 x U(2400) > 0.33 x U(2500)
Case 2: 0.34 x U(2400) < 0.33 x U(2500)
Case 1 and Case 2 show inconsistency of preference of the decision makers from a
perspective of UT. Choosing prospect B in Case 1 and C in Case 2 is in the contrary to UT
because it is not possible for a rational decision makers to switch alternatives in two “identical”
subsequent choice problems.
Case 2
Figure 2.3 Case 2 of a Revised Version of Allais Paradox (Kahneman and Tversky 1979)
The results of Allais Paradox and other relevant studies indicated that UT was unable to
describe the actual behavior of decision makers under uncertainty in many occasions. The
majority of decision makers violate axioms of UT and consequently they do not behave rationally.
Hence while the role of UT as a prescriptive model prevails, its descriptive position becomes
questionable (Levy, 1997).
2.2 Prospect Theory (PT) as a Descriptive Model
Kahneman and Tversky (1979), proposed Prospect Theory (PT) as an alternative to UT for a
descriptive model of human decisions under uncertainty. Propositions of PT is consistent to the
bounded rational model of human by Simon (1957). Simon (1957) suggested that while human
intends to be rational, the rationality is constrained or bounded. Hence it is argued that deliberate
thinking is not common by most people; people tend to rely on simplified rules (heuristics) and
consider particular mental concepts which come more easily to mind (accessibility) when making
decisions (Kahneman, 2002). For PT, the central argument is that differences of possible
11
additional
wealth
value
Risk
seeker
Risk
averse
loss
gain
outcomes against natural reference points are more accessible than the absolute values – a
conjecture which is consistent to the bounded rational model. Hence risky decision according to
PT is reference-dependent.
Grounded to experimental studies of hypothetical choice problems, Kahneman and Tversky
found that majority of subjects of the study did not behave rationally as suggested by UT. The
pattern of departure from rationality was found to be systematic for most subjects and was
formulized in some propositions. Main propositions of Prospect Theory include framing and loss
aversion to be described in the followings passages.
2.2.1 Framing
According to PT, the behavior of decision makers indicated by the chosen prospect depends
on the way the choice problems are presented (i.e. problem framing). Most people will
systematically become risk averse when the problem is framed as a gain. When the identical
problems are presented as a loss, most decision makers tend to be risk seeking agents (Kahneman
and Tversky 1979). It is argued that, in line with the accessibility concept described earlier, a
different presentation of risky choice problems would evoke different features of the problem to
the decision makers‟ mind and mask the others leading to a different risk attitude. Figure 2.4
shows an S-shaped subjective value or utility function according to PT.
Figure 2.4 Value Function of Prospect Theory
12
Framing effect can be seen as a direct violation to the invariance axiom of UT (Kahneman
and Tversky 1984; Clemen and Reilly 2001). Invariance, according to UT, refers to a notion that
the only information required by decision makers to make a choice is the probabilities and
associated pay-offs for the prospects. In the study conducted by Kahneman and Tversky (1979) it
was found among other things that despites the identical information of „probabilities‟ and „pay-
offs‟ imposed in the choice problems, subjects behaved differently depending on the way the
problem was presented. Empirical evidence to support „framing effect‟ is numerous. For instance,
Qualls and Puto (1989) conducted a questionnaire-based study to examine behavior of industrial
buyers in fleet companies. Results of the study supported the framing effect.
Scholars have extended the concept of framing beyond „the way the problem is presented‟.
Decision makers utilize subjective framing inherent to his or her decision process even though the
problem at hand is not explicitly framed in a particular way. In an experimental study by Elliot
and Archibald (1989), a choice problem of medical treatment was neutrally presented to subjects.
No particular gain (survival rates) or loss (mortality rates) was explicitly imposed in the problem.
After selecting the preferred prospect, subjects were asked to explain on how they had actually
framed the problem. The result supported the notion that subjects who had subjectively framed
the problem as a gain tend to be risk averse and those who had framed it as a loss tend to be risk
seeking.
Decision makers seem to utilize a certain mental reference point or status quo by which the
possible outcomes of the alternatives are gauged. In a monetary term, the evaluation of outcomes
of prospects are not based on the final state of the wealth (i.e. existing wealth of the decision
makers plus or minus the respective prospect outcome) as suggested by UT. Instead, the outcomes
are judged against the reference point. For instance, if the amount of wealth of prospects is lower
than the mental reference point, they will perceive the problem in a loss domain and tend to
behave as risk seekers. On the contrary, if the amount of outcomes is higher than the reference
point, the problem is seen in the domain of gain and they become risk averse.
13
Decision makers do not use a common, universal frame to see a risky choice. Subjective
frame can be related to norms, habits, expectancies of the decision makers (Tversky and
Kahneman 1986), as well as organizational climates (Qualls and Puto 1989). The selection of the
reference point (which in some cases is done unconsciously) is crucial to the framing and
eventually the risk preference of the decision makers (Bazerman 1998).
2.2.2 Loss Aversion
PT recognizes that the degree of satisfaction gained by an additional wealth is not the same as
the degree of dissatisfaction perceived due to decrease of equal amount of wealth. Most people
respond to losses in a more significant way than to gains; they are loss averse (Bazerman 1998).
For instance, people tend to refuse a fair bet since the negative value of the expected utility of the
possible loss is greater than the positive value of expected utility from the possible gain (Tversky
and Kahneman 1981). Loss aversion is depicted in Figure 5.4a by a steeper slope of the curve in
the domain of loss. Empirical evidence of individual-level decision making to support Loss
Aversion from an environmental context is presented by Gregory (1986). In a corporate strategic
management context, Fiegenbaum (1990a) by analyzing secondary data found that, among other
things, some evidence to support loss aversion did exist.
In summary, it is argued that PT is a generalization of UT (Edwards 1996). The relationships
between parameters which are used by the two theories are depicted on Table 2.1. UT
normatively uses outcome probabilities of a prospect as weighting factors, while in reality most
decision makers use decision weights. Decision weight in PT is a non-linear function of
probability. Degree of satisfaction in UT is related to the total accumulated wealth by choosing a
prospect. PT asserts that it is related to the change of wealth viewed from a reference point.
Finally, alternatives are normatively evaluated by means of maximum expected utility in UT. On
the other hand, UT argues that in reality decision makers‟ decision will depend on the problem
framing.
14
Table 2.1 Comparison between Expected Utility Theory and Prospect Theory
Parameter
Utility Theory
Prospect Theory
Weighting factor
Probability, p
Decision weight, π=f(p)
Degree of satisfaction
Utility, u = f(x)
x is accumulated wealth
Value, v = f(x)
x is change of wealth against a reference point
Overall value of a prospect
Expected Utility
= ∑ p.u
Expected Value
= ∑ π.v
2.3 Prescriptive and Descriptive: the Two Research Camps
From the previous discussions some essential points with regards to the studies in human
decision making could be summarized as follows. The decision making field of study could be
classified into two camps, namely: prescriptive and descriptive decision theory school of thoughts
(Bazerman, 1998). The two camps differ in research paradigms or worldviews, ultimate goals,
and assumptions as follows.
The ultimate goal of studies under the prescriptive school of thought is to develop
methods or tools to assist decision making process. Prescriptive studies assume that due to the
complexity of decision problems, it is essential to equip decision makers with certain tools. As the
name suggests, the tool should have feature(s) to prescribe or provide suggestion to an optimal
decision.
Models which are developed under this category reflect the normative, ideal condition of
decision making process provided that all assumptions are satisfied. A major assumption
commonly applied in the models is that human is a fully rational decision maker in the sense that
he or she has self-interest to maximize his or her own well-being. The rational tools provide
prescriptions on “how a decision should be made rather than describing how decision is made”
(Bazerman, 1998, p. 4, original emphasis). The prescriptive camp would also acknowledge that
final decisions are up to the decision makers to make because the tools are not intended to replace
the role of decision makers.
15
Researchers under the descriptive decision theory school of thought would develop their
works based on an underlying assumption that human rationality is bounded (Bazerman, 1998;
Simon, 1957). It was argued in Bazerman (1998) that, in the real world, a full rationality of
human decision process is not feasible due to: (a) lack of complete relevant information for
problem definition (b) time and cost constraints to acquire information (c) memory limitation of
the decision makers to retain useful information, and (d) cognitive limitation to fully analyze all
possible alternatives and to calculate the optimal choice.
For descriptive researchers, decision makers are seen to be satisficing (i.e. satisfying and
sufficing) rather than optimizing. That is, a good enough decision is adequate for bounded
decision makers. Instead of fully incorporating all relevant information and making a systematic
decision process to maximize own preferences, bounded decision makers are assumed to utilize
heuristics or rule of thumbs (Tversky and Kahneman, 1974). Heuristics serve as a mental shortcut
to find an acceptable (instead of optimal) solution in the face of limited information and cognitive
capability. Heuristics are simplified strategies to make faster decisions with less cognitive efforts
to deal with everyday‟s complex decisions (Shu and Bazerman, 2010). Scholars in the descriptive
stream argued that while heuristics in many cases are useful, the process is prone to human errors
(Tversky and Kahneman, 1974). Researchers in cognitive psychology have identified various
systematic errors in judgment (i.e. biases) both in deterministic and stochastic environment (Mak
and Raftery, 1992; Tversky and Kahneman, 1974). In other words, bounded rationality and hence
heuristics, in some occasions, may lead to decisions which depart from rationality.
For descriptive researchers, the goal of carrying out research is to understand the actual
behavior of the decision makers and to compare the actual behavior to an ideal, rational behavior.
If systematic judgmental deviations in certain circumstances are observed, strategies to minimize
biases or departures from rationality can be developed, for instance: de-biasing (Bazerman, 1998).
For another example, a similar method had been applied for project cost estimating by using an
approach called „outsider view‟ to minimize the identified optimistic bias (Flyvbjerg, 2003; 2006;
Flyvbjerg et al., 2004a; Flyvbjerg et al., 2004b; 2005; Flyvbjerg et al., 2002; Lovallo and
Kahneman, 2003).