Role of sonic hedgehog signalling in human embryonic stem cells and its neural derivatives
Bạn đang xem bản rút gọn của tài liệu. Xem và tải ngay bản đầy đủ của tài liệu tại đây (2.63 MB, 178 trang )
ROLE OF SONIC HEDGEHOG SIGNALING IN HUMAN
EMBRYONIC STEM CELLS AND ITS NEURAL DERIVATIVES
WU MEIYUN SELENA
BSc (Hons) Clinical Science, King’s College London, UK
A THESIS SUBMITTED
FOR THE DEGREE OF DOCTOR OF PHILOSOPHY
NUS Graduate School for Integrative Sciences and Engineering
NATIONAL UNIVERSITY OF SINGAPORE
2010
i
ACKNOWLEDGEMENTS
Looking back on the past 4 years of this PhD journey, I am extremely appreciative of
the fact that the completion of this thesis would not have been possible without the support
from many people. Hence, I would like to offer my humble and sincere thanks to:
Prof Miranda Yap, for taking me as your student. Thank you for always asking the
hard questions to make me think and for always being supportive of my work. Your care and
concern for all of us PhD students is heartfelt.
Dr Ken Chan, my supervisor and mentor, for patiently teaching and guiding me
tirelessly throughout the past 4 years. I would not have come so far without you. Your
brilliance inspires me and I hope that one day I can be as good a scientist as you are!
Prof Edward Manser, my thesis advisory committee member, for critically reviewing
my work each time we meet.
Dr Andre Choo, the best PI that anyone can ask for. Thanks for always taking the
time to meet with me and providing scientific and practical advice.
Dr Valerie Ng, my mentor and dearest friend in the lab. I’ll always remember the
crazy things we’ve done together. You have taught me so much and I’m grateful that you’ve
always been a listening ear and an encouraging voice.
My collaborators, Stanley and Hock Chuan, for the pleasant partnership and patiently
imparting your domain knowledge to this bioinformatics newbie.
Vanessa, my fellow classmate. Going through this journey together made the good
times more fun and the bad times more bearable.
The Stem Cell group for being such great lab mates, especially Ker Sin, my lunch
buddy, for being such a joy to work with and someone that I can always count on; Thian
Thian and Julien for being such helpful team mates; Wenyu, for your friendship and being so
ready to help me out each time; Louisa, my sweet cubby mate; Angela and Jayanthi for
ii
running the lab so smoothly and my students Huizi, Huishan, Su Fung, Huiling, Jin Ju and
Lydia for your helping hands.
The administrative staff in BTI who are so efficient and are responsible for making
BTI such a special place to work in.
My AGS seniors: Linda, you’re an angel for reading this manuscript; Sebastian,
Dave, Pauline, Sandy, Andy and other seniors for sharing with me your experiences and
giving me invaluable tips and advice on how to survive a PhD!
Grace, April, Eunice, TSG, cell group members from CEFC and friends who have
been praying for me and cheering me on.
The most special people in my life, Mum, Dad and Sam, for your unfailing love and
confidence in me. Mum and Dad, I am so blessed to have parents that pray for me daily
And finally, to my husband Stephen. Words cannot express my immense gratitude
for your faithful love and support that gave me the strength to complete this journey. Thank
you for walking each step of the way with me and taking such good care of me during the last
three months. I love you.
This thesis is dedicated to my Lord and Saviour, Jesus Christ, who blessed me with
this opportunity to do a PhD and provided me with all that I needed complete it. To whom all
praise, honour and glory belong.
.
iii
TABLE OF CONTENTS
ACKNOWLEDGEMENTS i!
TABLE OF CONTENTS iii!
SUMMARY viii!
LIST OF TABLES ix!
LIST OF FIGURES xi!
CHAPTER 1! INTRODUCTION 1!
1.1! Background 1!
1.2! Motivation 2!
1.3! Objectives 3!
1.4! Organization 3!
CHAPTER 2! LITERATURE REVIEW 4!
2.1! Overview of SHH signaling pathway 4!
2.2! SHH processing, pathway components and signal transduction 4!
2.2.1! SHH processing 4!
2.2.2! SHH pathway components 5!
2.2.3! SHH signal transduction 7!
2.3! SHH in embryogenesis 9!
2.4! SHH and neural development 10!
iv
2.5! SHH and proliferation 14!
2.6! SHH in developmental disorders and cancer 15!
2.7! Embryonic stem cells and induced pluripotent stem cells 16!
2.8! Culture of hESC 18!
2.9! Signaling pathways in hESC 19!
2.10! Transcriptional networks in hESC 21!
2.11! Applications of hESC research 22!
2.12! Neural differentiation of hESC 24!
2.12.1! Neural induction 25!
2.12.2! Neural subtype specification 26!
CHAPTER 3! MATERIALS AND METHODS 31!
3.1! Molecular cloning 31!
3.1.1! Cloning 31!
3.1.2! Plasmids 32!
3.2! Cell Culture 32!
3.2.1! Immortalized mouse fibroblasts 32!
3.2.2! Preparation of conditioned media from !E-MEFs 33!
3.2.3! Human embryonic stem cells and induced pluripotent stem cells 33!
3.2.4! Embryoid body formation 33!
3.2.5! Generation of stable cell lines 34!
3.2.6! Neurosphere formation 34!
3.2.7! Neural differentiation 35!
3.2.8! SHH conditioned media production 35!
3.2.9! Transfection 36!
v
3.2.10! Electrophysiology recording 36!
3.3! Transcriptional profiling 37!
3.3.1! RNA extraction 37!
3.3.2! Reverse transcription, polymerase chain reaction (PCR) and quantitative real-
time PCR analysis 38!
3.3.3! DNA microarray 41!
3.3.4! Microarray data analysis 42!
3.3.5! In silico analysis of GLI binding sites 43!
3.4! Protein and biochemical assays 43!
3.4.1! Immunocytochemistry 43!
3.4.2! Western blot 45!
3.4.3! Flow cytometry analysis 46!
3.4.4! Luciferase reporter assay 47!
3.4.5! Cell proliferation assay 48!
3.4.6! Apoptosis assay 48!
3.4.7! Cell count 48!
3.5! Statistics 49!
CHAPTER 4! ROLE OF SHH IN UNDIFFERENTIATED hESC 50!
4.1! INTRODUCTION 50!
4.2! Expression of SHH signaling pathway components 51!
4.3! Activation of SHH signaling in undifferentiated hESC and role of GLI mediators
53!
4.4! Effect of SHH on hESC pluripotency and proliferation 54!
4.5! Activation of SHH signaling in hESC during differentiation 58!
vi
4.6! SHH signaling influences lineage determination during spontaneous
differentiation 62!
4.7! Summary 64!
CHAPTER 5! ROLE OF SHH IN NEURAL DIFFERENTIATION 66!
5.1! Introduction 66!
5.2! Noggin treatment induces neural differentiation 66!
5.3! Neuroprogenitors possess cilia 72!
5.4! Overexpression of SHH in hESC 74!
5.5! Overexpression of SHH enhances neural induction 76!
5.6! Overexpression of SHH increases the proliferation of sorted neuroprogenitors 79!
5.7! Overexpression of SHH leads to increase in DA neurons 81!
5.8! Summary 84!
CHAPTER 6! IDENTIFICATION OF SHH TARGET GENES IN
NEUROPROGENITORS 86!
6.1! Introduction 86!
6.2! Microarray Analysis 87!
6.3! Validation of differentially expressed genes (DEG) 90!
6.4! In silico analysis of potential GLI binding sites on DEG 93!
6.5! Transcriptional activation of target gene promoters by SHH 95!
6.6! SHH target genes discussion 98!
6.6.1! Differentially expressed genes (DEG) 100!
6.6.2! Neural induction 100!
vii
6.6.3! Neuroprogenitor proliferation 101!
6.6.4! Dorsal-ventral patterning 103!
6.6.5! Dopaminergic neuron development and function 104!
6.6.6! Axon guidance 105!
6.6.7! Neural development 106!
6.7! Summary 109!
CHAPTER 7! CONCLUSIONS AND RECOMMENDATIONS 110!
7.1! Conclusions 110!
7.2! Recommendations for future research 112!
7.2.1! Loss of function study 112!
7.2.2! Cross-talk between NOTCH and SHH signaling pathways 112!
7.2.3! Exploration of novel target genes 113!
7.2.4! MicroRNA and SHH signaling 114!
ABBREVIATIONS 115!
BIBLIOGRAPHY 117!
APPENDIX A MICROARRAY DATA 139!
APPENDIX B GLI BINDING SITES ANALYSIS 148!
APPENDIX C PUBLICATIONS 161!
viii
SUMMARY
Human embryonic stem cells (hESC) are pluripotent stem cells that have the unique
ability to differentiate into cells of the three germ line lineages. Hence, they have wide
potential to be used in cell replacement therapy and drug discovery. To realize the clinical
potential of hESC, a deeper understanding of the molecular and cellular mechanism
underlying their unique capacity for self-renewal and differentiation is required. This thesis is
focused on the role of the Sonic Hedgehog (SHH) signaling pathway, a key pathway essential
for the normal development of mammals. By testing the requirement of SHH in
undifferentiated hESC cultures, it was revealed that exogenous SHH was not able to maintain
the pluripotency or increase the proliferation of hESC. Instead, the SHH pathway was
activated upon differentiation and exogenous SHH promoted differentiation to the
neuroectoderm lineage. Using a defined neural differentiation protocol, it was found that
overexpression of SHH in hESC resulted in a significant increase in neural stem cell marker
expression as well as increased proliferation of neuroprogenitors. This demonstrated that
SHH enhanced the neural induction and expansion of neuroprogenitors, which resulted in an
increased yield of dopaminergic neurons derived from the neuroprogenitors. Transcriptional
profiling of overexpressing SHH neuroprogenitors and in silico GLI DNA-binding site
analysis identified putative direct and biologically relevant target genes of the SHH pathway.
It also revealed an extensive network of genes involved in neural development,
neuroprogenitor proliferation, neural specification and axon guidance. Therefore, this thesis
contributes to the understanding of SHH signaling in hESC self-renewal and differentiation
and provides a comprehensive view of the SHH transcriptional network in hESC-derived
neuroprogenitors.
ix
LIST OF TABLES
Table 2.1 Summary of DA differentiation from hESC. 29!
Table 3.1 List of primers used in RT-PCR 38!
Table 3.2 List of primers used for real-time PCR 39!
Table 3.3 List of antibodies used for immunocytochemistry 43!
Table 3.4 List of antibodies used for Western blot analysis 45!
Table 3.5 List of antibodies used for flow cytometry analysis 46!
Table 6.1 List of top 20 significantly upregulated genes in SHH-NP. Genes are ranked
according to their fold change values. 88!
Table 6.2 List of top 20 significantly downregulated genes in SHH-NP. Genes are
ranked according to their fold change values. 88!
Table 6.3 List of SHH upregulated genes that have 6 or more putative GLI binding sites
in the 5’ promoter region. The number of binding sites were located 5 kb upstream of
the transcription start site. The genomic coordinates and GLI binding start site(s) are
on the NCBI36 (March 2006) Human Genome Assembly. Chr = chromosome, 1 =
positive strand, -1 = negative strand of DNA 94!
Table 6.4 List of SHH upregulated genes that have 6 or more putative GLI binding sites
in the 3’ downstream region. The number of binding sites were located 5 kb upstream
of the transcription start site. The genomic coordinates and GLI binding start site(s) are
on the NCBI36 (March 2006) Human Genome Assembly. Chr = chromosome, 1 =
positive strand, -1 = negative strand of DNA 95!
Table 6.5 Promoter-luciferase plasmids containing GLI binding sites on selected SHH
target genes. Promoter coordinates refer to the genomic coordinates of the promoter
sequences present in the Switchgear luciferase plasmids. The GLI binding site refers to
starting genomic position of which GLI binding motif is found on. Coordinates are from
the March 2006 Human Genome Assembly. Chr = chromosome 96!
Table 6.6 Summary of target genes of SHH in hESC-derived neuroprogenitors 99!
x
Table A 1 List of significantly upregulated genes (> 1.5-fold) in SHH-NP. Genes are
ranked according to their fold change values. 139!
Table A 2 List of significantly downregulated genes (>1.5-fold) in SHH-NP. Genes are
ranked according to their fold change values. 144!
Table B 1 List of SHH upregulated genes that have putative GLI binding sites within 5
kb of the 5’ upstream region from the transcriptional start site. 148!
Table B 2 List of SHH upregulated genes that have putative GLI binding sites within 5
kb of the 3’ downstream region from the transcriptional start site. 152!
Table B 3 List of SHH downregulated genes with putative GLI binding sites within 5 kb
of the 5’ upstream region from the transcriptional start site 155!
Table B 4 List of SHH downregulated genes with putative GLI binding sites within 5 kb
of the 3’ downstream region from the transcriptional start site.tart 158!
xi
LIST OF FIGURES
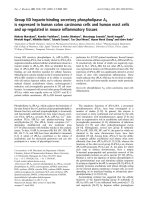
Figure 2.1 Processing of the Shh full-length protein to form the Shh-N signaling peptide. 5!
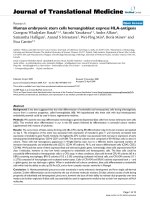
Figure 2.2 Shh signaling pathway. In the absence of the Shh ligand, Ptch1 inhibits Smo
activity by preventing its accumulation at the cilia. In this state the Gli3 transcription
factor is cleaved to a repressor form and translocates to the nucleus to repress
transcription. In the presence of Shh, Ptch1 moves away from the cilia and Smo moves
to the cilia, possibly with the help of intraflagellar transport (IFT) proteins. Gli2 and
Gli3 are no longer cleaved and the full length Gli activator translocates to the nucleus to
initiate transcription of target genes, e.g. Ptch1 and Gli1. Hhip, Gas1 and Cdo are
membrane proteins that bind to the Shh ligand to help regulate the Shh signal. This
figure was modified from Simpson et al., 2009. 8!
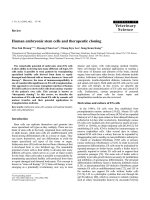
Figure 2.3 Expression of Shh during development. Whole-mount in-situ hybridization of
Shh in E9.5 days post coitum mouse embryo showing (A) the cross section of the spinal
cord (dotted line ’) showing Shh expression in the notochord (arrow head) and floor
plate above. (B) The expression of Shh in the floor plate throughout the neural tube.
Labeled are the subdivisions along the rostral-caudal axis of the forebrain, midbrain,
hindbrain and the spinal cord. This figure was reproduced from Epstein et al., 1999 10!
Figure 2.4 Formation of the neural tube. (A) During neural induction, the neural plate
is flanked by the non-neural ectoderm. The notochord (N) lies below the neural plate.
(B) The neural plate folds up upon itself plate and fuses to form the neural tube. The
underlying notochord secretes SHH which is necessary for the formation of the floor
plate (F). The non-neural ectoderm eventually forms the epidermis. The arrows indicate
the dorsal-ventral axis of the neural tube. This figure was modified from Briscoe et al.,
1999 11!
Figure 2.5 A model for how Shh patterns neurons of distinct cell fate in the spinal cord.
Shh from the floor plate diffuses dorsally to establish a concentration gradient. The
neural tube is divided into distinct progenitor domains (p0-3, pMN) that generate
distinct neuronal subtypes: interneurons V0-V3 and motor neurons (MN). The
progenitor domains are characterized by transcription factors that are broadly
grouped into Class I and II genes. Shh induces the Class I genes Nkx6-1, Nkx2-2 and
Olig2, which are more ventrally expressed. The Class I genes Dbx1, Dbx2, Irx3 and
Pax6 are dorsally expressed and repressed by SHH. 13!
Figure 2.6 Human embryonic stem cells (hESC) derived from the blastocyst are able to
differentiate into cells from each germ layer. This figure was modified from Hyslop et
al., 2005b 17!
Figure 2.7 Signaling pathways maintaining hESC self-renewal. The WNT ligand binds
to the Frizzled receptor which allows !-Catenin to translocate to the nucleus and
activate transcription. FGF2 binds to the FGF receptors (FGFR) and activates the
PI3K/Akt and MAP kinase pathways. IGF2 secreted from feeder cells binds to the IGF1
receptor (IGFR1) and activates the PI3K/Akt pathway as well. Activin/Nodal/TGF!
xii
belong to the TGF superfamily of proteins and signal via the Type I (ALK 4/5/7) and
Type II receptors that form heterodimers, which subsequently activates SMAD2/3.
BMP signalling signals via the Type I (ALK 1/2/3/6) receptors and activates SMAD1/5/8
to promote differentiation. 21!
Figure 3.1 Schematic illustration of constructs for generating stable hESC lines. Top:
pCHEF-IRES-DsRed2 containing the Shh transgene with DsRed2 reporter gene driven
by CHEF promoter. Bottom: Control vector with only DsRed2 reporter gene. CHEF =
chinese hamster elongation factor-1", IRES = internal ribosome entry site. 31!
Figure 3.2 Summary of neural differentiation protocol. 35!
Figure 4.1 hESC express SHH pathway components. (A-D) Representative images
showing immunoflourescent staining of (A) PTCH1, (B) SMO, (C) GLI1, (D) GLI3.
Middle panel shows corresponding DAPI nuclear staining in blue and right panel shows
corresponding merged images. Scale bars represent 100 µm. 51!
Figure 4.2 Embryoid bodies (EB) express SHH pathway components. RT-PCR analysis
of SHH signaling pathway components in undifferentiated hESC and differentiating EB
over 14 days. EB were grown in differentiation media in suspension and harvested at
indicated time points. 52!
Figure 4.3 GLI mediators are functional in undifferentiated hESC. (A) Schematic of
8xGli-BS reporter plasmid. (B-D) Luciferase activity of 8XGli-BS luciferase reporter
plasmid. (B) hESC were transiently transfected with 8XGli-BS or 8XmutGli-BS
luciferase reporter plasmid together with the indicated expression vectors encoding
GLI1, GLI2 and GLI3. (C-D) The 8XGli-BS luciferase reporter plasmid and GLI1
expression vector were co-transfected with increasing concentrations of (C) GLI3 and
(D) SUFU expression vectors as indicated. Luciferase activities were calculated as a
ratio of Firefly luciferase activity over Renilla luciferase activity and expressed as fold
induction relative to vector control. Values shown are mean ± SD of a representative
experiment carried out in triplicate and repeated at least three times. 54!
Figure 4.4 Exogenous SHH does not affect pluripotency. (A) FACS analysis of TRA-1-
60 positive cells and (B) Real-time PCR analysis of pluripotent markers OCT4 and
NANOG expression in hESC maintained in conditioned media (CM), CM supplemented
with 1 µg/ml SHH (CM+SHH), CM without FGF2 (CM – FGF2) or CM without FGF2
supplemented with 1 µg/ml SHH (CM–FGF2+SHH) over two passages. The expression
level of each gene is shown relative to undifferentiated hESC maintained in CM, which
was arbitrarily defined as 1 unit. The values shown are mean ± SD of a representative
experiment performed in triplicate and repeated three times. * = p<0.05, ns = non-
significant. 55!
Figure 4.5 Exogenous SHH does not affect proliferation of hESC. Flow cytometry
analysis of EdU incorporation assay in undifferentiated hESC. Cells were synchronized
with nocodazole for 16 hours and then treated with or without 1 µg/ml SHH for 24
hours. Representative dot plots of biological triplicates showing EdU incorporation in
hESC co-stained for OCT4. This experiment was repeated three times 56!
xiii
Figure 4.6 Exogenous SHH does not affect survival of hESC. Flow cytometry analysis
of Annexin V apoptosis assay in undifferentiated hESC whereby cells were treated with
or without 1 µg/ml SHH for 24 hours prior to assay. Representative dot plots showing
apoptotic cells (Annexin V positive and PI negative) from biological triplicates and
experiment repeated thrice 57!
Figure 4.7 Activation of SHH signaling by endogenous SHH. (A) Quantitative Real-time
PCR analysis of target gene PTCH1 and GLI1 and pluripotent markers OCT4 and
NANOG expression in hESC maintained in conditioned media (CM), or induced to
differentiate with differentiation media (DM) or DM supplemented 5 µM RA (DM+5
µM RA) for 48 hours. Gene expression is expressed relative to hESC in CM condition.
(B) Luciferase activity of the 8XGli-BS luciferase reporter plasmid, which was
transfected into hESC and cultured similar conditions as above. Cells were treated with
the vehicle control (DMSO/ Ethanol) or pathway inhibitors 10 #M cyclopamine and 50
#M forskolin. Cells were assayed for luciferase activity 48 hours post transfection.
Luciferase activities were calculated as a ratio of Firefly luciferase activity over Renilla
luciferase activity and expressed as fold induction relative to vehicle or vector control.
Values shown are mean ± SD of a representative experiment carried out in triplicate
and repeated at least three times. *, p<0.05. 59!
Figure 4.8 Activation of SHH signaling by exogenous SHH. The SHH expression vector
was co-transfected with the 8XGli-BS luciferase reporter plasmid in the absence
(vehicle-DMSO) or presence of 10 #M cyclopamine. GLI1 was overexpressed as a
positive control. Luciferase activities were calculated as a ratio of Firefly luciferase
activity over Renilla luciferase activity and expressed as fold induction relative to
vehicle or vector control. Values shown are mean ± SD of a representative experiment
carried out in triplicate and repeated at least three times. * = p<0.05 61!
Figure 4.9 Neuroectoderm markers expression are upregulated in EB after 14 days
exposure to SHH. (A-C) EB were grown in SHH-CM or Control-CM suspension culture
for 14 days and mRNA expression was analyzed by real time PCR to determine the
expression of (A) SHH target genes, (B) neuroectoderm, (C) mesoderm and endoderm
markers. Gene expression is expressed relative to undifferentiated hESC. Values shown
are mean ± SD of a representative experiment carried out in triplicate and repeated at
least three times. * = p<0.05 , compared to Control-CM treated EB. ns = non-
significant. 63!
Figure 4.10 Immunoflourescent staining of neural stem cell marker Nestin in SHH-CM
and Control-CM treated EB. Middle panel shows corresponding DAPI nuclear staining
in blue and right panel shows corresponding merged images. Scale bars represent 50
µm. 64!
Figure 5.1 Noggin induced neural differentiation. Replated EB were treated for 10 days
with noggin and compact clumps were formed that were (A) immunopositive for PAX6.
The middle panel shows corresponding bright field image. (B) Bright field micrograph
of typical neurospheres in culture. Scale bars represent 100 µm. 67!
Figure 5.2 Neuroprogenitors express neuroectoderm markers. Neurospheres were
harvested after 7 days in culture and mRNA expression was analyzed by real-time PCR
xiv
analysis for (A) neuroectoderm markers and OCT4 in neuroprogenitors and (B)
mesoderm and endoderm markers in undifferentiated hESC (HESC), 14-day-old
embryoid bodies (14D EB) and neuroprogenitors (NP). The expression level of each
gene is shown relative to undifferentiated hESC, which was arbitrarily defined as 1 unit.
The values shown are mean ± SD of a representative experiment carried out in triplicate
and repeated twice. In (A), the line represents expression levels of each gene in
undifferentiated hESC. 68!
Figure 5.3 Neuroprogenitors express NSC markers. (A) Flow cytometry analysis of
neuroprogenitors expressing A2B5, FORSE-1, p75, PSA-NCAM and CD133. The
shaded histogram represents staining with the negative control and open histograms
represent staining with the respective antibodies. (B-D) Representative images showing
immunofluorescent staining of (B) PAX6, (C) NESTIN and (D) SOX1 on
neuroprogenitors that were replated onto laminin-coated wells. Nuclei were stained
with DAPI. Scale bars represent 50 µm. 69!
Figure 5.4 Neuroprogenitors are able to differentiate into astrocytes and functional
mature neurons. (A-B) Immunocytochemistry was performed to detect (A) TH (red)
and MAP2 (green) positive neurons and (B) !-III Tubulin (green) and GFAP (red)
positive astrocytes. Scale bars represent 100 #m. (C) Patch clamp recordings show
spontaneous postsynaptic currents. 71!
Figure 5.5 SHH is essential for the specification of DA neurons from neuroprogenitors.
(A) Representative images showing immunofluorescent staining of TH (red) and !-
Tubulin III (green) positive cells. Nuclei were stained with DAPI. Scale bars represent
50 µm. (B) Quantification of the above images. TH+ nuclei were counted and expressed
as a percentage of the total DAPI positive cells. Numbers presented represent the
average percentage ± SD from triplicate samples. * = p<0.05. 72!
Figure 5.6 The SMO receptor localizes to primary cilia of neuroprogenitors. (A-C)
Representative confocal images showing immunocytochemistry of (A) undifferentiated
hESC with acetylated tubulin (AcTb), pluripotent marker OCT4, and corresponding
merged images. (B) Neuroprogenitors were similarly probed for AcTb and the
neuroectoderm marker NESTIN (green, middle panel). (C) Neuroprogenitors were
stimulated with 200 ng/ml SHH for 24 - 48 hours and stained for AcTb and the SMO
receptor (green, middle panel). The arrow points to SMO which localizes to the base of
the primary cilia. Scale bars represent 10 µm. 73!
Figure 5.7 SHH pathway is activated in neuroprogenitors. Real-time PCR analysis of
genes PTCH1 and SMO in neuroprogenitors (NP). Values are expressed relative to
undifferentiated hESC and are mean ± SD of a representative experiment performed in
triplicate and repeated twice. * =p <0.05 74!
Figure 5.8 Stable overexpressing-SHH hESC express SHH and DsRed. (A)
Representative image of a typical overexpressing-SHH hESC colony maintained in
pluripotent conditions showing immunocytochemistry for SHH. (B) Corresponding
fluorescent image of DsRed2 and (C) merged images. Scale bar represents 100 µm. 75!
xv
Figure 5.9 SHH-NP express the DsRed2 protein. Fluorescent image of SHH-NP and
corresponding bright field image. Scale bars represent 50 µm 76!
Figure 5.10 Overexpression of SHH in hESC-derived neuroprogenitors. (A) Western
blot analysis of SHH-NP, Vector-NP and H3-NP probed with the anti-SHH antibody
which detected both the full length (45 kDa) and 19 kDa active fragment. Actin was
used as a loading control. (B) Real-time PCR analysis of SHH and target genes PTCH1
and GLI1 in SHH-NP, Vector-NP and H3-NP. The expression value of each gene is
shown relative to H3-NP, which was arbitrarily defined as 1. The values are mean ± SD
of a representative experiment performed in triplicate and repeated thrice. * = p< 0.05. 77!
Figure 5.11 Overexpression of SHH in hESC-derived neuroprogenitors lead to
increased expression of neuroectoderm markers. (A) Real-time PCR analysis of
neuroprogenitors for neuroectoderm markers. The expression value of each gene is
shown relative to H3-NP, which was arbitrarily defined as 1. The values are mean ± SD
of a representative experiment performed in triplicate and repeated thrice. * = p< 0.05
(B) Western blot of neuroprogenitors probed with SOX1 and NESTIN antibodies with
ACTIN as a loading control. Values indicate quantification of protein based on the band
intensities from the Western blot normalized to Actin using LI-COR Odyssey software. 78!
Figure 5.12 Overexpression of SHH in hESC-derived neuroprogenitors lead to
increased expression NSC surface markers. Histogram representation of FACS analysis
of CD133, A2B5 and p75 showing percentage positive cells. * = p<0.05. All values shown
are mean ± SD of a representative experiment performed in triplicate and repeated
thrice. 79!
Figure 5.13 Overexpression of SHH results in increase proliferation of multipotent
p75+/PSA-CAM+ neuroprogenitors. (A) 1x10
5
sorted cells were seeded into 24-well
ultra-low suspension plates and neurospheres formed after 3-5 days. Cells were
harvested 7 and 14 days after and counted by trypan blue exclusion. * =p <0.05. All
values shown are mean ± SD of a representative experiment performed in triplicate and
repeated thrice. 80!
Figure 5.14 Overexpression of SHH in hESC-derived neuroprognitors leads to an
increase in TH+ neurons. (A) Immunofluorescent images of SHH-NN, Vector-NN and
H3-NN differentiated neuroprogenitors stained for TH (purple) and !-Tubulin III
(green). Nuclei are stained by DAPI. Scale bars represent 100 µm. These are
representative images of an experiment repeated four times with similar results. (B)
Quantification of the above images. TH+ nuclei were counted and expressed as a
percentage of the total !-Tubulin III positive cells. Numbers presented represent the
average percentage ± SD from triplicate samples. * = p<0.05. 83!
Figure 5.15 Neurons express dopaminergic neuron marker genes. Real-time PCR
analysis of DA neurons. The expression value of each gene is shown relative to H3-NN,
which was arbitrarily defined as 1. The values are mean ± SD of a representative
experiment performed in triplicate and repeated thrice. * = p< 0.05 83!
xvi
Figure 6.1 Analysis of SHH-NP expression profiling. (A) Microarray gene expression
heat map comparing SHH-NP with H3-NP and Vector-NP showing top 20 upregulated
and downregulated genes. Shades of red denotes upregulation while shades of green
denote downregulation. (B) Upregulated genes were classified into categories by Gene
ontology Biological Processes terms and ranked according to false discovery rates in
ascending order. Frequencies of upregulated genes in each category are shown as
percentages 90!
Figure 6.2 Known SHH target genes identified by microarray profiling were validated
by real-time PCR. RNA for the microarray study was re-probed by real-time PCR
analysis. The expression value of each gene is shown relative to H3-NP, which was
arbitrarily defined as 1. The values are mean ±SD of biological triplicates. * = p<0.05. 90!
Figure 6.3 Differentially expressed genes identified from the transcriptional profiling
were validated by real-time PCR and Western blot analysis. (A-B) Real-time PCR
analysis of RNA used for the DNA microarray study probed for (A) upregulated genes
and (B) downregulated genes. The expression value of each gene is shown relative to
H3-NP, which was arbitrarily defined as 1. The values are mean ±SD of biological
triplicates. * = p<0.05. (C) Cell lysates from SHH-NP, Vector-NP and H3-NP were
probed with antibodies against upregulated targets EGFR, FOXA2 and downregulated
targets, MSX1 and PAX3. Actin was used as a loading control 91!
Figure 6.4 Target genes of SHH are upregulated in iPSC(IMR90)-derived
neuroprogenitors treated with exogenous SHH. iPSC(IMR90) cells were differentiated
into NP and were treated with (or without) 200 ng/ml recombinant SHH from the start
of the differentiation process. Gene expression was analyzed after 1 week in culture by
real-time PCR. The expression value of each gene is shown relative to untreated NP,
which was arbitrarily defined as 1. The values are mean ±SD of triplicates and the
experiment was repeated twice. * = p<0.05 92!
Figure 6.5 SHH is able to transactivate the promoters of target genes. Luciferase
reporter genes containing fragments of promoters of target genes were co-transfected in
to H3-NP along with Renilla vector and in indicated cases, with or without the SHH
expression vector. Luciferase activities were calculated as a ratio of Firefly luciferase
activity over Renilla luciferase activity and expressed as fold induction relative to
pCDNA3.1 vector control. Values shown are mean ± SD of a representative experiment
carried out in triplicate and repeated at least three times. * = p<0.05, ns = not
significant. 97!
Figure 6.6 The transcriptional network of SHH in hESC-derived neuroprogenitors.
Target genes of the pathway are indicated by the solid lines while suggested
consequences of pathway activation are indicated by dotted lines. 108!
1
CHAPTER 1 INTRODUCTION
1.1 Background
Human embryonic stem cells (hESC) are a widely envisioned source of cells for use
in cell replacement therapy. In particular, medical conditions arising from the loss of neurons,
like Parkinson’s disease, Alzheimer’s disease, stroke and spinal cord injuries, are potential
beneficiaries of the cell replacement therapy. The inherent limited capacity of the central
nervous system for self-repair means that transplantation of functional neurons into the sites
of injury is one potential approach to restore physiological function. Unfortunately, the lack
of transplantable neurons has rendered these conditions to be currently incurable. Therefore,
the ability of hESC to differentiate to all cell types of the body has spurred intensive research
towards understanding the biology of hESC self-renewal as well as to differentiate hESC
towards cells of the neural lineage.
The process of neural differentiation is governed by both extrinsic signals from the
microenvironment like growth factors, substrates and cell-to-cell contact, and intrinsic gene
regulation. Therefore, to achieve efficient directed differentiation of neurons, it is essential
that there is sufficient knowledge of the differentiation process and the underlying molecular
mechanisms controlling cell fate choices.
Principles gleaned from developmental biology studies have been effective when
applied to in vitro neural differentiation of hESC. The process requires the use of inductive
signals applied in a timely and coordinated fashion, with the aid of stromal cells or genetic
manipulation (Kawasaki et al., 2000; Carpenter, 2001; Zhang et al., 2001; Chung et al., 2002;
Perrier et al., 2004; Gerrard et al., 2005; Du et al., 2006; Hedlund et al., 2008). As a result,
hESC have been successfully differentiated into a great variety of cells that make up the
central nervous system including dopaminergic neurons, motor neurons, glial cells,
astrocytes, oligodendrocytes, neural crest stem cell cells and retinal cells (Bjorklund et al.,
2002; Faulkner and Keirstead, 2005; Lamba et al., 2006; Lee et al., 2006; Lim et al., 2006;
Lee et al., 2007a).
2
The Sonic Hedgehog (SHH) signaling pathway is one of the key pathways that
control the development of the central nervous system in mammals. It is also important in the
development of many other organs such as the limbs, bone, lung and the gut. As a
morphogen, SHH is one of the crucial patterning factors used in conjunction with other
molecules to efficiently generate several subtypes of neurons, including motor neurons and
dopaminergic neurons from hESC (Perrier et al., 2004; Lee et al., 2007b).
1.2 Motivation
Given the importance of hESC, it is essential to understand the mechanisms that
direct the balance between the states of self-renewal and differentiation. Several
developmentally important signaling pathways like the fibroblast growth factor (FGF) and
transforming growth factor beta (TGF") pathways have been identified to be instrumental in
governing hESC self-renewal (Vallier et al., 2005, Xu et al., 2005). However, the exact
cellular and molecular mechanisms are still being elucidated. To date, there has not been any
in-depth study investigating the potential function of the SHH signaling pathway in hESC.
Despite being able to obtain several neural cell types from hESC, there are gaps in
the understanding of the molecular pathways controlling the differentiation of hESC along
the neural lineage. This is reflected in current neural differentiation protocols that often result
in a heterogeneous population of neural cells that are at different stages of differentiation
(Pruszak et al., 2007). Furthermore, the specific ways by which SHH is able to direct neural
differentiation towards the motor neuron and dopaminergic neuron lineages is often obscured
as SHH is studied together with its partner molecules (Lee et al., 2000, Kim et al., 2002, Yan
et al., 2005). Therefore, a systematic study into the role of SHH in neural differentiation and
the gene networks it controls will provide insight into the hESC differentiation process. The
knowledge gained can also potentially be used in the future to better control the
developmental fate of cells and achieve more efficient differentiation of hESC to the desired
neural cell type.
3
1.3 Objectives
Hence, the proposed research work revolves around two principle objectives which is
to investigate the role of SHH signaling pathway in the:
1. Self-renewal and maintenance of pluripotency in undifferentiated hESC
2. Directed differentiation of hESC towards the neural lineage
Objective 1 was achieved by examining the capacity of the SHH pathway in maintaining
pluripotent marker expression and cell proliferation of undifferentiated hESC. Objective 2
was achieved by studying the effect of overexpression of SHH in hESC-derived
neuroprogenitors and identifying novel downstream target genes of the SHH pathway in
neuroprogenitors.
1.4 Organization
This thesis has 7 chapters. Chapter 1 describes the background, motivation and
objectives of this thesis. It follows with Chapter 2 which presents a literature review of the
SHH pathway and its function during mammalian development. It also covers the current
understanding of undifferentiated hESC and strategies for in vitro differentiation of hESC to
the neural lineage. Chapter 3 provides details on the materials and methods used in this
thesis. Chapter 4 evaluates the presence and activation of the SHH pathway in hESC. It also
studies the effect of SHH during spontaneous differentiation. Chapter 5 presents the directed
neural differentiation of hESC and the changes observed from overexpression of SHH in
hESC-derived neuroprogenitors. Chapter 6 examines the regulated genes by SHH and
proposes novel target genes of the SHH pathway in hESC-derived neuroprogenitors. Chapter
7 is a summary of the findings of this thesis and provides recommendations for future work.
4
CHAPTER 2 LITERATURE REVIEW
2.1 Overview of SHH signaling pathway
The Hedgehog gene was first discovered by Nusslein-Volhard and Wieschaus
(Nusslein-Volhard and Wieschaus, 1980) during a Drosophila mutant screen for genes that
were important for the “development of the fruit fly larval body plan”. The larvae of the
mutated gene had spiky cuticles, which prompted the authors to name the gene hedgehog
(hh). Since its discovery, the hh gene has been discovered in many species, including the
puffer fish, zebrafish, chick, mouse and human (Ingham, 2001). Many key components of the
SHH pathway are evolutionarily conserved from the Drosophila to the zebrafish, and to
mammals, which signifies its importance. At the same time, there are important intraspecies
divergences within the pathway that reflect its ability to control development in a species-
specific manner (Huangfu, 2006). Drosophila carries a single hh gene while vertebrates have
3 Hh genes: Sonic hedgehog (Shh), Indian hedgehog (Ihh) and Desert hedgehog (Dhh). All 3
Hh proteins are are able to bind to the Patched 1 (Ptch1) receptor (Pathi et al., 2001) and can
function redundantly (Zhang et al., 2001). However, their differences in expression patterns
enable them to play different roles in development (Ingham, 2001; Varjosalo and Taipale,
2008). Shh is the most broadly expressed Hh protein that mediates the most functions in
development (Varjosalo and Taipale, 2008), and hence will be the focus of this thesis.
2.2 SHH processing, pathway components and signal transduction
2.2.1 SHH processing
The Shh protein is synthesized as an approximately 45 kDa precursor which is then
processed to a 19 kDa active signaling peptide (Figure 2.1). The signal peptide is cleaved
when the full-length precursor protein is transported into the endoplasmic reticulum. The
precursor protein then undergoes proteolytic autoprocessing in a reaction catalyzed by its
own C-terminal domain, to generate the smaller 19 kDa N-terminal signaling molecule (Shh-
5
N). Following that, a cholesterol moiety is added to the C-terminus of Shh-N. Then, a
palmitic acid moiety is added to the N-terminus of Shh-N (Porter et al., 1996; Chamoun et
al., 2001; Lee and Treisman, 2001). These modifications result in an active 19 kDa fragment
that contains all its known signaling activity. The cholesterol modification of Shh enables the
ligand to attach tightly to cell membranes and is proposed to be required for the distribution
of Shh-N in vivo (Guerrero and Chiang, 2007).
Figure 2.1 Processing of the Shh full-length protein to form the Shh-N signaling peptide.
2.2.2 SHH pathway components
The Shh pathway signals via two receptors, Smoothened (Smo) and its negative
regulator Ptch1, which are predicted to have 7 and 12 transmembrane spans respectively. In
mammals, there are two Ptch members, Ptch1 and Ptch2 that have similar amino acid
6
identities (Carpenter et al., 1998). The secretion of Shh depends on Dispatched, a 12-span
transmembrane protein homologous to Ptch (Burke et al., 1999; Ma et al., 2002).
In mammals, there exist three transcriptional effectors of the pathway: GLI-Kruppel
family member 1 (Gli1), Gli2 and Gli3. The Gli3 protein exists in 2 forms, the full-length
form which can activate transcription and the truncated form that represses transcription of
Shh dependent genes (Wang et al., 2000). Gli3 is normally phosphorylated and
proteolytically processed to the repressor form and this cleavage is inhibited by Shh (Wang et
al., 2000; Wang and Li, 2006). Gli3 functions mainly as a repressor of Shh signaling by
repressing target gene expression (Sasaki et al., 1997; Wang et al., 2000). While Gli2 is
similarly processed like Gli3 by the proteosome, the processing appears to be inefficient due
to differences in their C-terminus regions (Pan et al., 2006; Pan and Wang, 2007). Gli1 lacks
the N-terminal repression domain present in Gli2 and Gli3 and therefore functions only as an
activator (Ruiz i Altaba, 1999; Sasaki et al., 1999). Gli1 and Gli2 act primarily as
transcriptional activators and have overlapping functions (Park et al., 2000; Bai and Joyner,
2001). Since transcription of Gli1 is controlled by active Shh signaling (Dai et al., 1999) and
Gli1 knockout mutant mice are viable (Bai and Joyner, 2001), Gli1 is believed to be a
secondary effector of the Shh signal transduction and serves to amplify the response to Shh
(Bai et al., 2002).
In mammalian Shh signaling, there are other additional molecules that regulate the
activity of the Shh signaling by binding to Shh. Cdo and Boc are cell surface
immunoglobulin superfamily members that bind to Shh to promote its activity (Tenzen et al.,
2006; Yao et al., 2006; Zhang et al., 2006). Another cell surface protein Gas1 is similarly a
positive component of the signaling pathway (Allen et al., 2007). Gas1 and Cdo promote Shh
signaling by acting synergistically with Ptch1 to enhance Shh binding to Ptch1 (Allen et al.,
2007; Martinelli and Fan, 2007). On the other hand, the hedgehog inhibitory protein (Hhip) is
a membrane-associated protein that binds and diminishes the effect of Shh ligand by
sequestration. Hhip is a transcriptional target of Shh (Chuang and McMahon, 1999; Jeong
and McMahon, 2005), and is part of the negative feedback loop to limit the range of Shh
7
signaling. Therefore, these molecules modulate the range and concentration of Shh, and are
necessary for Shh to carry out its function as a long-range morphogen.
There are other negative regulators of the pathway. Suppressor of fused (Sufu) is one
such protein, which inhibits Gli proteins from initiating transcription by sequestering Gli
proteins to the cytoplasm (Kogerman et al., 1999; Stone et al., 1999; Dunaeva, 2003). Sufu
also binds with Gli proteins while they are bound to DNA and inhibits their ability to initiate
transcription (Cheng et al., 2002). Rab23 is another cytoplasmic protein that was recently
identified to be a negative regulator of Shh signaling (Eggenschwiler et al., 2001). Rab23
works downstream of Smo and is suggested to be a link between Smo and Gli whereby it
inhibits the formation of the Gli2 activator form (Eggenschwiler et al., 2006). However, the
exact mechanism of Rab23 has yet to be elucidated.
2.2.3 SHH signal transduction
The mammalian Shh signal transduction pathway requires the primary cilium, a small
microtubule-based structure that extends out of the cell surface and acts as a
microenvironment for signal transduction. Intact cilia and intraflagellar transport components
necessary for cilia assembly are crucial for Shh signaling (Huangfu et al., 2003). Essential
components of the pathway Smo, Ptch1, Sufu, Gli2 and Gli3 have been detected on the
cilium of cells in the mouse neural tube, limb bud and embryonic fibroblasts (Corbit et al.,
2005; Haycraft et al., 2005; Rohatgi et al., 2007). In the absence of Shh, Ptch1 inhibits Smo
by preventing Smo from accumulating at the cilia (Rohatgi et al., 2007) (Figure 2.2). Full
length Gli2 and Gli3 are then phosphorylated by kinases and targeted for proteolysis to
generate the repressor form. The Gli repressor proteins then move to the nucleus to repress
transcription of target genes.
Upon stimulation with Shh, Ptch1 is internalized into the cell and Smo is able to
move into the primary cilium (Corbit et al., 2005; Rohatgi et al., 2007). Live cell
visualization of Smo tagged to a fluorescent protein revealed that intraflagellar transport
proteins are required to move Smo from intracellular pools to the primary cilium (Wang et
8
al., 2009). The relief of inhibition of Ptch1 results in the phosphorylation of the cytosolic C-
terminus of Smo, which then induces a conformational change in Smo and activates
downstream signaling (Zhao et al., 2007).
Figure 2.2 Shh signaling pathway. In the absence of the Shh ligand, Ptch1 inhibits Smo
activity by preventing its accumulation at the cilia. In this state, the Gli3 transcription
factor is cleaved to a repressor form and translocates to the nucleus to repress
transcription. In the presence of Shh, Ptch1 moves away from the cilia and Smo moves
to the cilia, possibly with the help of intraflagellar transport (IFT) proteins. Gli2 and
Gli3 are no longer cleaved and the full length Gli activator translocates to the nucleus to
initiate transcription of target genes, e.g. Ptch1 and Gli1. Hhip, Gas1 and Cdo are
membrane proteins that bind to the Shh ligand to help regulate the Shh signal. This
figure was modified from Simpson et al., 2009.
A novel pathway component, Kif7, has been recently identified to transduce the
signal from Smo to the Gli proteins (Cheung et al., 2009; Endoh-Yamagami et al., 2009;