Applications of capillary electrophoresis in the analysis of natural products
Bạn đang xem bản rút gọn của tài liệu. Xem và tải ngay bản đầy đủ của tài liệu tại đây (756.41 KB, 155 trang )
APPLICATIONS OF CAPILLARY
ELECTROPHORESIS IN THE
ANALYSIS OF NATURAL
PRODUCTS
FENG HUATAO
(B. Sc. WuHan University)
A THESIS SUBMITTED FOR THE DEGREE
OF
DOCTOR OF PHILOSOPHY
DEPARTMENT OF CHEMISTRY
NATIOANAL UNIVERSITY OF SINGAPORE
2004
Acknowledgements
Foremost, I express my most sincere gratitude and appreciation to my
supervisor, Professor Sam Fong Yau Li, for his guidance, support and
patience though this project.
I wish to extend my thanks to all the kind staff in Chemistry Department in
particular Ms Lim F., Ms Wang L. K. and Dr. Wang T. L
I would like to thank all of my colleagues in Prof. Li’ group, who have
helped me in one way or another: Dr. Wei H. P., Dr. Fang A. P., Dr. Qin W.
D., Miss Yuan L. L. and Mr. Yu L. J
I sincerely appreciate the National University of Singapore for providing
me the financial support during my research. Finally, a million thanks to
my parents and wife for their selfless love and unfailing support.
I
Summary
This work focuses on the analytical applicability of capillary
electrophoresis (CE) in the analysis of natural products, which offer a vast
and virtually unlimited source of new agents for both the pharmaceutical
and agrochemical industries. Alkaloids were studied as emphasis in the
thesis. With the high separation efficiency and resolution, CE has been
proven a powerful method for the analysis of natural products.
Five heavy metals in tea were separated and determined in 10 min by a
single run with correlation coefficients (R
2
) greater than 0.999. Detection
limits (S/N=3) of Co, Fe, Cu, Zn and Ni varied from 6 µg/L to 30 µg/L.
Toxic alkaloids in two herbal medicines were investigated. CE buffers
were optimized to achieve best selectivity, efficiency, resolution and
shortest possible analytical time. The preparation procedures of these
two herbal medicines were studied further by applying Capillary
Electrophoresis - Mass Spectrometry (CE-MS) method.
Nonaqueous Capillary Electrophoresis (NACE) was applied for the
separation of alkaloids. To improve the detection limits of alkaloids, a
Transient Isotachophoresis (tITP) procedure was developed for on-line
II
concentration of samples containing alkaloids, which indicated the
possibilities of applying hydrophobic compounds as terminating ions. The
limit of detection (LOD) was enhanced by about 8-10 times.
Since the miniaturization has received considerable attention in the
recent development of CE. The use of microfabrication techniques to
construct CE system on a chip was explored. Alkali metals and
alkaloids were determined successfully on a home-made microchip. The
chip-CE system shows several advantages, such as simplicity,
miniaturization and wide applicability.
There are many types of natural products. CE is a versatile analytical
technique that can be used to analyze different components in different
types of natural products by modifying/optimizing the separation,
preconcentration and detection strategies as demonstrated in this thesis.
III
Contents
Acknowledgements I
Summary II
Contents IV
Chapter 1 Introduction 1
1.1 Principles and historical perspective of Capillary Electrophoresis 1
1.1.1 Basic Principles 2
1.1.2 Electroosmotic Flow (EOF) 4
1.1.3 Modes of CE 8
1.1.4 Trends in the development of CE 11
1.2 Natural products and relevant CE applications 16
1.3 Scope of the research 29
References 31
Chapter 2 Determination Of Trace-metal Elements In
Tea By CE
39
2.1 Introduction 39
2.2 Experimental 42
IV
2.2.1 Apparatus 42
2.2.2 Reagents 43
2.2.3 Procedures 43
2.2.4 Sample preparation 44
2.3 Results and discussion 45
2.3.1 Composition of electrolyte buffer 45
2.3.2 Effects of the pH of the electrolytes buffer 46
2.3.3 Separation of metal ions 48
2.3.4 Quantification 49
2.3.5 Sample analysis 50
2.4 Conclusion 52
References 53
Chapter 3 Application Of CE To The Analysis Of
Toxic Alkaloids In Chinese Medicines And Their
Preparation Procedures
55
3.1 Introduction 55
3.2 Experimental 62
3.2.1 Materials 62
3.2.2 Instruments and procedures 63
3.2.3 Sample extraction 65
V
3.3 Result and discussion 66
3.3.1 CE method developed for determination of toxic alkaloids
with UV detection
66
3.3.2 Application of CE-MS to the investigation of preparation
procedures of Chinese medicines
74
3.4 Conclusion 87
References 89
Chapter 4 Transient Isotachophoresis In
Nonaqueous Capillary Electrophoresis To Improve
The Detection Limits Of Alkaloids
92
4.1 Introduction: 92
4.2 Experimental: 97
4.2.1 Chemicals and Instrumentation 97
4.2.2 Procedures 98
4.3 Results and discussion: 99
4.3.1 Electrolyte buffer 99
4.3.2 Mobilities of tetraalkylammonium ions in nonaqueous
solution
102
4.3.3 Tuning of the TITP effect 104
4.3.4 Rinse procedure 106
VI
4.3.5 Separation of 5 drugs after tITP procedure 107
4.3.6 Applications to real samples 110
4.4 Concluding remarks 113
References: 115
Chapter 5 On-Chip Potential Gradient Detection Of
Alkali Metals And Alkaloids With A Portable CE
System
117
5.1 Introduction 117
5.2 Materials and methods 120
5.2.1 Microfabrication 120
5.2.2 Dimensions and layout of the chip 122
5.2.3 Reagents and apparatus 124
5.2.4 Procedure for CE experiments 125
5.3 Results and discussion 126
5.3.1 Microchip Design 126
5.3.2 Separation of alkali metals 128
5.3.3 Separations of two alkaloids 134
5.4 Conclusion 137
References 138
Chapter 6 Conclusions 141
VII
List of publications 144
Conference papers 146
VIII
Chapter 1 Introduction
1.1 Principles and historical perspective of Capillary
Electrophoresis
Since the introduction of capillary electrophoresis (CE) in 1980s by
Jorgenson, the good performance and relatively simple instrumentation
quickly make CE one of the most attractive research areas. CE allows the
separation and determination of both ionic and neutral compounds with or
without organic solvents. The amount of sample required is in the
nano-liters range. Compared with high performance liquid chromatography
(HPLC), CE is simpler, faster and has higher separation efficiency. Having
made great impact on numerous scientific fields, CE has gradually evolved
into a fully fledged analytical technique. The miniaturization of CE on a chip
indicates a further direction for the achievement of a fully manipulated
analytical platform. At the same time, the drawbacks of CE compared with
HPLC on low concentration sensitivity, which is due to the small sample
quantity and the short light path in the conventional optical absorbance
detector, will continue to be a topic in the CE development.
1
1.1.1 Basic Principles
Capillary electrophoresis has become one of the most exciting and useful
separation methods so far. It differs from other separation methods, such
as Gas Chromatography (GC) or HPLC, in that it uses different migration
speeds of charged particles under an electrical field to achieve the
separation of components from a mixture.
In a CE system, two ends of the capillary are connected to electrodes,
which are connected to a high voltage power supply. The capillary ends
are placed into buffer reservoirs, and the capillary is filled with a buffer
identical to that in the reservoirs (except in the case of isoelectricfocusing).
At the beginning of a common run, a small amount of sample is introduced
(by pressure or electrical field) into the buffer-filled capillary. Then, a
voltage is applied to the two sides of the capillary. Different components in
the sample zone move with different mobilities under the influence of the
electrical field, and are separated in the capillary. After the zones
containing different components pass through a detector, an
electropherogram is acquired and every component will have its own peak
if the resolution is sufficient enough. Better resolution can be achieved by
adjusting factors such as the buffer pH value, ion strength, the type or
2
quantity of other additives in the buffer and applied voltage. Those factors
can influence the mobilities of charged molecules/particles moving in
electrical field [1-4].
Separation by electrophoresis is based on the mobility differences of
analytes in an electric field. The velocity of an ion can be given by the
following equation:
µ = µ
e
E (1.1)
where;
µ : ion mobility;
µ
e
: electrophoretic mobility;
E : applied electric field.
µ
e
may be defined as follows:
µ
e
= q / 6πηr (1.2)
where;
q : ion charge;
η: solution viscosity ;
r : ion radius.
The analytical parameters for CE can be described in similar terms as
3
those for HPLC. The migration or retention time of an analyte means the
required time for its migrating from injection point to detection window.
The separation efficiency, expressed in the number of theoretical plates
(N), can be defined using the following equation:
N = (L/σ)
2
(1.3)
where:
L : distance from injection point to detection point;
σ: total spatial variance of the concentration profile of the zone.
If the peaks acquired are close to symmetrical, the theoretical plate
number can also be calculated from the electropherogram using the
following equation:
N = 5.54 (t/w
1/2
)
2
(1.4)
where;
t : migration time;
w
1/2
: temporal peak width at half of the peak height.
1.1.2 Electroosmotic Flow (EOF)
Capillaries used in CE usually have internal diameters ranging from 25
µm to 100 µm. Comparing to conventional gel electrophoresis, CE offers
4
some significant benefits. For example, very small amount of sample is
needed and joule heat is limited due to the small current and efficient heat
dissipation. In conventional slab gel electrophoresis, this Joule heat can
cause a convention current, which mixes the zones and leads to band
broadening. Joule heating therefore limits the operating voltages used in
conventional slab gel electrophoresis, and produces longer analysis times.
Performing electrophoresis in a capillary allows the heat to be effectively
dissipated through the capillary walls and subsequently reduces any
convection related band broadening. This improved heat dissipation
means that higher operating voltages can be used in CE, which
significantly reduces analysis times.
Moreover, with the small diameter of capillary, the application of the
mechanism – EOF becomes important. During CE separation, there are
fixed charges on capillary internal surface. These fixed charges can
interact with the freely moving charges in the surrounding solvent and
result in a movement of the surrounding solvent toward the electrode that
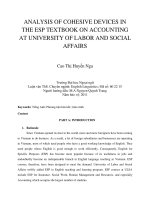
has the same charge as capillary internal surface. A fused-silica capillary
contains silanols that can ionize in contact with basic, neutral or even weak
acidic electrolyte solutions (Figure 1.1). This dissociation produces three
layers at the interface between the internal wall and the buffer solution: the
negatively charged silica, the immobile layer, and the diffuse layer
5
containing cations that tend to migrate toward the cathode. The migration
of cations results in the migration of whole buffer solution through the
capillary; this migration is the EOF. Since the driving force of EOF is
uniformly distributed along the capillary internal wall; EOF can provide a
plug-like flow profile in contrast with the parabolic flow profile of pressure
driven flow and lead to better resolution.
Fig. 1.1 Process of silanol dissociation
EOF causes the same direction movement of entire contents in the
capillary. With suitable parameters, EOF can be significantly greater than
the electrophoretic mobility of the individual ions contained in the sample.
That makes the analysis of positively charged, negatively charged, and
neutral components possible in a single system. Although anions are
electrophoretically attracted toward the anode, they are carried toward the
cathode with EOF. Cations with the highest charge/mass ratios will migrate
6
first, followed by the cations with reduced ratios. Next, neutral components
migrate with the same velocity as the EOF, and finally, the anions migrate.
Electroosmotic mobility (µ
eo
) can be described by the following equation:
µ
eo
= (εζ) / (4πη) (1.5)
where;
ε: permittivity of the solvent;
ζ: (zeta) potential;
η: solution viscosity.
The velocity of the EOF, v
eo
, is described by equation 1.6:
v
eo
= µ
eo
(V/L) (1.6)
where;
V: applied voltage;
L: capillary length.
Electroosmotic flow is important in CE and must be controlled. A rapid EOF
may result in the elution of the analytes before separation has finished.
Conversely, a slow EOF may cause a long migration time.
Successful separations are usually obtained when both EOF and analyte
mobility properties are optimized. To control the EOF and suppress
analyte-wall interactions, coating or modification on the inner walls of
7
separation capillaries is performed to change the negatively charged
character of fused-silica capillaries. After coating, the capillary can be used
to achieve fast separations or optimal resolution of species determined.
There are mainly two classes of coating methods, dynamic coating that
builds equilibria between the buffer and capillary surface, and permanent
coating that generates a stable and undisrupted coating layer. Table 1.1
lists several methods for controlling EOF [1].
1.1.3 Modes of CE
There are several different modes of CE that can be performed using same
CE instrument. Different modes can be achieved by simply changing the
separation medium in the capillary or making a coating on the capillary
internal wall. Table 1.2 presents six common modes, and a brief
description of their separation mechanisms [2].
8
Table 1.1 Methods to Control Electroosmotic Flow
Variable Results Comments
Electric
field
Proportional change
in EOF
Efficiency and resolution may
decrease when lowered.
Joule heating may result when
increased.
Buffer pH EOF decreased at
low pH and increased
at high pH
Most convenient and useful
method to change EOF.
May change charge or structure
of solute.
Ionic
strength of
buffer
Decrease zeta
potential
High ionic strength generates
high current and possible Joule
heating.
Low ionic strength problematic for
sample adsorption.
May distort peak shape if
conductivity is different from
sample conductivity.
Temperat-
ure
Change viscosity
2-3%
Often useful since temperature is
controlled instrumentally.
Organic
Modifier
Change zeta
potential and
viscosity (usually
decreases EOF)
Complex changes, effect most
easily determined experimentally.
May alter selectivity.
Surfactant Adsorbs to capillary
wall via hydrophobic
and/or ionic
interactions
Anionic surfactants can increase
EOF.
Cationic surfactant can decrease
reverse EOF.
Can significantly alter selectivity.
Neutral
Hydrophilic
polymer
Adsorbs to capillary
wall via hydrophobic
interactions
Decrease EOF by shielding
surface charge and increasing
viscosity.
Covalent
coating
Chemical bonding to
capillary wall
Many modifications possible
(hydrophillicity or charge).
Stability often problematic.
9
Table 1.2 Different Modes of High Performance Capillary
Electrophoresis
CE Mode Description
Capillary zone
electrophoresis
(CZE)
Separation is based on differences in the
electrophoretic mobilities of the solutes,
resulting in different velocities of migration of
ionic species in the electrophoretic buffer
contained in the capillary.
Capillary gel
electrophoresis
(CGE)
Separation is based on differences in solute
size, as analytes migrate through the pores of
the gel filled capillary.
Micellar
electrokinetic
chromatography
(MEKC)
The main separation mechanism is based on
solute partitioning between the micellar phase
and the solution phase. This technique provides
a way to resolve neutral molecules as well as
charged molecules by CE.
Capillary
electrochromatogr-
aphy
(CEC)
The capillary is packed with a chromatographic
packing that can retain solutes. The separation
is based on the normal distribution equilibria
upon which conventional chromatography
depends.
Capillary isoelectric
focusing
(CIEF)
Substances are separated on the basis of their
isoelectric points or pI values.
Capillary
isotachophoresis
(CITP)
Separation is performed in a discontinuous
buffer system. Sample components condense
between leading and terminating constituents,
producing a steady-state migrating
configuration composed of consecutive sample
zones.
10
1.1.4 Trends in the development of CE
Though CE possesses a lot of advantages such as simple instrumentation,
short analytical time, less organic solvent required, higher separation
efficiency; it has an undesirable drawback also. As a principle of
chromatography methods, the area of a peak is proportional to the
amount of the component present in the sample; this makes it possible to
perform quantitative analysis. Compared to HPLC, an advantage of CE is
that only a minute amount of sample is needed, typically a few nano-liters.
However, the advantage leads to a drawback – the unsatisfactory
sensitivity, especially for analysis of compounds present at low
concentration.
Resulted from the need for better sensitivity, plenty of studies were
performed to make large sample-loading amount possible without the loss
of separation efficiency [5-7]. Those methods include: field-amplified
sample stacking [8-10], acetonitrile stacking [11,12], large-volume sample
stacking [13,14], pH-mediated stacking [15-17], sweeping [18-20],
isotachophoresis-CZE [21] and transient isotachophoresis [22-23].
Those methods are achieved by utilizations of various processes similar
to the term - "stacking", which can reduce the width of the sample zone
before separation and result in improved sensitivity (since the sample is
11
locally concentrated) and increased separation efficiency. Under these
circumstances, a period for sample concentration is designed usually
before the normal separation step. For example, the field strength is
higher in the sample zone than in the rest of the capillary filling with
electrolyte buffer. Thus, the sample ions move forward rapidly in the
sample zone until they encounter a boundary after which they will
experience lower field strength and their migration rates will slow down.
This will make the sample zone focused.
A suitable detector is also crucial for improving the sensitivity. The most
commonly used detector applied for CE is UV detector, but many
components do not show enough response due to their weak UV
adsorption. From this point, the universality of detectors is of importance.
On the other hand, the selectivity of detectors is an important concern. If
the detector is aimed at the exclusive properties of the analytes, better
baseline can be obtained since most interferences are filtered, it definitely
leads to a better detection limit.
So far, many detection methods have been developed for CE analysis.
The fundamental schemes fall into three categories: optical (such as UV
absorptive and fluorescent) detectors, electrochemical (such as
conductivity, potentiometric and amperometric) detectors and various
hyphenating (typically mass spectrometric) detectors [24]. The main
12
characters of optical detectors are summarized in Table 1.3 [4], and the
mechanisms of four electrochemical detectors are listed in Table 1.4.
Besides those three classes of detection methods, indirect detection is
also an attractive choice for CE when other methods are not available.
Table 1.3 Summary of detection limits of CE optical detectors
Detector Minimal
Detection
Quantity
(mol)
Minimal
Detection
Concentration
(M)
Best Reported
Detection Limit/
Molecule
Direct
absorbance
10
-13
~10
-16
10
-5
~10
-7
2 × 10
-8
M Malachite
Green
Indirect
absorbance
10
-12
~10
-15
10
-4
~10
-6
1 fmol (1 × 10
-7
M)
pyruvate
Laser-induced
fluorescence
10
-18
~10
-21
10
-9
~10
-12
6 molecules
sulforhodamine 101
Indirect
fluorescence
10
-14
~10
-16
10
-6
~10
-8
70 amol
5’-mono-phosphate
nucleotides
Chemilumin-
escence
10
-14
~10
-16
10
-7
~10
-9
100 amol (5 × 10
-9
M ) ATP
Refractive
index
10
-13
~10
-15
10
-5
~10
-7
7 fmol (2 × 10
-7
M)
ovalbumin
Thermooptical
absorbance
10
-15
~10
-18
10
-5
~10
-7
8 amol (1 × 10
-5
M)
DABSYL –amino
acids
Radioactivity 10
-14
~10
-18
10
-6
~10
-10
88 zmol
32
P
Raman 10
-12
~10
-15
10
-3
~10
-5
500 amol (1 × 10
-7
M) Methyl Orange
13
Table 1.4 Mechanisms of four main electrochemical detections
Methods Mechanisms
Amperometry Current is measured at a working electrodes as
analytes undergo oxidation or reduction
reactions by the loss or gain of electrons at the
electrode surface.
Scanning
electrochemistry
A rapid potential sweep is applied to the working
electrode in the range in which the analyte is
oxidized or reduced.
Potentiometry Potential differences between ion-selective
electrodes and reference electrode are
monitored.
Conductivity Solution flows between two inert indicator
electrodes. A small constant current is applied
and the potentials across the electrodes are
measured and compared.
Miniaturization is playing an increasing role in the development of CE. It
may change the pattern of conventional CE and bring about a new
appreciation of simple and low-cost technique. As introduced by Manz
and Widmer in 1990 [25,26], Miniaturized Total Analysis System (µ-TAS)
will perform all the component stages of a complete analysis in an
integrated and automated fashion. These stages can include sampling,
sample pre-treatment, chemical reactions, analytical separation, analyte
detection, product isolation and data analysis. Typically, a µ-TAS is a
microchip or micro-device fabricated using conventional micromachining
14
technologies. The miniaturization of µ-TAS system demonstrates the
enormous analytical potentials, such as reduced reagent consumption,
greater separation efficiencies, larger throughput, better component
integration and the feasibility of automation [27-29].
Though a microfabricated GC was developed in 1979 [30], the utility and
design of microchip for chemical analysis were practically established with
a CE system in 1990 [25]. CE with electrokinetic control of fluids
eliminates the need for valves and pumps that are difficult to construct and
interface to microchip system. CE in the microchip format also allows the
use of high separation field strengths because the materials typically used
to construct the microchips are very efficient in dissipating heat. During
the past decade, chip-based microdevices have become generally
accepted in various emerging application fields of genomics and
proteomics, especially in the DNA separation. DNA sequencing on a chip
was first demonstrated with a microfabricated channel array in 1995 [31].
Ramsey’s group [32,33] had demonstrated the complete integration of
thermal cell lysis, PCR amplification, electrophoresis analysis and labeling
for fluorescence detection on a single microchip. On the other hand, high
throughput DNA analyses were achieved by several research groups with
multi separation channel systems [34-36]. So far, numerous research
groups are working in the field for their ultimate goal – the achievement of
15
a true µ-TAS system.
1.2 Natural products and relevant CE applications
Natural products are the organic and inorganic compounds found in nature:
in plants, in marine organisms, in the microbial fauna found in highly
diverse and sometimes extreme environments, and in the soil [37-39]. The
naturally occurring organic chemical compounds are especially interesting
and intriguing to chemists due to their important functions as structural
materials and biologically active molecules [40-42]. To some extent, the
development of pharmaceutical industry relies closely on the
understanding of natural products. Plenty of drugs, such as Penicillin, taxal,
morphine, were developed from natural products. The research procedure
for natural products normally contains following steps: isolating
compounds from biological sources, purifying, elucidating the molecular
structure and the finally chemical synthesis.
Compounds found in natural products can be identified as products of
primary metabolism (for example, carbohydrates, nucleosides, amino
acids and the polymers derived from them) or as products of secondary
metabolism (phenolics, terpenoids, steroids, alkaloids and so on).
Several important groups of natural products are described respectively as
16