Identification of factors involved in the maintenance of embryonic stem cell self renewal and pluripotency 2
Bạn đang xem bản rút gọn của tài liệu. Xem và tải ngay bản đầy đủ của tài liệu tại đây (11.54 MB, 117 trang )
Chapter2
Results and Discussion
41
2.1 ES cell secretion of LEFTY2 maintains pluripotency
2.1.1 Introduction
The molecular basis of self-renewal and the maintenance of pluripotency in ES
cells have yet to be fully elucidated. Here, I identify additional factors and delineate
additional pathways important for “stemness” using a candidate gene approach was
adopted. ES cells are derived from the ICM of blastocysts and are similar (although not
completely identical) to the pluripotent cells of the ICM. Hence, to shortlist candidates in
an informed and intelligent manner, extensive perusal of literature, particularly pertaining
to genomic studies on blastocysts, preimplantation embryos, the inner cell mass and ES
cells were carried out.
Some published literature that were exploited to shortlist candidates include
MPSS data by Wei et al. (2005), ChIP-PET data by Loh et al. (2006) performed on
mouse ES cells, ChIP-chip data by Boyer et al. (2005) performed on human ES cells and
other genomic data such as gene expression profile changes during mouse
preimplantation development (Hamatani et al., 2004)
Several criteria were used in the selection of genes. The first criterion was the
expression level of the candidate genes in pluripotent cell types of both mouse and human,
such as in ES cells in the in-vitro scenario, primitive ectoderm, epiblast and the inner cell
mass etc when we talk about relevance to in vivo physiology. Genes that are highly
expressed in a particular cell type may play a critical role in the regulation of cellular
42
processes specific to that cell. The in depth transcriptome profiling by Wei et al (2005)
using MPSS also highlighted a list of genes with differential expression patterns between
ES cells and differentiated cells and these may be prime candidates to examine further
for a role in ES cell self renewal. Of primary interest are genes whose expressions are
restricted to the embryonic stages, as pluripotency is characteristic of embryo derived
stem cells.
The similarity in co-expression pattern between the candidate genes and Oct4,
Nanog or Sox2 was also used as a selection criterion, as the co-expression suggests that
the genes can potentially regulate or are regulated by Oct4, Sox2 and Nanog. Little is
currently known about what is upstream of Oct4, Sox2 and Nanog. The studies by Loh et
al and Boyer et al have however revealed the putative downstream targets of OCT4,
SOX2 and NANOG. These targets were of particular interest as it is hypothesized that
these genes form key nodes in the OCT4/SOX2/NANOG network and plays major
functional roles in ES cells, possibly as gatekeepers against differentiation by repressing
differentiation inducing genes such as Gata6 and Lhx1.
Genes linked to the WNT pathway such as Zfx were also included. This is because
WNT is a highly critical conserved pathway that may be critical in maintaining ES cell
self renewal. The use of a synthetic pharmacological inhibitor of GSK3 in ES cells has
been reported by Sato et al to sustain the short term pluripotency and self-renewal via
activation of the Wnt pathway (Sato et al., 2004).
43
Using these criteria, 70 candidate genes were shortlisted. An RNAi screen in
mouse ES cells (E14) using OCT4 and Nanog promoter activity as readouts was then
performed in joint effort with my colleagues to further narrow down the choice of
candidate genes. This thesis documents only the 9 candidate genes for which I was solely
responsible for the cloning of their shRNAs and measurements of OCT4 / Nanog
promoter activity in their knocked down cells (See Appendix). The rationale behind the
use of the luciferase assay is as such: In wild type ES cells, OCT4 and Nanog promoters
are active because the factors that regulate it are present. However, when the ES cells
differentiate, there is a consequential shutdown of the OCT4 and Nanog promoters. This
would lead to a reduction in measured luciferase activity. If any gene is important for the
maintenance of the undifferentiated state of the ES cells or regulation of Oct4, Sox2 or
Nanog, ablating it by RNAi would reduce the luciferase activity. Co-transfection of the
OCT4 or Nanog promoter luciferase construct with short-hairpin RNA (shRNA) over-
expression constructs can hence enable us to rapidly and effectively screen for candidate
genes that have a biological effect in maintaining the undifferentiated cell state (Figure 2).
One interesting factor identified from the screen is Lefty2, a secreted protein well
known for its role in regulating Nodal signaling during embryo development. Data that
are a validation to the functional importance of Lefty2 in ES cell biology are presented in
this chapter. The RNAi screen also identified Lefty1, the homolog of Lefty2 to be a
potential candidate, since its depletion by RNAi also perturbed Oct4 and Nanog promoter
activities. Here, data that show a role for Lefty1 in ES cell self renewal is presented. The
44
mechanism via which Lefty 1 and 2 operates to maintain ES cell self renewal is also
addressed.
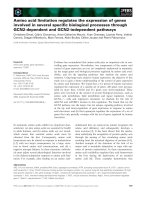
Figure 2a. OCT4-promoter luciferase reporter comprising 3 kb of the Human OCT4
promoter upstream of the transcription start site (TSS) for firefly luciferase. The OCT4-
SOX2 binding site is indicated. (DE- distal enhancer; PE- proximal enhancer; PP-
proximal promoter; CR- human-mouse conserved region, ATG- translation start codon;
TGA- translation stop codon; PolyA- polyadenylation signal)
Figure 2b. Nanog-promoter luciferase reporter comprising mouse Nanog sequences (from
positions -289 to +117 relative to the transcription start site) upstream of firefly luciferase
reporter. Position of OCT4-SOX2 binding site within Nanog promoter is indicated.
Nanog transcription start site is defined by the position of the furthest 5' EST in public
database (NCBI). (ATG- translation start codon; TGA- translation stop codon; PolyA-
polyadenylation signal).
Human OCT4 promoter
TSS
TGA
PolyA
Oct4/Sox2
PE
ATG
CR4
CR3
CR2 CR1
Firefly Luciferase
DE
PE
PP
Murine Nanog
promoter
TSS
PolyA
ATG
Firefly Luciferase
TGA
Oct4/Sox2
2a. pOct4-Luciferase
2b. pNanog-Luciferase
45
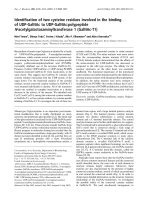
Figure 2c. A schematic representation of the pSuper.puro vector which was used for the
overexpression of shRNA. The vector consists of a H1 RNA polymerase III promoter that
drives the endogenous production of short hairpin RNA (shRNA). Oligo duplexes were
inserted between the BglII and HindIII restriction sites. The vector consists of a PGK-pur
cassette that enables for positive selection with puromycin. (Pur- puromycin)
46
2.1.2 Results
2.1.2.1 Identification of Lefty2 as a candidate for self renewal and pluripotency from
a high throughput RNAi screen
To ensure reliability and specificity of the silencing effect, 2-4 shRNA constructs
were designed for each gene to be knocked down. The RNAi experiment was performed
on feeder-free E14 mouse ES cell cultured in serum based ES cell growth medium
supplemented with LIF. Puromycin selection was used as a means to select for cells
transfected with the shRNAs (Figure 3a). The endogenous levels of the targeted genes
could be reduced to less than 50% in most cases by third day of puromycin selection. It
was found that at least 50% of the candidate genes selected for knockdown were able to
reduce the Oct4 luciferase activity, by 25% or more. Most of the genes which perturbed
Oct4 promoter activity such as Rex2, Lefty1 and Lefty2 were also able to do the same for
Nanog promoter activity (Figure 3b and 3c), with the exception of Zfx. Of these genes,
some were transcription factors such as Zfx and Rex2 and some were signaling molecules
like the Lefty proteins which are involved in the Nodal pathway. This chapter first
describes the functional dissection of Lefty2, followed by that of its homolog, Lefty1.
47
Figure 3a. The application of shRNA coupled with puromycin drug selection in E14
mouse ES cells was able to reduce the endogenous levels of targeted gene candidates to
less than 50% in most cases, as evidenced by quantitative PCR analysis of mRNA level
of candidates. Mean values ± standard error of the mean (SEM) are plotted as percentages
relative to scrambled shRNA control (100%) for qPCR measurement of gene candidates.
Transfection experiments were performed in technical triplicates for each biological
sample and in biological duplicates (n=2).
48
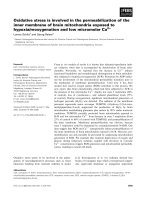
Figure 3b. Knockdown of factors such as Lefty2, Lefty1, Zfx and Rex2 perturbed Oct4 promoter activity. The strategy of RNAi
knockdown of ES cell-specific genes coupled with an Oct4 promoter luciferase reporter was employed to test candidate genes for
their ability to perturb OCT4 promoter activity when depleted. At least two shRNA constructs were made for each targeted gene
and the cell line used is E14. Oct4 RNAi was used as a positive control. Luciferase values were normalized to a non-targeting
control shRNA construct. Transfection experiments were performed in biological triplicates (n=3).
0
50
100
150
200
250
300
Oct4 Rnai
Rex 2 Rnai 1
Rex 2 Rnai 2
Rex 2 Rnai 3
Rex 2 Rnai 4
Gata3 RNAi 1
Gata3 RNAi 2
Gata3 RNAi 3
Gata3 RNAi 4
Lefty1 RNAi 1
Lefty1 RNAi 2
Lefty1 RNAi 3
Lefty1 RNAi 4
lefty2 rnai 1
lefty2 rnai 2
lefty2 rnai 3
Zfx Rnai 1
Zfx Rnai 2
Zfx Rnai 3
Zfx Rnai 4
Catna1 Rnai 1
Catna1 Rnai 2
Catna1 Rnai 4
Catnb Rnai 1
Catnb Rnai 2
Catnb Rnai 3
Catnb Rnai 4
Dot 1l Rnai 2
Dot 1l Rnai 3
Lef 1 Rnai 2
Lef 1 Rnai 3
Lef 1 Rnai 4
Non-silencing Rnai
Vector
Oct4 luciferase activity wrt non sil ctrl (%)
Luciferase activity normalized to non
-
silencing control
(%)
49
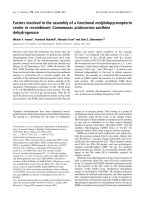
Figure 3c. Genes such as Lefty2, Lefty1 and Rex2 that perturbed OCT4 promoter activities also affected Nanog promoter activity.
The strategy of RNAi knockdown of ES cell-specific genes coupled with a Nanog promoter luciferase reporter was employed to
test candidate genes which can perturb Nanog promoter activity when depleted. Oct4 and Nanog RNAi served as positive controls.
Luciferase values were normalized to a non-targeting control shRNA construct. Transfection experiments were performed in
biological triplicates (n=3) and the cell line used is E14.
Non-silencing
RNAi
Oct4
RNAi
Nanog RNAi
Rex2 RNAi3
Gata3 RNAi4
Lefty1 RNAi1
Lefty1 RNAi4
Lefty2 RNAi1
Lefty2 RNAi3
Catna RNAi4
Catb RNAi1
Catb RNAi4
0
20
40
60
80
100
120
140
Rex2 RNAi2
Zfx RNAi2
Zfx RNAi4
Vector
Nanog luciferase activity normalized to non silencing control (%)
50
2.1.2.2 Lefty2 shRNAs reduce Lefty2 expression level at both the transcript and
protein level
ES cells will differentiate, or perhaps undergo cell death when deprived of signals that
are required for their self renewal. To ascertain if Lefty2 plays a role maintaining ES cells,
shRNAs were used to deplete Lefty2 in E14 cells and the Lefty2 knocked down cells were
observed for signs of differentiation. This experiment was carried out under normal
mouse ES cell growth condition; that is in the presence of 15% serum and LIF. To ensure
the reproducibility, reliability and specificity of the effects of RNAi, two short hairpin
RNA (shRNA) constructs targeting different regions of the transcripts were used.
shRNA1 and shRNA3 target different region of the 3’ untranslated region (3’UTR) of the
Lefty2 transcript. Both constructs were very effective in reducing the endogenous level of
Lefty2 transcripts. qPCR analysis shows that shRNA1 resulted in a 74% reduction
relative to the non targeting control while the reduction achieved with shRNA3 was 80%
(Figure 4a). The relative transcript levels between Lefty2 knockdown samples and
scrambled control were tabulated using the Ct method (See Appendix). -Actin was
used as the housekeeping gene for normalization purpose. The observed decrease in Lefty
protein level relative to the non targeting control reflects the changes in gene expression
level induced by RNAi (Figure 4b).
51
Figure 4a. Lefty2 RNAi in E14 mouse ES cells effectively reduced Lefty2 transcript
levels by more than 75%. Mean values± standard error of the mean (SEM) are plotted as
percentages relative to the scrambled control (100%). Transfection experiments were
performed in technical triplicates for each biological sample and in biological duplicates
(n=2). The two shRNAs used target different regions of Lefty2 mRNA target different
region of the 3’ untranslated region (3’UTR) of the Lefty2 transcript
Figure 4b. Lefty2 RNAi caused a decrease in endogenous Lefty protein levels, as
evidenced by western blot analysis. Lefty bands represent the processed form, ie the
34kDa form of total Lefty proteins, ie both Lefty1 and Lefty2. The intensities of the
bands were compared to the loading control -Actin.
Actin
Lefty
(34kDa)
Control
RNAi3
RNAi1
0
20
40
60
80
100
120
RNAi1 RNAi3 Control
L efty 2 tra ns c ript le v el n o rm aliz ed to n on -sile n cing
c on trol (% )
52
2.1.2.3 RNAi knockdown of Lefty2 caused mES cell differentiation, even in presence
of LIF
Various parameters were investigated to assess the differentiation status of the ES
cell upon Lefty2 RNAi knockdown compared to the control. As a start, constructs
containing either the Oct4 promoter or Nanog promoter that contain OCT4/SOX2
binding sites driving the transcription of a luciferase reporter gene were used to measure
the transcription activity of these pluripotency gene promoters (Figure 2). This provided a
rapid and sensitive readout to detect any loss of pluripotency and onset of differentiation
in Lefty2 RNAi knockdown samples. Two independent shRNAs against Lefty2 caused
significant reductions of Nanog promoter activity in ES cells cultured in the presence of
serum and LIF. Nanog luciferase activity for Lefty2 RNAi knockdown cells dropped by
40% compared to control cells for both shRNAs. Transient overexpression of both the
shRNAs in E14 cells also reduced Oct4 promoter activity. shRNA1 induced a weaker
attenuation of Oct4 promoter activity by 18% while shRNA3 caused a more dramatic
reduction of 52% (Figure 5).
The phenotypic effect of Lefty2 RNAi on ES cells was then investigated. By the
third day of puromycin selection, the cells underwent striking morphological changes
indicative of differentiation upon Lefty2 knockdown even in the presence of LIF. The
cells lost their compacted growth morphology. Lefty2 RNAi led to flattening and
disintegration of the ES colonies, with some cells assuming the appearance of fibroblast.
Cells transfected with an equivalent amount of non targeting shRNA however did not
53
undergo any morphological changes. They were still ES like and maintained tight colony
structures (Figure 6).
Figure 5. Lefty2 RNAi caused a reduction of both Oct4 and Nanog promoter activity
in E14 mES cells. To correct for transfection efficiency, firefly luciferase activity was
normalized to Renilla luciferase activity, and expressed as relative percentage change
to that of the scrambled control. Experiments were performed in biological triplicates
(n=3), where error bars denote standard error (SE).
Nanog promoter activity normalized to non
-
silencing control (%)
54
Pluripotent ES colonies stain positively for alkaline phosphatase. Fewer cells
stained for alkaline phosphatase on the fourth day of drug selection when Lefty2 RNAi
was applied when compared to the non-silencing control samples. This again suggests
that Lefty2 RNAi induces ES cell differentiation and this data is consistent with the
morphological observation (Figure 6).
Figure 6. Lefty2 is required for mouse ES cell self renewal. Assessment of morphlogy
indicated E14 mouse ES cell differentiation upon Lefty2 RNAi, even in presence of LIF.
Lefty2 knockdown led to loss of ES cell characteristics such as clustered growth
morphology and alkaline phosphatase staining. An undifferentiated phenotype was
however maintained when a scrambled control shRNA was used. Puromycin (1 g/ml)
selection was performed 24 h post-transfection for three days. Experiments were carried
out in duplicates. Magnification used was 100x. Two Lefty2 shRNA constructs were used
to ensure reproducibility and specificity of the silencing effect
55
The changes in expression of key pluripotency genes were also assayed to assess
the loss of pluripotency after Lefty2 knockdown. Quantitative PCR on total RNA
extracted from Lefty2 RNAi transfected samples subjected to four days of puromycin
selection was performed. A reduction in Oct4 and Nanog transcript level were detected.
This is consistent with the changes observed with Nanog and Oct4 promoter activity
upon RNAi. The levels of other key pluripotency genes such as Sox2 and Utf1 were also
downregulated after Lefty2 knockdown. Both shRNAs yielded consistent results
(Figure7). Partial loss of Lefty2 also led to reduction of Nanog protein expression in LIF
supplemented cultures, as observed with immunofluorescence microscopy (Figure 8).
Figure 7. Lefty2 knockdown elicited the downregulation of pluripotency gene
expression such as Oct4, Nanog, Sox2 and Utf1at the transcript level, as observed with
quantitative PCR analysis. Experiments were performed in biological duplicates and
duplicate Ct values were obtained for each of the biological replicates (n=2). Error
bars denote standard error of the mean (SEM). Mean values ± SEM are plotted as
percentages relative to the scrambled shRNA control (100%).
0
20
40
60
80
100
120
Oct4 Nanog Sox2 Utf1
Gene expression level normalized to non-silencing
control (%)
RNAi1
RNAi3
Control
56
To determine what cell types the Lefty2 RNAi knockdown cells were
differentiating into, I assayed for the expression of lineage specific gene markers. In
culture conditions containing serum and LIF, elevated mRNA levels of the early
primitive ectoderm marker (Fgf5) and mesendodermal markers (Sox7, Cerberus1 and
Pitx2) were observed for Lefty2 RNAi knockdown cells relative to non targeting control
(Figure 9). This suggests that the cells with reduced Lefty2 were differentiating into
epiblast derived cell types upon Lefty2 knockdown, possibly into the mesendodermal cell
fate. To elucidate in a more definitive manner the lineage the Lefty2 RNAi transfected
cells were differentiating into, LIF was withdrawn from Lefty2 RNAi cultures as it may
interfere with the effect of Lefty2 knockdown by blocking differentiation. Marker qPCR
Figure 8. Partial loss of Lefty2 led to reduction of Nanog protein expression in LIF
supplemented E14 mouse ES cell cultures, as observed with immunofluorescence
microscopy. Cell nuclei were stained with DAPI. Magnification used was100x.
57
analysis was performed on day6 post transfection samples. Directed reduction of Lefty2
led to a significant upregulation of more mesendodemal markers: Brachyury (T), Mixl1,
Pitx2 and Claudin 6 for both shRNAs. shRNA3 induced a strong upregulation of 12 fold
for Brachyury, 6 fold for Mixl1, 4 fold for Pitx2 and 2 fold for Claudin6. shRNA1 also
induced a similar panel of genes as that for shRNA3, albeit at a lower level. In addition,
the two-fold upregulation of Cadherin11, another mesendodermal marker, was also
induced by shRNA1. The expression of ectodermal markers such as Nestin, Pax6 and
Neurod1, and endodermal markers like Hnf4, Sox17 and Gata4 also prominently showed
no significant difference between the Lefty2 RNAi samples and the control (Figure 10a).
These data suggests that Lefty2 RNAi knockdown induces mesendodermal cell fates
specifically and Lefty2 may be required to maintain ES cell self renewal by blocking
mesendodermal differentiation.
58
Figure 9. Lefty2 knockdown in presence of serum and LIF led to upregulation of differentiation markers in E14 ES cells.
Quantitative PCR analysis of germ layer markers in Lefty2 knockdown cells cultured with LIF indicated an upregulated expression
level of markers like Sox7 over controls. Error bar represent standard error of the mean (SEM) of 2 biological replicates. The
samples were normalized to endogenous -actin and mean values are plotted as percentages relative to scrambled control.
0
200
400
600
800
1000
1200
1400
1600
1800
Fgf5
Nestin
Pax6
Ngn1
Nkx2.5
Flk-1
Bmp4
Pitx2
Lefty1
T
Mixl1
Gsc
Nodal
Fgf8
Sox7
Cer1
Foxa2
Sox17
Gata4
Gata6
Nr2f2
Pdgfr
Furin
Gene expression normalized to non silencing control (%)
RNAi1
RNAi3
Control
Ectoderm Mesoderm Mesendoderm Endoderm
59
Figure 10a. Lefty2 knockdown using RNAi3 in the absence of LIF led to differentiation of E14 ES cell to mesendoderm.
Quantitative PCR analysis of germ layer markers in Lefty2 knockdown cells cultured under LIF free condition indicates an elevated
expression level of mesendodermal markers like Mixl1 over controls. Error bar represent standard error of the mean (SEM) of 2
biological replicates. The samples were normalized to endogenous -actin and mean values are plotted as percentages relative to
non treated control (100%).
0
200
400
600
800
1000
1200
1400
1600
1800
Lefty2
Lefty1
Flk-1
T
Pitx2
Mixl1
Claudin6
Cad11
Nodal
Gsc
Foxa2
E-cadherin
FoxH1
Pthr1
Hex
Sox7
Pdgfr
HNF4
Pdgfr
Sox17
GATA4
GATA6
Nr2f2
Fgf5
Nestin
Pax6
Gfap
Neurod1
Gene expression normalized to non-silencing control (%)
RNAi
Control
Ectoderm Endoderm Mesendoderm Mesoderm
60
Figure 10b Photomicrographs of E14 cells cultured in serum based, LIF free ES cell
growth medium show that by day4 of Lefty2 RNAi, cells were already morphologically
different from control. Controls remained as homogenous ES-like clusters while
population transfected with Lefty2 shRNA contained differentiated cells. Magnification
used was 200x.
Secondary replating assays were also used to compare the extent of differentiation
between the RNAi samples and the control. Withdrawal of LIF was used in this assay to
allow Lefty2 shRNA knockdown to differentiate the ES cells. The cells were then
dissociated with trypsin and replated at single cell density to allow the ES cells to expand
into colonies. It was interesting to note that the number of secondary ES colonies that
emerged from the differentiated cells transfected with the scrambled control replated on
MEFs was higher than that obtained for cells transfected with both the Lefty2 shRNAs.
The number of colonies observed for the control was almost twice that relative to
shRNA3 at two different seeding densities of 300 and 500 cells per 56cm
2
(surface area
of each well of a 6 well dish is 56cm
2
). When 300 cells were reseeded, the number of
secondary colonies formed for cells transfected with shRNA1 was only 75% of that
obtained with the non targeting control cells. This data suggests that Lefty2 RNAi
knockdown also affects ES cell colony forming potential due to differentiation (Figure
11).
RNAi1 RNAi3
Control
61
0
10
20
30
40
50
60
70
RNAi3 Control
No. of secondary ES colonies
300 cells
replated
500 cells
replated
0
5
10
15
20
25
30
35
40
45
50
RNAi1 RNAi3 Control
No. of secondary ES colonies
300 cells
replated
Figure 11. ES cells with reduced Lefty2 had significantly reduced capacity to form
colonies when replated onto feeders, indicating greater extent of differentiation as
compared to control cells. Secondary replating assay was used to compare the extent
of differentiation between Lefty2 RNAi cells and control cells. a) Two seeding
densities (300 and 500 cells) were performed for one of the shRNAs while b) 300 cells
were replated after RNAi treatment for both the shRNAs. Error bars correspond to
four biological replicates, and P <0.01 as determined with non paired t-test.
11a.
11b.
62
2.1.2.4 ES cell differentiation induced by Lefty2 RNAi is specific to loss of Lefty2
shRNAs achieve their effects through a complex array of molecular interaction,
including, but not necessarily limited to those that confer the desired nucleotide
sequence-based specificity-that is, they may cause off target effects (Moffat and Sabatini,
2006). Up to this point, consistent results obtained using two Lefty2 shRNAs targeting
different regions of the Lefty2 transcript have given me the confidence that the
phenotypes observed are gene specific and are not mere experimental artifacts or reagent
specific. For further proof of specificity, rescue experiments for the Lefty2 knockdown
experiments were also carried out.
The first set of rescue experiment involved the cotransfection of a vector
overexpressing Lefty2 RNAi resistant transcripts with Lefty2 shRNA. Dual drug selection
of gentamycin (G418) and puromycin was used to select for cells that had incorporated
both vectors. For the rescue experiment, shRNA3 was used as it gave the best knockdown.
A construct overexpressing the open reading frame of Lefty2 (Lefty2 ORF construct) was
engineered (Figure 12a). This strategy allows the production of an abundance of Lefty2
transcripts that is resistant to RNAi targeting and degradation by shRNA3 since shRNA3
targets the 3’ untranslated region (3’UTR) and does not affect the coding region. To
facilitate detection, the Lefty2 cDNA was tagged in frame with V5 at its carboxyl
terminus. Biologically active forms of Lefty proteins require proper processing and
secretion. Hence, it was important to check that the ability to produce functional LEFTY2
was not compromised by the V5 tag. Western blot analyses against the V5 tag detected
the presence of both the precursor (42kDa) and processed forms of LEFTY2 (34kDa and
63
28kDa) in the medium conditioned by the transfected E14 cells (Figure 12b). This
indicates proper processing and secretion and verified that the RNAi resistant
overxpression construct could effectively produce LEFTY2.
Lefty2 open
reading frame
with V5 tag
BclI
NsiI
Figure 12a. Vector map of pCAG_Lefty2V5 plasmid. The Lefty2 gene is shown in
blue. The open reading frame coding for Lefty2 is inserted between the BclI and NsiI
restriction sites, upstream of the IRES-EGFP cassette. A V5 tag has been cloned at the
3’ end of Lefty2 cDNA. The vector consists of a CAG promoter that drives the
endogenous production of Lefty2.
64
First, the optimal ratio of overexpression construct to shRNA was determined
using Nanog level measurement as the readout. It was found that cotransfection of 3ug
and 4 ug of the Lefty2 ORF construct with 2ug shRNA3 could reverse the drop in Nanog
level induced by shRNA3. Nanog level was remained unchanged when a ratio of 2ug
Lefty2 ORF construct to 1ug shRNA was utilized. At this ratio, the co-transfection of
RNAi resistant overexpression construct with shRNA was also able to fully block the
reductions in expression level of pluripotency genes like Oct4 and Sox2 otherwise
observed under Lefty2 RNAi knockdown (Figure 13a and 13b).
Figure12b. The precursor (42kDa) and processed forms of V5 tagged LEFTY2 (the
34kDa and 28kDa form) were detected in the medium conditioned by the Lefty2
overexpressing cells by Western blotting using anti-V5 antibody. No signal was
detected in the control. The level of Lefty2 proteins in duplicate preparations of
medium conditioned by E14 cells transfected with the V5 tagged Lefty2
overexpression construct was analyzed using western blot. Equivalent volume of
medium conditioned by cells transfected with empty vector in exactly the same
manner as the overexpression construct were analyzed in parallel.
42kDa
34kDa
28kDa
LEFTY2
conditioned
medium
CAG vector
control
conditioned
medium