Fracture toughness in rate dependent solids based on viod growth and coalescence mechanism
Bạn đang xem bản rút gọn của tài liệu. Xem và tải ngay bản đầy đủ của tài liệu tại đây (3.55 MB, 161 trang )
FRA CTURE TOUGHNESS IN RATE-DEPENDENT
SOLIDSBASEDONVOIDGROWTHAND
CO ALESCENCE MECHANISM
TANG SHAN
(M.Eng, Institute of Mechanics, CAS; B.Eng, HUST)
A THESIS SUBMITTED
F OR THE DEGREE OF DOCTOR OF PHILOSOPHY
DEPARTMENT OF MECHANICAL ENGINEERING
NATIONAL UNIVERSITY OF SINGAPORE
2008
ii
To my mother
iii
LIST OF PUBLICATION S
Journal Papers
[1] Tang, S., Guo, T.F., Cheng, L., 2008. Rate effects on toughness in elastic nonlinear
viscous solids, Journal of the Mechanics and Physics of Solids 56, 974-992.
[2] Tang, S., Guo, T.F., Cheng, L., 2008. C* contro lled creep crack growth by grain
boundary cavitation, Acta mater., accepted.
[3] Tang, S., Guo, T.F., Cheng, L., 2008. Mode mixity and nonlinear viscous effect on
toughness of interface, International Journal of Solids and Structure 45, 2493-2511
.
[4] Tang, S., Guo, T.F., Cheng, L., 2008. Creep fracture toughness using conventional
and cell element approaches, Computational Material Science, accepted.
[5] Tang, S., Guo, T.F., Cheng, L., 2008. Coupled effects of vapor pressure and
pressure sensitivity in voided polymeric solids, submitted.
Conference Papers
[1] Tang, S., Guo, T.F., Cheng, L., 2005. Vapor pressure and void shape effects
on void growth and rupture of polymeric solids, Proceedings of the 35th solid
mechanics conference, 4-8 Sep 2006, Krakow, 257-258.
[2] Tang, S., Guo, T.F., Cheng, L., 2007. Rate Dependent In terface Delamination in
Plastic IC Packages Electronics Packaging Technology Conference, EPTC 2007,
9th10-12 Dec., 680 - 685.
iv
ACKNOWLEDGEMENTS
I wish to acknowledge and thank those people who contributed to this thesis:
A/Prof. Cheng Li: I’d like to express my sincere gratitude and appreciation to
my advisor, Prof. Cheng Li for her in valuable guidance and patience. The dissertation
would not have been comple ted without her inspiration and support. Her encouragement
will continue to inspire me in the future.
Dr. Guo Tian Fu: I owe muc h to Dr. Guo Tian Fu. His prominent ability
on mathematics and mechanics spark ed me to investigate some interesting problems in
applied mechanic fields. His passion and enthusiasm for research work was a strong
inspiration to me. He taught me a lot beyond my researc h topic.
Dr. Chew Huck Beng: I owe a lot to Dr. Chew Huck Beng. Great help from Dr.
Chew Huck Beng on paper-writing, software using and helpful discussion on research
problems.Iamveryluckytowalkwithhimthroughmysuccessanddifficulties.
I’d like to thank for my room mates during my four years in Singapore: Ming Zhou,
Guang yan, Hai Long, Jiang Yu, Liu Yi, Ji Hong, Min Bo, Yu Xin. It is always lucky
to share my happiness and sadness with them.
I’d like to thank for my colleagues in experimental mechanics lab: Chee wei, Fu
Yu, Deng Mu, Hai Ning. Chee wei and Hai Ning, introduced me into the experimental
mechanics lab four years ago.
v
TABLE OF CONTENTS
DEDICATION ii
LIST OF PUBLICATIONS iii
ACKNOWLEDGEMENTS iv
LIST OF TABLES viii
LIST OF FIGURES ix
LIST OF SYMBOLS xiv
1INTRODUCTION 1
1.1 Crackgrowthinpolymericmaterials 1
1.2 Crackgrowthinmetalsandalloys 3
2 BACKGROUND THEORY AND MODELING 8
2.1 Embeddedprocesszone 9
2.1.1 Cohesivezonemodel 9
2.1.2 Cellelementmodel 11
2.2 Ratedependentsolids 12
2.2.1 Nonlinearviscoussolids 13
2.2.2 Porousnonlinearviscoussolids 15
2.3 Modelingofinternalpressure 20
2.3.1 VaporpressureinICpackage 20
2.3.2 Methane pressure under hydrogen attack (HA) . . . . . . . . . 21
3 STEADY-STATE CRACK GROW TH IN ELASTIC POW ER-LAW
CREEP SOLIDS 25
3.1 Introduction 25
3.2 Problemformulation 27
3.2.1 Elasticpower-lawcreep 27
3.2.2 Smallscaleyielding 27
3.3 Creeptoughnessusingstraincriterion 29
3.3.1 Validation of the Hui-Riedel field 29
3.3.2 Mesh and size effects 33
3.4 Concludingremarks 35
vi
4 RATE EFFECT ON TOUGHNESS IN ELASTIC NONLINEAR VIS-
COUS SOLIDS 39
4.1 Introduction 39
4.2 Materialmodel 40
4.3 Simulationofsteady-statecrackgrowth 42
4.4 Resultsanddiscussion 43
4.4.1 Competition between work of separation and background dissi-
pation 45
4.4.2 Inelasticzonesizeandcrackvelocity 48
4.4.3 Effectsofinitialvoidvolumefraction 49
4.4.4 Effectsofvaporpressure 52
4.5 Comparisonwithexperimentalresults 53
4.5.1 Concludingremarks 55
5 MODE MIXITY AND NONLINEAR VISCOUS EFFECTS ON TOUGH-
NESS OF INTERFACE 57
5.1 Introduction 57
5.2 Problemformulation 59
5.2.1 Smallscaleyielding 59
5.2.2 Ratedependentmaterialmodel 61
5.3 Steady-statecrackgrowth 61
5.4 Elastic background material with rate-dependent process zone . . . . . 63
5.4.1 Mode mixity effect 63
5.4.2 Strain-rate effect 64
5.5 Rate-dependent background material and process zone . . . . . . . . . 66
5.5.1 Mapsofinelasticzones 66
5.5.2 Mode mixity effect 68
5.5.3 Strain rate and viscous effects 71
5.5.4 Yield strain effects . . . . . . . . . . . . . . . . . . . . . . . . . 71
5.6 Comparisonswithexperiments 72
5.7
Discussion on rate-independent fracture process zone 74
5.8 Concludingremarks 76
6 C
∗
CONTROLLED CREEP CRACK GROWTH BY GRAIN BOUND-
ARY CAVITATION 78
6.1 Introduction 78
vii
6.2 MaterialModel 80
6.3 Steady-state crack grow th under extensive creep . . . . . . . . . . . . . 80
6.4 ResultsandDiscussion 83
6.4.1 Competition between work of separation and background dissi-
pation 85
6.4.2 Creepzonesizeandcrackvelocity 86
6.4.3 Effectofinitialvoidvolumefraction 88
6.4.4 Effect of internal pressure: hydrogen attack . . . . . . . . . . . 89
6.4.5 Renormalizedtoughness-velocitycurves 91
6.5 Comparisonwithexperimentalresults 93
6.6 Concludingremarks 95
7 CONCLUSION AND RECOMMENDATION FOR FUTURE W ORK 97
REFERENCES 101
APPENDIX A – VERIFICATION OF THE LOADING FUNCTION109
APPENDIX B – UNIT CELL STUDY OF VOID GROWTH IN A
PRESSURE SENSITIVE MATRIX AT FINITE STRAIN 112
APPENDIX C – RATE DEPENDENT INTERFACE DELAMINA-
TION IN PLASTIC IC PACKAGES 130
viii
LIST OF TABLES
4.1 Material properties/parameters used in Figs. 4.8-4.9. . . . . . . . . . . . 55
5.1 Material properties for experimental comparison in Figs. 5.10a-b . . . . 73
6.1 Equilibrium methane pressure p
CH4
(MPa) generated by hydrogen at-
tac k († The initial yield stress σ
0
is taken to be a fraction of the tem-
perature dependent Young’s modulus: E/500, which can be found at
91
6.2 Material properties for experimental comparison in Figs. 6.10a-b and
Figs. 6.11a-b . . . . . . . . . . . . . . . . . . . . . . . . . . . . . . . . . 94
ix
LIST OF FIGURES
1.1 Crazing structure in PMMA (Kabour and Russel, 1971) . . . . . . . . . 3
1.2 Crazing structure in PE (Ivankovic et al., 2004) . . . . . . . . . . . . . . 4
1.3 Scanning electron micrographs of (a) slow-crack-gro wth and (b) fast-
crack-growth fracture surfaces for the 10-phr rubber-modified epoxy (Du
etal.,2000) 5
1.4 Creep caused void growth in silv er at ambient temperature. . . . . . . . 6
2.1 Traction-separation relation for fracture process (Tvergaard and Hutchin-
son, 1992) . . . . . . . . . . . . . . . . . . . . . . . . . . . . . . . . . . . 10
2.2 (a) Void nucleation, growth and coalescence in a material containing small
and large inclusions. (b) Cell model for hole growth controlled by large
voids and coalescence assisted by microvoids nucleated from small inclu-
sions (Xia and Shih, 1995). . . . . . . . . . . . . . . . . . . . . . . . . . 12
2.3 Creep behavior of pure metals and alloys at high temperature (Kassner
andHayes,2003) 14
2.4 The unit cell, a thick-walled spherical shell with inner radius a and outer
radius b, subjectedtoaxisymmetricloading 16
2.5 Methane pressure as a function of hydrogen pressure for several carbide
typesof2.25Cr-Mosteels 24
3.1 (a) Steady-state crack growth in nonlinear viscous solids under small scale
yielding conditions with constant stress in tensity factor K
I
and crack
velocity ˙a. (b) Schematic of FEM model using conventional strain crack
gro w th criterion imposed at χ
c
. (c) Sc hematic of FEM model using a
layer of cell elements (of width D/2 — representing half of the fracture
process zone), which are placed both ahead of the crac k and along the
crack flank 28
3.2 Stress around the crack tip under plane strain mode I loading for n =4.
(a) Comparison of angular distribution of normalized stress components
Σ
ij
with HR singularity. (b) Radial dependence o f normal stress σ
22
at
θ =0
◦
and θ =90
◦
30
3.3 Stress around the crack tip under plane strain mode I loading for n =6.
(a) Comparison of angular distribution of normalized stress components
Σ
ij
with HR singularity. (b) Radial dependence o f normal stress σ
22
at
θ =0
◦
and θ =90
◦
31
3.4 Stress around the crack tip under plane strain mode I loading for n =10.
(a) Comparison of angular distribution of normalized stress components
Σ
ij
with HR singularity. (b) Radial dependence o f normal stress σ
22
at
θ =0
◦
and θ =90
◦
32
3.5 Stress around the crack tip under plane strain mode II loading for n =4.
(a) Comparison of angular distribution of normalized stress components
Σ
ij
with HR singularity. (b) Radial dependence o f normal stress σ
22
at
θ =0
◦
and θ =90
◦
33
x
3.6 Stress around the crack tip under plane strain mode II loading for n =6.
(a) Comparison of angular distribution of normalized stress components
Σ
ij
with HR singularity. (b) Radial dependence o f normal stress σ
22
at
θ =0
◦
and θ =90
◦
34
3.7 Stress around the crack tip under plane strain mode II loading for n =10.
(a) Comparison of angular distribution of normalized stress components
Σ
ij
with HR singularity. (b) Radial dependence o f normal stress σ
22
at
θ =0
◦
and θ =90
◦
35
3.8 Toughness-velocity curv es applying critical strain
c
=0.01 at different
mesh points. (a) n =4;(b) n =6. 36
3.9 Toughness-velocity curv es applying critical strain
c
=0.02 at different
mesh points. (a) n =4;(b) n =6. 37
3.10 Toughness-velocity curves applying critical strain
c
over critical distance
χ
c
(centered at the fifth element) ahead of the crack for n =4, 6, 10.(a)
c
=0.01; (b)
c
=0.02. 38
4.1 (a) Schematic of craze-like microporous zone surrounding a crack growing
steadily under small-scale yielding conditions. (b) Finite-element mesh
showing a layer of void-con taining cell elements that form the fracture
processzone. 41
4.2 Steady-state toughness Γ
ss
/σ
0
as a function of the crack velocit y ˙a/ (˙
0
D)
for several strain rate exponents and σ
0
/E =0.02. (a) f
0
=0.01; (b)
f
0
=0.05. 46
4.3 Steady-state toughness as a function of the crack velocity for f
0
=0.05
and σ
0
/E =0.02. (a) Elastic background material and rate-dependent
fracture process zone. (b) Rate-dependent background material and rate-
independentfractureprocesszone. 47
4.4 (a) Contour plots of the a ccumulated inelastic strain,
c
=0.02, for sev eral
crack velocities and n =4. (b) The normalized inelastic zone height in the
wake region, h
w
/D, vs. the crack velocity for several strain rate exponents. 49
4.5 Steady-state toughness as a function of the crack velocity for several initial
void volume fractions and σ
0
/E =0.02. (a) n =4;(b) n =10. 50
4.6 Steady-state toughness as a function of the initial void volume fraction
for several crack velocities. (a) n =6;(b) n =10. 51
4.7 Steady-state toughness as a function of the crack velocity for several vapor
pressure levels; n =6and σ
0
/E =0.02. (a) f
0
=0.01;(b)f
0
=0.05. 52
4.8 Experimental data for glassy polymers (PMMA) are m arked by open cir-
cles. The computational simulations are obtained for two types of bac k-
ground material — nonlinear viscoelastic (solid lines), and purely elastic
(dash lines). (a) Atkins et al. (1975); (b) Döll (1983). . . . . . . . . . . 54
4.9 Experimental data for rubber modified epoxy from Du et al. (2000) are
marked by open circles. The solid line is obtained by computational
simulations for nonlinear viscolelastic background material and fracture
processzone. 55
xi
5.1 Schematic of the steady-state crack growth along bimaterial interface un-
der small scale yielding conditions with the constant complex stress in-
tensity factor, K = K
I
+ iK
II
. 60
5.2 Schematic of the steady-state crack growth along bimaterial interface un-
der small scale yielding conditions with the constant complex stress in-
tensity factor, K = K
I
+ iK
II
. 64
5.3 Steady state toughness as a function of crack velocity for several strain
rate exponents with σ
0
/E =0.02,ψ=45
◦
. (a) f
0
=0.01;(b)f
0
=0.05.
Thebackgroundmaterialispurelyelastic 65
5.4 Steady-state toughness as a function of mode mixity for sev eral crack
velocities with σ
0
/E =0.02,n=6. (a) f
0
=0.01;(b)f
0
=0.05 67
5.5 (a) Contour plots of the accumulated inelastic strain,
c
=0.005;(b)the
normalized inelastic zone height in the wake region, h
w
/D, vs. the crack
velocity for several mode mixity for f
0
=0.01, n =6,and˙a/ (˙
0
D)=10
7
.68
5.6 Con tour plots of the effective stress σ
e
/σ
0
=1.0 around the growing crack
for sev eral mode mixity with n =6and f
0
=0.01:(a)˙a/ (˙
0
D)=10
5
;
(b) ˙a/ (˙
0
D)=10
7
. 69
5.7 Steady state toughness as a function of crack velocity for several mode
mixity with σ
0
/E =0.02, n =6. (a) f
0
=0.01;(b)f
0
=0.05. 70
5.8 Steady state toughness as a fu nction of crack v elocity for several strain-
rate exponents at ψ =30
◦
with σ
0
/E =0.02,n=6. (a) f
0
=0.01;(b)
f
0
=0.05. 72
5.9 Steady state toughness as a function of crac k velocit y for three initial
yield strains, σ
0
/E =0.01, 0.02 and 0.04, at ψ =0
◦
with n =6, f
0
=0.05.73
5.10 Comparison with experimental results. The solid lines are the present
FEM results of bimaterial computation. The open circles are the experi-
mental data from: (a) Korenberg et al. (2004); (b) Conley et al. (1992). 74
5.11 Steady-state toughness as a function of crack velocity with rate-dependen t
background material (n =6) and rate-independent fracture process zone:
(a) f
0
=0.01;(b)f
0
=0.05. 75
6.1 (a) Grain boundary ca vitation. ( b) Schematic of the steady-state crack
growth under extensive creep conditions with constant C
∗
. (c) Finite
element mesh showing a layer of void-containing cell elements that form
thefractureprocesszone. 81
6.2 C
∗
as a function of crack velocity for several creep exponents with σ
0
/E =
0.002. (a) f
0
=0.001; (b) f
0
=0.01. 84
6.3 C
∗
as a function of crack velocity for f
0
=0.01. For the backgroun d
material, n =5is fixed while for the fracture process zone n is varied
from n =5to n =20, showing a trend to the rate-independent limit
n = ∞. 87
6.4 Contour maps of the accumulated creep strain ε
c
=0.05 for several con-
vergent crack velocities with n =5.(a)f
0
=0.001; (b) f
0
=0.01. 88
xii
6.5 C
∗
as a function of crack velocity for several initial vo id volume fractions
with σ
0
/E =0.002. (a) n =5;(b) n =10. 89
6.6 C
∗
as a function of crack velocity for several levels of internal pressure
with σ
0
/E =0.002,f
0
=0.01. (a) n =5;(b) n =10. 90
6.7 Dependence of the maximum toughness C
∗
max
and the corresponding crit-
ical velocity ˙a
c
on the internal pressure for two initial porosities. . . . . 92
6.8 (a) Renormalized toughness for ductile creep crack growth; (b) a typical
toughness-velocity curve for brittle creep crac k growth (n =2). 93
6.9 Dependence of the maximum toughness C
∗
max
and the corresponding crit-
ical velocity ˙a
c
on the creep exponent for several initial porosities. . . . 94
6.10 Comparison with the experimental results. The solid lines are the present
FEM results and the open circles represen t the experimenta l data from:
(a) Saxena et al. (1984); (b) Riedel and Wagner et al. (1984); . . . . . 95
6.11 Comparison with the experimental results. The solid lines are the present
FEM results and the open circles represen t the experimenta l data from:
(a) Wasmer et al. (2006); (b) Kim et al. (2006). . . . . . . . . . . . . . 96
A.1 Comparison of the present model with finite element results in the ax-
isymmetric stress space (Σ
m
/¯σ, Σ
e
/¯σ) for f
0
=0.001 and f
0
=0.01.The
solid line is t he analytical solution (2.13) based on t he upper bound ap-
proach while the dash line is the approximate loading surface (2.14). The
FEM results marked by stars and open circles are based on the velocity
and traction boundary conditions, respectively. . . . . . . . . . . . . . . 110
A.2 Comparison of the present model with finite element results in the ax-
isymmetric stress space (Σ
m
/¯σ, Σ
e
/¯σ) for f
0
=0.05. The solid line is
the analytical solution (2.13) based on the upper bound approach while
the dash line is the approximate loading surface (2.14). The FEM results
marked by stars and open circles are based o n the velocity and traction
boundary conditions, respectively. . . . . . . . . . . . . . . . . . . . . . 111
B.1 The unit cell, a spherical cell with elliptic void with maximum radius a
and minimum radius b, subjected to axisymmetric loading with internal
pressure 117
B.2 (a) Macroscopic stretch in ρ direction as a function of macroscopic ef-
fective strain. (b) E volution of void volume fraction as a function of
macroscopic effectivestrain 121
B.3 Evolution of macroscopic effective stress as a function of macroscopic effe-
tive strain with initial spherical void under several internal vapor pressure
levels. (a) stress triaxility T=1; (b) stress triaxility T=3. . . . . . . . . 124
B.4 Evolution of macroscopic effective stress as a function of macroscopic
effetive strain with initial oblate void w =6under several internal vapor
pressure levels. (a) stress triaxility T=1; (b) stress triaxility T=3. . . . 125
B.5 Evolution of macroscopic effective stress as a function of macroscopic
effective strain under sev eral levels of triaxility with three typical pressure
sensitivities: (a) initial prolate void; (b) initial oblate void. . . . . . . . 126
xiii
B.6 (a) Evolution of macroscopic effective stress as a function of macroscopic
effective strain at low triaxiality with three initial void shape. (b) Void
shape change at low triaxiality as the progress of deformation. . . . . . 127
B.7 The maxim um effective stress as a function of triaxiality for f
0
=0.05,
σ
0
/E =0.01 and N =0: (a) under several levels of pressure sensitivities;
(b) under several initial v oid shapes. . . . . . . . . . . . . . . . . . . . 128
B.8 The maxim um effective stress as a function of triaxiality for f
0
=0.05,
σ
0
/E =0.01 and N =0.1 with initial spherical void: (a) under several
initial void volume fraction; (b) under several levels of initial yielding
strain. 129
C.1 Sc hematic of the steady-state crack growth along the bimaterial interface
under small scale yielding condition with the constant complex stress
intensityfactor 133
C.2 The steady-state toughness as a function of crack velocity for several lev els
of internal vapor pressure with σ
0
/E =0.02 , n =6,f
0
=0.05 and two
mode mixity. The background material is purely elastic. . . . . . . . . . 136
C.3 The steady-state toughness as a function of crack velocity for several lev els
of internal vapor pressure with σ
0
/E =0.02, n =6, f
0
=0.05 and two
modemixity. 138
C.4 Vapor pressure effects on interface fracture toughness for a range of mode
mixities. (a) ˙a/ (˙ε
0
D)=10
4
;(b)˙a/ (˙ε
0
D)=10
6
. 139
C.5 Contour plots of the accumulated inelastic strain,
c
=0.01 , around the
growing crack for several levels of internal vapor pressure with σ
0
/E =
0.02, n =6under the crack velocity ˙a/ (˙ε
0
D)=10
5
:(a)ψ =40
◦
;(b)
ψ =0
◦
. 140
C.6 Steady-state toughness as a function of crack velocity for several mode
mixity with σ
0
/E =0.02, n =6.(a)f
0
=0.01;(b)f
0
=0.05.The
backgroundmaterialispurelyelastic 141
xiv
xv
LIST OF SYMBOLS
E Young’s modulus
ν Poisson’s ratio
β pressure-sensitivity index (Appendix B)
Dundur’s elastic mismatch parameter (Chapter 5)
α friction angle
n(m =1/n) power-law hardening exponent
N hardening exponent (Appendix B)
σ
0
reference stress or yield stress
˙
0
reference strain rate
oscillating index
ε,ε
ij
strain tensor (in appendix, microscopic strain)
ε
c
,ε
c
ij
creep strain (inelastic strain)
ε
e
,ε
e
ij
elastic strain
σ
ij
, σ stress tensor (in appendix A, microscopic stress)
s
ij
, s deviatoric stress tensor
Σ
m
/σ
m
mean stress
E
m
/ε
m
mean strain
σ
e
effective stress
Σ
e
macroscopic effective stress (Appendix)
p
0
,p initial/current internal pressure
t generalized stress tensor (chapter 2 and thereafter)
traction force (Appendix)
f
0
,f initial/curren t void volume fraction
f
E
porosity to trigger cell extinction
y (y
Cr
,y
Mo
,y
V
,y
Fe
) concentration parameters (C
r
,M
o
,V,Fe)
M
x
C
y
alloy carbide type
µ chemical potential
f
CH
4
methane fugacity
xvi
JJ-integral
G applied energy release rate
Γ
ss
steady-state fracture toughness
Γ
f
intrinsic toughness of FPZ
Γ
b
extrinsic toughness of background
K (|K|) applied stress intensity factor (Amplitude)
Γ
0
work of separation in the fracture process zone
ˆσ peak stress in the cohesive law (Chapter 2)/the flow stress (Appendix B)
ˆσ
ij
universal function of stress
˜σ
I
ij
, ˜σ
II
ij
universal function of stress of mixed mode (Chapter 5)
Σ
ij
angular distribution of stress (Chapter 3)
¯σ average effective stress
ˆσ the flo w stress
δ open displacement
R characteristic length (Chapter 3)/gas constant (Chapter 2)
unit cell radius (Appendix)
L a reference length characterizing remote field
δ
c
critical open displacement
χ
c
critical distance
c
critical strain
oscillation index
δ
1
,δ
2
shape parameter
t cohesive traction
˙
δ
p
plastic open displacement
˙
δ
0
characteristic crack opening rate
q rate exponent of fracture process zone
t
0
(δ
p
) static traction separation law
D lay er thickness of fracture process zone
K
I
,K
II
mode I/II stress-intensity factor
ψ mode mixity level
˙a crack velocity
xvii
d (d
e
,d
p
) deformation rate(elastic part/plastic part)
e
p
deviatoric part of d
p
ε
p
accumulated plastic strain
L fourth tensor isotropic elastic modulus
ˇσ Jaumann stress rate
σ
t
0
,σ
c
0
initial tensile/compressive yielding stress
T stress triaxiality (Appendix)
T
ρ
,T
z
traction on the boundary
φ (ψ) microscopic strain rate (stress) potentials
Φ (Ψ) macroscopic strain rate (stress) potentials
T
g
glass transition temperature
V /V
M
volume of cell/volume of matrix
a, b inner radius and outer radius of spherical cell
v
r
,v
θ
axisymmetric velocity fields
ν
∗
modified Poisson’s ratio
X material particle
Ω region occupied b y a unit cell
u displacement
F/
¯
F deformation gradient/macroscopic deformation gradient
P/
¯
P first P-K stress/macroscopic first P-K stress
N outward normal vector
λ
ρ
,λ
z
principal stretches in ρ and z direction
E
ρ
,E
z
macroscopic principal stress in ρ and z direction
E
e
macroscopic effective strain
xviii
Summ ary
Polymeric materials and metals and alloys are widely used in man y engineering appli-
cations. In these applications, crack growth and delamination are frequently observed
failure models. The viscoelastic characteristic of polymeric materials can give rise to
rate dependent crack growth within polymeric materials or delamination at the inter-
face where the bond strength is weak, and time dependent inelastic deformation of metals
and alloys at high temperature can cause stable rate dependent crack growth. This rate
dependent crack growth usually initiates from t he cavita tions of voids. Void growth and
subsequent coalescence can result in the initiation and propagation of macrocracks. Fur-
thermore, the internal pressure inside the voids can contribute to an additional driving
force for the cracking under some specific conditions.
In this thesis, detailed studies are performed to examine the steady-state fracture
toughness in polymeric materials and metals (and alloys) at high temperature based on
void grow th and coalescence mechanism. The time dependent behavior of polymeric
materials and me tals (and alloys) at high temperature is described by a power law creep
material model. To describe the fracture process caused b y void growth and coalescence
in polymeric materials and metals (and alloys) at high temperature, the present thesis
proposes a micromechanics model for void growth and coalescence in power-law creeping
solids incorporating the internal pressure.
Without introducing any crack growth mechanism, a computational scheme based
on finite element method is then used to simulate steady-state crack growth in the elastic
nonlinear viscous solids under plane strain, small-scale yielding conditions numerically.
Thereafter, the con ventional approach based on a criterion of critical strain ove r critical
distance ahead of crack is e mployed to examine the fracture toughness in comparison
with the succeeding cell elemen t approach.
By assuming that the main crack growth mechanism is rate dependent void growth
and coalescence, steady-state fracture toughness is studied by a cell element approach
in conjunction with the proposed micromechancis model. In this approach, damage
of the fracture process is modeled by void-containing cells. The constitute behavior
of void-containin g cells is governed by the proposed micromechancis material model
xix
incorporating the internal pressure effect. The material surrounding the fracture process
zone is referred to as the bac k ground material which can be taken as traditional material
model, e.g., elastic, elastic-plastic, elastic nonlinear viscous solids.
Firstly, the cell element approach in conjunction with the proposed micromechancis
model is emplo yed to study the steady-state crack growth in elastic nonlinear viscous
solids under mode I and small scale yielding conditions. Secondly, steady-state crack
growth at interfaces joining polymeric materials and hard substrates is examined under
small scale yielding condition where the substrate i s treated as a rigid material. In
the first part, the polymeric material surrounding the process zone is assumed to be
purely elastic. In the second part, the background material is also treated as an elastic
nonlinear viscous solid. Effects of mode mixity, initial porosity, rate sensitivity, as well
as the initial yield strain on toughness are studied. Thirdly, when crack propagates
at low crack velocity, the creep zone can extend to the whole specimen violating the
small scale yielding condition. The proposed micromechancis model together with cell
element approach is used to study the steady-state toughness under the extensive creep
conditions.
This thesis will conclude with a short summary and discuss the future direction for
the present work.
1
CHAPTER 1
INTR ODUCTION
1.1 Cra ck grow th in polyme ric m a ter ia ls
Glassy polymers, such as polystyrene (PS), poly(methyl methacrylate) (PMMA), poly-
carbonate (PC), PE (polyethylenes) and epoxy (including the modified epoxy), are at-
tractive materials for many engineering applications as they are low in densit y, have
excellent optical clarity and are easily fabricated by processes such as injection molding,
extrusion and vacuum forming (Kramer and Berger, 1990). Applications range from
portable computers and optical lenses to automotive components and appliance hous-
ings (Danielsson et al., 2007). These materials can also be used as matrices in fiber
composites with application fro m complicated electronic circuit boards to wing pan-
els on high-performance aircraft. Polymeric adhesive joints (typically epoxy) are the
most critical components in multi-layered devices and plastic electronic packages in IC
packages.
Mechanical behaviors o f polymers depend on loading rate and temperature. PMMA
and PS are typically considered to be brittle polymers, since under ambient temperature,
quasi-static loading, they fail in brittle manner under low stress triaxiality, such as
uniaxial tension; PC is considered to be a more ductile polymer than PMMA and PS,
since it w ill deform plastically in uniaxial tension. PC also exhibits b rittle behavior
under certain loading conditions, such as high strain rates, highly triaxial stress states;
PE often exhibits ductile behavior due to high molecular weight and time dependent
characteristics; rubber modified glassy polymeric materials have a more ductile behavior
as a result of blending a small volume fraction of easily cavitating rubber particles
with the glassy polymers. On the other hand, near the glass transition temperature,
mechanical behaviors of glassy polymeric materia ls become increasingly rate dependent
and more ductile.
Many polymers experience considerable creep even at ambient temperature, espe-
cially for lo n g term service. This is a consequence of the fact that ambient temperature
2
is a significant fraction of the glass transition temperature for most polymeric m ateri-
als (Bradley et al., 1998). The creep, which results from the viscoelastic character of
polymeric materials, can give viscoelastic creep crack growth.
A better understanding of ho w to evaluate materials resistance to viscoelastic creep
crack growth and how to produce polymeric materials with high degree of resistance
to such cracking is essential for successful engineering applications and materials devel-
opment. Hence, viscoelastic crack growth attracted some rather intensiv e studies. The
mechanism of viscoelastic crack growth in polymeric material typically involves the rate-
dependent process of void growth and coalescence (Kramer and Berger, 1990; Estevez
and van der Giessen, 2005). Crazing in glassy polymers and cavitation in rubber mod-
ified polymeric materials are two crack growth mec hanisms. Both mechanisms involve
the process of void grow th and coalescence in rate dependent polymeric solids.
It has been generally accepted that all the modes of fracture, including rapid crack
growth, quasi-static fracture and slow crack growth in glassy polymeric materials, are
associated with the behavior of the craze ahead of the crack. Failure by crazing begins
with the formation of a highly localized zone of micro voids ahead of the crack (Kambour,
1973; Döll, 1983; Kramer and Berger, 1990; Estevez and van der Giessen, 2005). Void
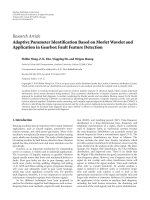
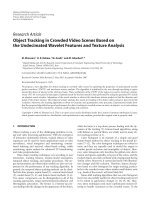
growth and subsequent coalescence can lead to the formation of a fibrous structure.
The presence of this void-fibril network structure is revealed by transmission electron
microscopy in Fig. 1.1 and Fig. 1.2 for PMMA and PE respectively (Kambour and
Russell, 1971; Ivankovic et al, 2004). As a result, the craze widens by drawing the
bulk material into the craze fibrils and eventually ruptures at the mid-fibril or at the
craze-bulk interface, thereby propagating the crack.
In rubber-modified epoxies or polyamides, large ca v ities are formed b y cavitation
of the filler particles — growth and coalescence of these cavities lead to crack growth
(Kinloch et al., 1986; Cardw ell and Yee, 1993; Du et al., 2000). The presence of this
voided st ructure in rubber modified epoxy can be seen from the transmission electron
microscopy in Fig. 1.3 (Du et al., 2000).
It can be concluded that the viscoelastic creep crack growth in both systems of
polymeric materials involve two dissipative processes: rate-dependent void growth in the
fracture process zone and viscoelastic deformation in the bulk solid. For the numerical
3
Figure 1.1: Crazing structure in PMMA (Kabour and Russel, 1971)
predictions of fracture toughness in polymeric materials, the fracture process of the
crazing or cavitation of filler particles is usually modeled by cohesive zone models. These
models are reviewed in Chapter 2.
1.2 Cra ck growth in metals and all oys
In metals and alloys at above half of their melting temperature (expressed in K), the
creep of metals and alloys is associated with time-dependent plasticity at the elevat ed
temperature. This time dependent creep deformation at the crack tip can cause the
stable, rate-dependent crac k growth, usually referred to as creep crack growth. The
common fracture mechanisms of creep crack growth for metals and alloys at high tem-
peratures are the cavitation of voids along grain boundaries followed by growth and
interlinkage, leading to catastrophic crack growth (Riedel, 1987). It has been generally
observed that cavities frequently nucleate on grain boundaries, particularly on those
transverse to a tensile stress. Fig. 1.4 shows the presence o f voids along the grain
boundary for silver, revealed by transmission electron microscopy. Cavities then grow
by the creep deformation of t he material surrounding the grain boundary cavities and
the diffusion of matter from the cavity surface into the grain boundary. With relatively
low stresses, high temperature and small v oid size, the diffusionvoidgrowthdominates,
while with high stresses, low temperature and big void size, diffusionvoidgrowthistaken
4
Figure 1 .2: Crazing structure in PE (Ivankovic et al., 2004)
over by the creep void growth. The subsequent coalescence of cavities with each other
can result in the formation and propagation of cracks along grain boundaries (Riedel,
1987; Cocks, 1989; Kasser and Hayes, 2003).
The time-dependent creep behavior can cause the fracture toughness to depend on
the creep crack growth rate. Creep crack growth in metals and alloys at elevated tem-
peratures has been studied by many authors. Numerous experimental studies have been
conducted to correlate the crack growth rate with mechanical parameters such as elastic
stress intensity factor K
I
, n ominal stress on the crack ligament and the contour integral
C
∗
analogous to the J-integral used f or elastic-plastic fracture; see, for example, Saxena
et al. (1984), Riedel and Wagner (1984), Nikbin et al. (1984), Wasmer et al. (2006)
and Kim et al. (2006).
Another related problem is the creep crack growth in steels and alloys under hydro-
gen attac k conditions. In petrochemical industry, steels and alloys are often exposed to
hydrogen rich environment at high temperatures. Voids usually form preferentially along
the grain boundary. Hydrogen will diffuse into cavitated voids on the grain boundary
where it can react with the carbides. Methane gas is then generated. It cannot diffuse,
remaining in the voids. Depending on reactivity of carbide type, the methane pressure
5
Figure 1.3: Scanning electron micrographs of (a) slow-crack-growth and (b) fast-crack-
growth fracture surfaces for the 10-phr rubber-modified epoxy (Du et al., 2000).
can be of the order of the remote macroscopic stresses. In the case of aggressive car-
bide, i t is even larger. Voids will grow rapidly by creep deformation of the material
surrounding the grain boundary cavities in combination with grain boundary diffusion,
driven by the internal methane pressure, applied load and thermal stress. When the cav-
ities on t he grain boundary facets have grown so large that they coalesce, microcracks
occur. Linking-up of these microcracks results in a macroscopic intergranular fracture
(Shewmon, 1987).
Experimental studies on the intergranular fracture under hydrogen attack (HA) con-
ditions have been carried out by Shewmon and co-workers (1990; 1991; 1994; 1998). The
fracture surface formed is always a dimpled, grain boundary fracture of a dimple spacing
with a few microns. Creep crack grow th rate under HA conditions was also measured
by wedge-opening loaded specimens for low-carbon and 2.25 Cr-Mo steels. They showed
that the crack growth rate increases with the material strength, the applied stress in-
tensity factor and high-pressure hydrogen. Hydrogen pressure could greatly reduce the
creep ductility of steels.
It can be concluded that creep crack growth in metals and allo ys involves two dissi-
pative processes: rate-dependent void growth and coalescence along the grain boundary
6
Figure 1.4: Creep caused void growth in silver at ambient temperature.
and time-dependent plasticity deformation in the bulk solid. To model the v oiding
caused damage along the grain boundary at the microscopic level, continuum damage
relations are often used in a smear-out average sense. There are two approaches iden-
tified in the literature. One is the purely phenomenological Kachano v-type continuum
damage relation (Hayhust and Leckie, 1984) in which the rupture process is described
by a scalar damage parameter varying from zero for the undamaged material to unity
at failure. The model is basically phenomenological without introducing any specific
microstructure. At the same time, methane pressure inside the voids under hydrogen
attack conditions are not easy to be incorporated. The other is the micromechanism-
based continuum damage model which takes i nt o account the growth of microscopic
cavities on a certain number of grain boundary facets (van der Giessen, et al., 1996; van
der Burg et al., 1997). However, the latter model is derived from an infinite medium
and does not pro pose approximate plastic potentials for arbitrary non-zero porosities.
A micromechanism-based material model, considering an spherical void embedded in a