Mitochondrial integrity and antioxidative enzyme efficiency in fischer rats effects of ageing and epigallocatechin 3 gallate intervention 6
Bạn đang xem bản rút gọn của tài liệu. Xem và tải ngay bản đầy đủ của tài liệu tại đây (356.37 KB, 63 trang )
92
Finally, the SA-βG activity of HDF from the experimental group was compared
with that from the control group. HDF long-term incubated with 3 and 12.5μM
EGCG significantly delayed the aging process demonstrated by less FDG
fluorescence signals in the treated HDF. Quantification of the X-Gal positively
stained HDF also revealed the lower SA-βG activity in the EGCG-treated HDF as
a result of more juvenile cell status (Figure 20).
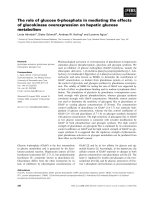
Figure 20. Effects of EGCG on cellular senescence of the middle-aged HDF.
HDF (PDL35) incubated with 3 and 12.5μM EGCG for long term was evaluated
for its cellular senescence status based on the SA-βG activity using FDG and X-
Gal as substrates. Fluorescence signals from FDG staining and blue colored
products from X-Gal staining were quantified and expressed in the unit of RFU
(relative fluorescence unit) and relative area occupied by positive (blue) cells,
respectively; *p<0.05, compared to the untreated group as determined by one-way
ANOVA.
93
4.2.3 Discussions
The anti-cancer effect of EGCG has been reported in several studies. However, so
far as we know, this research is the first in vitro study where EGCG is used to
understand aging and aging-related problems. Initially, the dosages used in the
study were optimized based on the principle that at an appropriate concentration,
EGCG should offer the maximum antioxidant activity but with the minimum
cytotoxicity for the following studies. In the present study, it was found that the
concentrations of EGCG from 1 to 50 μM did not show much cell growth
inhibition within 24 hours (Figure 15A). However, 100 μM of EGCG efficiently
inhibited the growth of both young and old HDF, and the cytotoxicity became
increasingly significant as the incubation time was prolonged (Figure 15A).
Several of the previous studies reported that the growth of the SV40 transformed
human lung fibroblast (WI38VA) was completely inhibited at 40 μM of EGCG,
but it did not have much inhibitory effect on the growth of the normal human lung
fibroblast, WI38. EGCG also inhibited the human colorectal cancer cell line
(Caco-2) and the breast cancer cell line (Hs578T), but had little inhibitory effects
on their respective normal counterparts [118].
In addition, we also investigated the dose dependent radical scavenging activity of
EGCG in MEM growth medium. As shown in Figure 16A, there was a dose
dependent increase of EGCG’s ability to scavenge ROS, but this ability decreased
over time. Furthermore, EGCG was also found to induce H
2
O
2
in dose dependent
manner immediately after it was dissolved in MEM. The highest H
2
O
2
level
was
observed around 110 μM in response to 100 μM EGCG in the first hour and this
concentration started to decrease after 2 hours (Figure 16B). In the presence of
94
HDF, however, the H
2
O
2
production was largely suppressed (Figure 16C). The
lower levels of H
2
O
2
could largely attribute to either the presence of antioxidative
enzymes or catabolic process of H
2
O
2
in the cells [162].
H
2
O
2
is well-known for causing pre-senescence or permanent cell cycle arrest of
HDF [101], thus the H
2
O
2
-treated HDF was widely employed as an in vitro model
to investigate the anti-aging effect of antioxidant [163]. In our short term studies,
H
2
O
2
was
used as an oxidant to induce oxidative stress to HDF. From Figure 17A,
it can be inferred that HDF pretreated with EGCG distinctly increased cell
viability when compared to the untreated HDF after exposure to 100 and 200 μM
H
2
O
2
. As it is well-known, ROS accumulation and depolarization of mitochondria
membrane are positively correlated with aging [155], the protective effect of
EGCG against H
2
O
2
-induced oxidative stress
could largely be due to the decrease
of intracellular ROS level (Figure 17E) and the increase in mitochondrial potential
(Figure 17F).
Furthermore, the decrease in intracellular ROS level upon EGCG treatment could
result from the direct radical scavenging activity of EGCG, or perhaps due to the
EGCG induced increase of antioxidative enzyme activity. In this study, it was
found that in the natural process of aging, there was a general decline of the
antioxidative enzyme activities and gene expressions in HDF. The mRNA levels
of CAT, SOD2 and GPx in old HDF were generally down-regulated (Figure 18A).
Similarly, much lower enzyme activities of SOD1 and GPx were observed in the
senescent cells, whereas there was an age-related increase in SOD2 activity
(Figure 18B). The phenomenon of increased SOD2 activity is consistent with
another observation that senescent keratinocytes also showed an increase of SOD2
95
activity [164]. Such SOD2 activation is probably under the regulation of Rel/NF-
κB, a redox-sensitive transcription factor. By reason of uprising ROS, Rel/NF-κB
might be stimulated and in turn activate SOD2. Another possibility is that since
SOD2 is predominantly present in the mitochondria, it is the first-line defence
against ROS formed in mitochondria. Thus, SOD2 might have adaptively
increased its activity in response to more ROS in the senescent cells. However,
young and old HDF which were pre-treated with 25 and 50 μM EGCG
significantly increased antioxidative enzyme activities and their gene expressions
(Figure 18A and B), with the exceptions that SOD1 activity from the old HDF and
GPx activity from the young HDF were inhibited instead of being boosted. We
hypothesize that this phenomenon could be largely attributed to the antioxidative
effect from EGCG by a cross talk with the enzymatic defense system, namely
CAT, SOD1, SOD2 and GPx. It is also reported that the expression of phase II
enzymes and endogenous antioxidants that detoxify ROS can be up-regulated via
the NF-E2-related factor-2 (Nrf2) pathway [165]. When the cells are exposed to
oxidative stress, electrophiles or chemotherapeutic agents, Nrf2 could escape from
Keap1-mediated repression and activate antioxidant responsive element (ARE)-
dependent gene expressions to maintain cellular redox homeostasis [166]. Taken
together, in the short term studies, EGCG considerably protected HDF from H
2
O
2
-
induced oxidative stress by decreasing ROS level due to the elevation of both
antioxidative enzyme activities and gene expressions.
Long term culturing of HDF till they reach replicative senescence is a better
mimic of the natural aging process as demonstrated by the accumulation of ROS,
depolarization of mitochondrial membrane and deterioration of antioxidative
96
enzyme activities [88]. In virtue of exogenous antioxidant EGCG, however, the
intracellular ROS level was reduced significantly in HDF when compared to the
untreated control (Figure 19A). When looked into the mitochondrial integrity, we
found that both mitochondrial membrane potential and mtDNA were better
protected in the long term treatment (Figure 19B and C). The functional intact
mitochondria might in turn produce less ROS. As observed in the short term study,
EGCG was found to cross-react with the enzymatic antioxidative system and
boost its defense against oxidative stress as well. Figure 19D and E show that
HDF treated with 12.5 μM EGCG largely increased the gene expressions of CAT,
SOD1 and SOD2 compared with the untreated group, and their corresponding
enzyme activities dramatically increased in response to 12.5 μM EGCG as well.
Surprisingly, GPx activity dropped though its gene expression increased the most
among the four enzymes. Such discrepancy between gene expressions and
enzyme activities have been reported in other studies as well [167] which could
probably be explained by a translational block of the synthesis of GPx and the
following activation of the enzyme [168]. Alternatively, GPx activity is
suppressed physiologically so that its transcription is up-regulated to compensate.
Besides, EGCG did successfully delay the aging process and kept the pre-
senescence HDF at a more juvenile status (Figure 20).
4.2.4 Summaries
In this study, we systematically studied the effects of EGCG in aging and aging-
related factors such as ROS accumulation, mitochondria integrity and
antioxidative enzyme efficiency in the in vitro system. So far as we know, this is
97
the first in vitro study directly linking the mitochondrial integrity to the efficiency
of antioxidant defense system in the aging process, which could probably
demonstrate the effects of EGCG well and at the same time serve as a support for
the free radical theory of aging.
However, till now, there are still no conclusive answers as to whether the decrease
of ROS level in the short-term and long-term treatment is due to the direct radical
scavenging activity of EGCG or due to the indirect effect of EGCG in boosting
the antioxidative enzymes defense. We anticipate that the gene knock-out or over
expression techniques will be helpful to answer this question, and further study is
needed to confirm our hypothesis. In addition, it is also possible that as
mitochondria are the main sources of ROS production, their integrity has been
well maintained upon EGCG treatment, thus enabling them to function better and
produce less ROS.
Finally, although the in vitro system is useful for addressing the mechanisms of
aging, this study is only at the beginning stage. Whether the results getting from in
vitro can also be applied on human beings or at least on experimental animals is
still in need of validation and in depth study.
4.3 Part three: Regulation of age-related oxidative damage, mitochondrial
integrity and antioxidative enzyme activity in Fischer 344 rats by the
supplementation of the antioxidant epigallocatechin-3-gallate (Paper III)
4.3.1 Introduction
98
As demonstrated in our previous study in Part one, mitochondrial dysfunction in
old Fischer 344 rats is associated with the decrease in antioxidative enzyme
activities of CAT, GPx, SOD1 and SOD2 [88]. In order to compensate for the
deficiency of antioxidative enzymes, ameliorate the imbalance of redox status, and
possibly maintain the mitochondrial functional integrity, the regimen of long-term
supplementation of antioxidants is recommended, and so far several constructive
observations have been published on these aspects [16, 86, 169]. EGCG, the main
component of the green tea extract, is an antioxidant well-known for its radical
and oxidant scavenging activities. In the Part two study, we have proved the
effects of EGCG in the in vitro model that long-term incubation of human diploid
fibroblast with EGCG results in more juvenile cell status along with the reduction
of intracellular ROS, higher mitochondrial membrane potential and less point
mutation in mtDNA [170]. Moreover, through a cross talk with the enzymatic
defense system, EGCG considerably increases gene expressions of CAT, SOD1,
SOD2 and GPx as well as their enzyme activities [170].
To extend the observations from the in vitro study, we further launch the in vivo
model to investigate the antioxidant and anti-aging effects of EGCG on the
middle-aged male Fischer 344 rats through long-term dietary supplementation of
EGCG. The dose selected (50 mg/kg/day) for rats in the low dose group, is
approximately equivalent to the consumption of 2 cups of green tea (185 mg of
EGCG per cup) by a 70 kg person [93]. We also extend this range by 10-fold to
500 mg/kg/day for rats in the high dose group. Considering that to date, the only
established nutritional intervention that slows aging process is CR [69], an
additional CR group is included in this study to assess the impact of EGCG
99
supplementation. Herein, we systematically investigate the effects of EGCG on
Fischer 344 rats after 6 months of dietary supplementation, including
pharmacological and histopathological studies of liver and kidney functions,
biochemical analysis of the aging-related oxidative stress and activities of
antioxidant enzymes as well as their gene expressions in major organs including
the liver, kidney, heart and brain. Besides, global gene expression profiling by
using high density oligonucleotide microarray further enable us to identify the
possible molecular mechanisms mediating the protection effects of EGCG in the
aging process.
4.3.2 Results
Weights of animal and major organs, as well as food consumption
There were no significant differences in body weight and food intake among all
the four groups during the first 3 weeks. From the fourth week onwards, the
average body weight of CR rats was significantly (p<0.05) lower than the rats in
the other 3 groups in which the body weight of rats did not show much difference
at any time in this study (Table 5). Based on the food intake, the actual EGCG
consumption calculated was 40.47 and 417.1 mg/kg/day in the low and high dose
groups, respectively, which was approximately 20 % lower than the original
design as stated in materials and methods. However, the food intake of rats in the
high dose group was slightly higher than that of the rats in the low dose and
control groups, which indicates that EGCG might positively affect the food intake
(Table 5). On the day of sacrificing, the major organs such as liver, kidney, heart,
brain and spleen were taken out and weighed. It was found that there were no
100
EGCG-related effects on the weight of organs in the low dose, high dose and
control groups but the weights of liver, kidney, heart and spleen in the CR rats
were significantly (p<0.05) lower (Table 5).
101
Table 5. The weights of animals, the major organs, and the food consumptions
Group Body Weight
*
(g) Food Intake (g) Liver (g) Kidney (g) Brain (g) Heart (g) Spleen (g)
Control
431.47±28.01 3.86±0.38 10.17±1.25 1.32±0.12 1.31±0.11 1.94±0.11 1.14±0.14 1.18±0.16
Low dose
424.59±29.88 4.05±0.39 9.84±0.82 1.29±0.09 1.32±0.10 1.94±0.06 1.06±0.08 1.11±0.18
High dose
431.41±23.77 4.17±0.50 10.10±0.98 1.35±0.05 1.38±0.08 1.97±0.09 1.12±0.13 1.18±0.12
CR
269.12±23.41
a,
b
,c
—
6.82±0.65
a,
b
,c
1.05±0.11
a,
b
,c
1.04±0.09
a,
b
,c
1.91±0.04 0.87±0.09
a,
b
,c
0.85±0.15
a,
b
,c
Values are means ± SD (n=11); a,b,c, values are significantly different (p<0.05, one-way ANOVA) compared to the control, low dose and high dose groups,
respectively; * , body weight on the day of sacrificing.
102
Table 6. The histopathology observations in the liver and kidney
Animal Diagnosis Comments
Ctrl
(#1)
Liver: There was mild multifocal portal bile ductular proliferation and lymphocytic and less frequently plasmacytic
infiltrates within the portal areas. There was no evidence of hepatocyte vacuolation with glycogen, lipid or water.
The reticulum stain indicated no change to hepatocyte lobular structure. Nor was there evidence of hepatocyte necrosis.
There was mild variation in hepatocyte nuclear size.
Kidney: There was mild dilation of low numbers of proximal renal tubules which are filled proteinaceous casts but no
evidence of renal tubular necrosis. Small multifocal lymphocytic interstitial infiltrates of lymphocytes and macrophages
Interstitial
nephritis is a
common and
non-specific
inflammatory
change in the
kidney
High
(#4)
Liver: Within portal areas there were bile ductular proliferation and fibroplasias. Some mild infiltrate of lymphocytes and
plasma cells within portal triads. There was no evidence of hepatocyte necrosis. There was mild centrilobular vacuolation
of hepatocytes with clear single lipid droplets, but these were mild and low in number.
Reticulum stain indicated normal hepatocyte lobular architecture.
Kidney: There was fine to amorphous light brown cytoplasm pigment within the cytoplasm of renal cortical epithelial
cells. This is consistent with lipofuscin and aging pigment.
Lipofuscin is
a wear and
tear pigment
common in
older rats and
other animals
Low
(#3)
Liver: There was minimal bile ductular proliferation within portal triads and no evidence of fibrosis. There was no
evidence of hepatocyte necrosis nor was there evidence of hepatocyte vacuolation with glycogen, lipid or water. There
was no significant evidence of karyomegaly or variation in nuclear size of hepatocytes.
The reticulum stain demonstrates normal hepatic lobules.
Kidney: No evidence of renal tubular necrosis or other lesion.
CR
(#1)
Liver: Mild bile ductular proliferation with no evidence of fibrosis in portal areas. There was no significant variation in
nuclear size of hepatocytes. There was no evidence of hepatocyte necrosis or cytoplasmic vacuolation containing lipid,
glycogen or water.
The reticulin stain demonstrated normal morphology to the hepatocyte lobules.
Kidney:
No significant histological changes within the kidney
Bile ductular
proliferation
is a common
change in
older rats.
103
Histopathology diagnose
Histopathology was performed in order to further assess if long-term
supplementation of EGCG at low and high doses causes any damages in the tissue.
Report shows that the morphology of liver and kidney tissues from the randomly
selected rats appeared normal except for some common age-related morphological
changes such as lipofuscin and bile ductular proliferation (Table 6). Such
observations indicated that the concentrations of EGCG used in this study did not
induce any damages in the liver and kidney tissues.
Biochemical analysis of liver and kidney functions
ALT and AST are the common markers of liver disease or damage. The increase
of ALT and AST activities in the serum is typically associated with hepatocellular
membrane damage or distortion as well as leakage of the enzymes from
hepatocytes. Besides, the elevated AP activity is always associated with cirrhosis,
hepatitis, fatty liver, liver tumor, liver metastases as well as drug intoxication. In
this study, there were no statistical differences in the activities of ALT, AST and
AP among the rats with EGCG supplementation as well as the control rats (Table
7). However, ALT and AST levels noticeably decreased by 34.08 and 32.09 %
respectively in the CR rats when compared to the control, probably indicating
better liver functions as a result of caloric restriction (Table 7).
The determination of urea level is useful in assessing kidney functions. In general,
increased urea level is associated with nephritis, renal ischemia, urinary tract
obstruction, and certain extrarenal diseases such as congestive heart failure, liver
diseases and diabetes. In our study, there was no significant difference in the
104
urinary urea among all the experimental groups while in the CR group, the
decrease of urea was 16.71 % of the control (Table 7). Similarly, there was no
obvious change of urea level in the plasma of rats in both EGCG supplementation
groups, whereas its level in the CR rats was significantly (p<0.05) lower than that
in the control rats (Table 7). In general, the kidney function can be determined
from the glomerular filtration rate by testing the creatinine clearance. In this study,
the creatinine clearance increased by 9.45 and 24.63 % in the rats fed with low
and high dose EGCG respectively, and increased by 38.22 % in the CR rats, when
compared to the control (Table 7). Thus, long-term EGCG supplementation
appears to improve the kidney function while it is more apparent in the CR rats.
From the results above, we conclude that both low dose and high dose EGCG are
well tolerated in the male Fischer 344 rats for a period of 6 month without any
detectable damaging effect in the liver or kidney.
105
Table 7. Liver and kidney functions of the male Fischer 344 rats
Liver function index
Renal function index
ALT (U/L) AST (U/L) AP (ng) Urinary urea (mg/dl) Plasma urea (mg/dl) C
Cr
(mL/min/kg of BW)
Control 139.56±56.18 207.50±81.73 0.181±0.018 5667.86±775.59 38.39±1.50 1.494±0.204
Low dose 147.00±53.75 193.18±73.43 0.191±0.015 5908.10±574.29 40.16±2.50 1.650±0.161
High dose 153.11±23.30 209.88±23.39 0.183±0.016 5690.54±585.97 39.39±1.64 1.862±0.133
CR 92.00±11.30
b
,c
140.90±35.32
a,c
0.204±0.025 4720.48±652.13 31.12±1.69
a,
b
,c
2.065±0.211
a
Values for ALT and AST are means ± SD (n=9); all the other values are means ± SE (n=9); a,b,c, values are significantly different (P<0.05, one-way ANOVA)
compared to the control, low dose and high dose groups, respectively.
106
Figure 21. Concentration of H
2
O
2
in the plasma of middle-aged male Fischer
344 rats.
H
2
O
2
concentration was examined as an indicator of oxidative stress in the plasma
after daily dietary supplementation with EGCG at doses of 50 and 500 mg/kg/day
respectively, to the rats in the low and high dose groups, as well as 40% caloric
restriction in the CR rats, for 6 months. Data were presented as mean ± SE (n=9).
*, p<0.05 compared to the control group (Ctrl) as determined by one-way
ANOVA.
Figure 22. Mitochondrial membrane potential of lymphocytes of middle-aged
male Fischer 344 rats.
Mitochondrial potential was evaluated to assess oxidative stress in the peripheral
lymphocytes after daily dietary supplementation with EGCG at doses of 50 and
500 mg/kg/day respectively, to the rats in the low and high dose groups, as well as
40% caloric restriction in the CR rats, for 6 months. Data were presented as mean
± SE (n=9). *, p<0.05 compared to the control group (Ctrl) as determined by one-
way ANOVA.
107
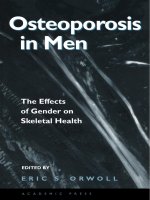
Furthermore, the aging-related oxidative damages including lipid peroxidation and
DNA modification were evaluated in the plasma. MDA measured as an indicator
of lipid peroxidation was considerably reduced in the rats from high dose group
and CR group as compared to the control (Figure 23). 8-OHdG, the product of
DNA oxidative modification, was excreted into the plasma upon the process of
DNA repair. The rats fed with high dose EGCG contained significantly (p<0.05)
less 8-OHdG in the plasma than the control while the reduction of DNA damage
was moderate in the rats from low dose and CR groups (Figure 23).
108
Figure 23. Lipid peroxidation and 8-OHdG in the plasma of middle-aged
male Fischer 344 rats.
Aging related oxidative damages including lipid peroxidation (A) and DNA
modification (B) were checked in the plasma by examining their respective
biomarkers of MDA and 8-OHdG, after daily dietary supplementation with EGCG
at doses of 50 and 500 mg/kg/day respectively, to the rats in the low and high dose
groups, as well as 40% caloric restriction in the CR rats, for 6 months. Data were
presented as mean ± SE (n=9). *, p<0.05 compared to the control group (Ctrl) as
determined by one-way ANOVA.
(A)
(B)
109
Apart from the production of 8-OHdG, the large scale deletion encompassing the
ND4 region in mtDNA is also witnessed commonly due to the oxidative damages
in the aging process. The results from real-time PCR performed with the primers
designed to specifically amplify the ND4 region revealed that there were
relatively more ND4 templates in the liver of rats fed with low and high dose
EGCG, indicating that EGCG dose dependently protected mtDNA against
deletion (Figure 24). However, there was little effect of CR on mtDNA deletion as
observed.
Figure 24. Mitochondrial DNA deletion in the liver of middle-aged male
Fischer 344 rats.
ND4 region in mtDNA encompassing the common aging-related large scale
deletion was amplified by quantitative real-time PCR after daily dietary
supplementation with EGCG at doses of 50 and 500 mg/kg/day respectively, to
the rats in the low and high dose groups, as well as 40% caloric restriction in the
CR rats, for 6 months. Data were presented as mean ± SE (n=9). *, p<0.05
compared to the control group (Ctrl) as determined by one-way ANOVA.
110
Antioxidative enzyme activities and gene expressions
In order to figure out the reason that EGCG considerably reduced the oxidative
damages in the treated rats, we looked into the changes in antioxidative enzyme
activities as well as the gene expressions in response to long-term EGCG
supplementation, since oxidative stress could be closely regulated by the
antioxidative enzymes. Antioxidative enzyme activities were investigated in the
liver, kidney, heart and brain of rats fed with low and high dose EGCG as well as
CR rats. In the liver, CAT activity significantly declined in the rats from the high
dose group, and GPx and SOD1 activity also decreased in a dose dependent
manner (Figure 25A). SOD2 activity increased to some extent without any
statistical differences. In the liver of CR rats, CAT and SOD1 activities decreased
considerably, but not much change was observed in GPx and SOD2 activities
(Figure 25A). In the kidney, the only difference found was the increase of CAT
activity in the low dose group when compared with the control (Figure 25B). In
the heart of the rats, high dose EGCG significantly increased the activities of CAT,
GPx and SOD2, and low dose EGCG considerably increased SOD2 activity but
decreased SOD1 activity (Figure 25C). CR intervention greatly elevated CAT
activity, but resulted in a decline in SOD2 activity (Figure 25C). In the brain, the
effect of EGCG was attributed to the reduction of SOD1 activity in the low dose
group and the augmentation of SOD2 activity in the high dose group. CR rats,
however, showed decreased SOD2 activity compared to the control (Figure 25D).
111
Figure 25. Antioxidative enzyme activities in the liver, kidney, heart and
brain of middle-aged male Fischer 344 rats.
The rats dietary supplemented with EGCG at doses of 50 and 500 mg/kg/day
respectively, in the low and high dose groups, as well as the CR rats with 40%
caloric restriction, for 6 months were examined the enzyme activities of CAT,
GPx, SOD1 and SOD2 in the liver (A), kidney (B), heart (C) and brain (D). One
unit of CAT is defined as the amount of enzyme that causes the formation of 1.0
nmol of formaldehyde per min at 25°C. One unit of GPx is defined as the amount
of enzyme that will cause the oxidation of 1.0 nmol of NADPH to NADP+ per
min at 25°C. One unit of SOD is defined as the amount of enzyme needed to
exhibit 50% dismutation of the superoxide radical at 25°C. Data were presented as
mean ± SE (n=9). *, p<0.05 compared to the control group (Ctrl) as determined by
one-way ANOVA.
112
Besides the enzyme activities, the antioxidant system was also evaluated from the
antioxidative enzyme gene expression levels. In the liver, there was not much
change found in the gene expressions as a result of EGCG supplementation except
that GPx expression in the rats from low dose group increased moderately by
45.45 % compared to the control (Figure 26A). Caloric restriction enhanced the
SOD1 expression significantly (p<0.05), but considerably repressed the CAT
expression compared to the control (Figure 26A). Similarly, in the kidney,
decreased expression of GPx was found in the CR rats, but little change was
observed in all the other gene expressions (Figure 26B). In the heart, CR
intervention greatly increased the gene expressions of CAT, GPx, SOD1 and
SOD2 (Figure 26C). In the brain, however, no significant difference was found
among the groups, although low dose and high dose EGCG increased SOD2
expression by 41.59 and 41.20 % respectively compared to the control (Figure
26D).
113
Figure 26. Antioxidative enzyme gene expressions in the liver, kidney, heart
and brain of middle-aged male Fischer 344 rats.
The rats daily dietary supplemented with EGCG at doses of 50 and 500 mg/kg/day
respectively, in the low and high dose groups, as well as the CR rats with 40%
caloric restriction, for 6 months were investigated the relative gene expressions of
CAT, GPx, SOD1 and SOD2 in the liver (A), kidney (B), heart (C) and brain (D).
Results were normalized to the endogenous control nuclear β-actin. Data were
presented as mean ± SE (n=9). *, p<0.05 compared to the control group (Ctrl) as
determined by one-way ANOVA.
114
Microarray analysis
In view of the finding that high dose EGCG effectively attenuated aging-related
oxidative damages both in the plasma and liver, though with limited impact on the
antioxidative defense system, we hypothesize that EGCG should also be able to
control the oxidative damage possibly by regulating other responsive genes.
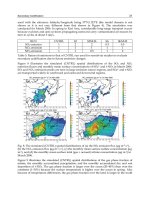
Analyzing the gene expression profile with a total number of 22,227 genes
featured in the microarray revealed that 76 (0.34%) and 162 (0.73%) genes
displayed a change in expression levels greater than 1.5-fold as an effect of EGCG
supplementation and CR, respectively (Figure 27). In the low dose group, 11 out
of 12 genes showed the same trend of regulation as in the high dose group with an
exception of Onecut1, which was up regulated in the rats from the low dose group
but down regulated in the rats from the high dose group (Figure 27). The 75 genes
(47 genes annotated) altered by high dose EGCG are mostly involved in the
metabolism of lipid, glutathione, hexose biosynthesis and response to stress (Table
8). Noticeably, among these 75 genes, there were only 33 overlapping with CR
group (Figure 27), including the 10 genes regulated in diverse directions by
EGCG and CR interventions. Such observations indicate that EGCG and CR
interventions might attenuate aging and aging-related oxidative damages through
different mechanisms. The complete list of well annotated genes with more than
1.5-fold change in response to low dose and high dose EGCG interventions
compared to the control is shown in Table 9.
115
Figure 27. Venn diagram analysis of gene profiling in the middle-aged male
Fischer 344 rats.
The numbers in the figure represent the differentially expressed genes, which are
regulated with more than 1.5-fold changes compared to the control (Ctrl) in the
middle-aged male Fischer 344 rats after dietary supplemented with EGCG at daily
doses of 50 and 500 mg/kg/day respectively, in the low and high dose groups, as
well as rats with 40% caloric restriction, for 6 months. Total RNA from the liver
was used in triplicates as start material for each group.
116
Table 8. Global views of transcriptional changes induced by EGCG
supplementation and caloric restriction
Functional groups EGCG
(High)
CR
Protein metabolism
Protein turnover ↑ ↑
Energy metabolism
Gluconeogenesis
↓
↑
Fatty acid catabolism ↑ ↓
Biosynthesis
Lipid metabolism ↑ ↑
Steroid biosynthesis ↑ ↑
Nucleotide precursors ↑ ↑
Generation of precursor metabolites and energy
P450
↓
↑
Stress response
Glutathione biosynthesis ↑ ↑
Response to energy starvation ↑ ↑
Vasodilation* ↑ ↑
Re-entry into mitotic cell cycle ↑ —
Development
Muscle development ↑ —
Cell differentiation ↑ —
Sensory perception of sound & mechanical stimulus ↑ —
* Only obviously detected in the low dose EGCG intervention


![Báo cáo khoa học: Epoxidation of benzo[a]pyrene-7,8-dihydrodiol by human CYP1A1 in reconstituted membranes Effects of charge and nonbilayer phase propensity of the membrane pot](https://media.store123doc.com/images/document/14/rc/ld/medium_ldo1394248806.jpg)