A combined statistical and in silico framework for analysis and characterization of microbial and mammalian metabolic networks
Bạn đang xem bản rút gọn của tài liệu. Xem và tải ngay bản đầy đủ của tài liệu tại đây (8.88 MB, 220 trang )
A COMBINED STATISTICAL AND IN SILICO FRAMEWORK
FOR ANALYSIS AND CHARACTERIZATION OF
MICROBIAL AND MAMMALIAN METABOLIC NETWORKS
SELVARASU SURESH
(B. Tech, University of Madras, Chennai, India)
A THESIS SUBMITTED
FOR THE DEGREE OF DOCTOR OF PHILOSOPHY
DEPARTMENT OF CHEMICAL & BIOMOLECULAR ENGINEERING
NATIONAL UNIVERSITY OF SINGAPORE
2009
1
Acknowledgements
______________________________________________________________________________
It is with great pleasure that I take this opportunity to express my gratitude to all those who have
helped me in my research progress and more so in shaping my PhD into an enriching experience.
The research guidance that I got through my advisors Prof. I. A. Karimi and Dr. Lee Dong-Yup
at NUS was much more than what I had expected. With due respect, I express my sincere
gratitude to them for being wonderful and inspiring supervisors. Without their immense support,
timely inputs, guidance and encouragement my progress was impossible. There is no word to
explain their influence on my research. I also wish to thank them for involving me in several
projects and especially in collaborations with research institutes (BTI) which provided me a very
good chance to learn more. It was indeed a privilege to work with them.
I would like to thank Dr. Victor Wong and Dr. Dave Ow from BTI, Singapore for their immense
help in providing me the experimental data. I appreciate their patience in explaining the nuances
of experimental strategies whenever I approached them. I extend my thanks to A/P. Loh Kai-
Chee and A/P. Sanjay Swarup for their kind acceptance to be on the panel of examiners and for
valuable suggestions for planning this research during the qualifying exam. I also do thank the
final reviewers for spending time on evaluating this thesis. I also express my gratitude to Dr.
Lakshminarayanan for his valuable suggestions at different times during my PhD.
I wish to admire and thank all the unknown reviewers of our publications, who gave constructive
feedbacks on all our manuscripts and helped us to bring the best out of this research. I also take
this opportunity to appreciate and thank all those dedicated researchers who shared their research
2
in the form of literature, website notes, and freely available online data. These informations have
played a major part in strengthening this research work.
I also express my gratitude to all the professors at ChBE/NUS whose valuable lectures/seminars
have resulted into good ideas for this research. Special thanks to Prof. I. A. Karimi and Prof.
Rangaiah for giving me an opportunity to teach undergraduate students (it was en enriching
experience for me at NUS) that fetched me best tutor award. It is indeed an honor. I also thank
ChBE department for financially supporting all my conference visits.
Special thanks to all my labmates and other friends at NUS (if I start naming them the list would
keep rolling) for their affectionate support and interactions that made my journey in NUS, a
wonderful experience. I would also thank all the GSA office bearers for helping me in one way
or the other and bringing the best out of me at different times during GSA activities. Lastly, I
thank all my professors, students and affectionate friends who trained and inspired me to be what
I am today. I will cherish this wonderful journey for long.
And most importantly, I thank my parents (Mr. Selvarasu, and Mrs. Vijaya), my sister (Mrs.
Veni), my niece and nephew (Dharani and Nirmal) for always being my source of inspiration.
Their love, continued support and motivation were the main driving force for me during my
PhD. I am ever grateful and indebted for their care and affection.
Contents
________________________________________________________________________
i
Table of Contents
List of Tables v
List of Figures vi
Nomenclature x
Abbreviations xi
SUMMARY xii
1 Introduction 1
1.1 Cellular organisms and their complex functioning 1
1.2 Systems biology a new paradigm in biological research 2
1.2.1 Knowledge required for systems biology 3
1.2.2 Approaches in systems biology 5
1.2.3 Opportunities to unravel biological functions 6
1.3 Analysis techniques available in the data rich environment 7
1.4 Motivation for research 8
1.5 Scope of the present work 10
1.6 Organization of the thesis 11
2 Modeling and analysis of biological systems: An overview 14
2.1 Tools available for modeling biological systems 15
2.2 Genome-scale modeling 17
2.3 Constraints-based modeling approach 18
2.4 Other metabolic network simulations 19
2.5 Algorithms available for characterizing metabolic networks 27
2.6 Systems biotechnology: An approach for systematic strain improvement 29
2.7 In silico techniques available for strain improvement 29
2.8 Tools for multivariate data analyses 31
2.9 Research directions 33
3 Framework for combined analysis using statistical and in silico approaches 35
3.1 Introduction 35
3.2 Experimental data and their trend 36
3.3 Data preprocessing and elemental balancing 38
Contents
________________________________________________________________________
ii
3.3.1 Cumulative consumption and specific rates calculation 39
3.4 Multivariate statistical data analysis (PCA and PLS) 42
3.4.1 Principal component analysis (PCA) 42
3.4.2 Partial least squares regression (PLS) 43
3.5 In silico modeling and analysis 43
3.5.1 Metabolic network reconstruction 45
3.5.2 Constraints-based flux analysis 48
3.6 Application of the framework 50
4 Application of framework for characterizing Escherichia coli DH5α growth
and metabolism in a complex medium 51
4.1 Introduction 51
4.2 Materials and methods 53
4.2.1 Strains and culture conditions 53
4.2.2 Analytical techniques 54
4.2.3 Data preprocessing for statistical analysis 55
4.2.4 Constraints-based flux analysis 55
4.3 Results and discussion 56
4.3.1 Growth, metabolite uptake and excretion profiles during batch culture 56
4.3.2 Elemental balancing 60
4.3.3 Multivariate statistical analysis 60
4.3.4 In silico metabolic flux analysis 63
4.3.5 Sensitivity analysis of amino acid and glucose consumption 71
4.3.6 Analysis of the metabolite consumption and utilization 72
4.3.7 Availability of other nutrients in the medium 80
4.3.8 Exploring the statistical analysis results using in silico analysis 82
4.4 Concluding remarks 84
5 Genome-scale modeling and in silico analysis of mouse cell metabolism 86
5.1 Introduction 86
5.2 Materials and methods 88
5.2.1 Metabolic network reconstruction 88
5.2.2 Network visualization 91
Contents
________________________________________________________________________
iii
5.2.3 Statistical network analysis 92
5.2.4 Constraints-based flux analysis 92
5.3 Results and discussion 93
5.3.1 Genome-scale reconstruction of mouse metabolic network 93
5.3.2 Comparison of mouse model with yeast and E. coli genome-scale
models 97
5.3.3 In silico model validation 99
5.3.4 Structural and functional characterization of mouse metabolism 104
5.3.5 Important role of lipid pathway in mouse metabolism 112
5.3.6 Alternate flux distributions and flux variations 114
5.4 Conclusion 116
6 Application of framework to elucidate mouse hybridoma cell growth and
metabolism in a fed-batch culture 118
6.1 Introduction 118
6.2 Materials and methods 121
6.2.1 Cell line and culture medium 121
6.2.2 Analytical techniques 122
6.2.3 Data preprocessing for statistical analysis 122
6.2.4 Constraints-based flux analysis 124
6.3 Results and discussion 125
6.3.1 Fed batch cell culture 125
6.3.2 Elemental Balancing on Fed-batch Data 130
6.3.3 Multivariate Statistical Analysis 132
6.3.4 In silico metabolic flux analysis 136
6.3.5 Other possible cellular objectives 153
6.3.6 Understanding cellular behavior from combined analysis 154
6.4 Conclusion 157
7 Identification of necessary genes and evaluating their perturbations for strain
improvement in E. coli 159
7.1 Introduction 159
7.2 Algorithm for identifying sufficient and necessary genes 160
Contents
________________________________________________________________________
iv
7.2.1 Mathematical formulations and algorithm 161
7.2.2 Identifying set of necessary genes 163
7.3 Application of the algorithm 165
7.3.1 Analysis in E. coli DH5α metabolic network 165
7.4 Application of the necessary gene sets to identify knockout combinations for
succinate production 168
7.5 Concluding remarks 172
8 Contributions and future recommendations 173
8.1 Summary of the contributions 173
8.2 Future directions 177
8.2.1 Expanding the horizon of mouse cell metabolism 177
8.2.2 Reconstruction of metabolic network of CHO cell lines 180
References 182
Appendices 197
List of Publications 198
VITAE 200
Tables
________________________________________________________________________
v
List of Tables
Table Page
2.1 List of available genome-scale models for various organisms 20
3.1 List of public resources available for reconstruction of genome-scale metabolic
models
*
47
4.1 Comparison of metabolic reaction fluxes of amino acids biosynthetic reactions 73
4.2 Sensitivity of amino acids, glucose and trehalose uptake on cell biomass
production in phase 1
a
74
4.3 Sensitivity of amino acids, glucose and trehalose uptake on cell biomass
production in phase 2
a
75
4.4 Consumption or production of amino acids for biosynthetic demand as well as for
other metabolites production in phase 1
a
77
4.5 Consumption or production of amino acids for biosynthetic demand as well as for
other metabolites production in phase 2
a
78
4.6 Comparison of ATP consuming metabolic pathways for complex and minimal
medium conditions 79
5.1 Online resources for reconstructing genome-scale mouse metabolic network 89
5.2 Characteristics of the mouse genome-scale metabolic network and its comparison
with the previous generic model 95
5.3 Comparison of mouse genome-scale network characteristics with yeast and E. coli
networks 98
5.4 Comparison of conserved reactions among the three genome-scale metabolic
models 98
5.5 Comparison of essential genes for cell growth between in silico and in vivo
experiments 103
6.1 Summary of specific consumption or production rate of measured metabolites
during the exponential growth phase of the cell culture
a
123
6.2 Production and utilization of pyruvate in central metabolism during the exponential
growth phase of the cell culture
a
141
6.3 Energy production from central carbon metabolism in all states
a
144
7.1 List of necessary reactions for both cell growth and succinate production 167
7.2 List of double knockout gene combinations that enhances succinate production in
E. coli DH5α 170
Figures
________________________________________________________________________
vi
List of Figures
Figure Page
1.1 Interaction of the different expertise in performing a systems biology research. 4
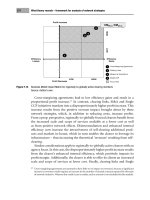
1.2 Flowchart showing the major focus of the current research work and the
organization of the addressed research issues in different chapters of the thesis. 13
2.1 Genome-scale reconstruction of metabolic network and elucidation of the systemic
properties using constraints-based analysis approach 22
3.1 Schematic illustration of the workflow involved in the analysis using combined
statistical and in silico framework 37
4.1 Profiles of optical cell density and residual concentration of various nutrient
components and products in the complex medium. Highlighted regions correspond
to three different growing phases of the culture. Phase 1: initial exponential growth
phase; phase 2: late exponential growth phase; phase 3: acetate consumption phase.
A: Optical density values (OD600), concentration of glucose, trehalose and
acetate. B: concentration of amino acids which were rapidly consumed; L-aspartate
(ASP), glycine (GLY), L-proline (PRO), L-methionine (MET), L-serine (SER), L-
asparagine (ASN), L-tyrosine (TYR), L-threonine (THR), L-glutamate (GLU) and
L-alanine (ALA). C: concentration of amino acids which were not completely
consumed; L-valine (VAL), L-lysine (LYS), L-isoleucine (ILE), L-leucine (LEU),
L-phenylalanine (PHE), L-histidine (HIS) and L-arginine (ARG). 59
4.2 Results obtained from multivariate statistical analysis 61
4.3 Results of PLS analysis. Black arrows indicate positive correlation between those
amino acids and cell growth. Dotted arrows indicate positive correlation between
those amino acids and acetate production. The negative effect of set of amino acids
on acetate is shown using bold lines and on cell growth is shown with dashed line.
A: correlation based on PLS and B: strategies for feed medium design for
enhancing cell viability. 62
4.4 Specific consumption rates of all the measured nutrients and specific growth rate
during initial exponential phase (phase 1) and the late growth phase (phase 2). The
value for histidine in phase 1 corresponds to its specific production rate. The rates
are ranked according to their specific consumption rates in phase 1 65
4.5 Schematic diagrams of metabolic flux distributions and flux-sum across the
metabolites serine, pyruvate and acetate. A: Metabolic flux distribution across the
central metabolic pathways and amino acids biosynthetic pathways during the
exponential growth phase (phase 1: underlined) and late growth phase (phase 2:
normal) of the microbial culture. Reactions with higher flux values are highlighted
with red (phase 1) and green (phase 2). Serine, pyruvate and acetate are
highlighted with squares. B: consumption and production of the metabolites serine,
pyruvate and acetate are shown using the flux-sum values across each of the
Figures
________________________________________________________________________
vii
metabolites for phase 1 and phase 2. Percentage contributions to each of the
metabolites are also shown. PEP, Phosphoenolpyruvate; GLC, glucose; PYR,
pyruvate; GLY, glycine; TRE, trehalose; MAL, L-malate; TRP, L-tryptopan;
ALAC-S, (S)-2-acetolactate; ACCOA, acetyl coenzyme A; 23DHDP, 2,3-
dihydrodipicolinate; 2AHBUT, (S)-2-Aceto-2-hydroxybutanoate; ACSER, O-
acetyl-L-serine; PS_EC, phosphatidylserine; CIT, citrate. Annotation of other
metabolites follows that of the iJR904 model (Reed et al., 2003) 68
4.6 Interpretation of statistical and in silico analysis results. A: set of positively
correlated amino acids with cell growth and acetate production and the
intracellular conversion of amino acids into various metabolites. B: the plausible
effect of reducing amino acids (gly, ile, val and his) in the complex medium at the
intracellular level. Arrow with bold outline: positive correlation with cell growth
and arrow with dashed line: positive correlation with acetate production 83
5.1 Schematic representation of the iterative approach employed in the reconstruction
and analysis of genome-scale mouse model. The existing model was used as
template and the network was expanded by compiling the information (genome,
biochemical and mouse physiological data). Missing links and redundant reactions
were then identified to refine the model with such available resources. The
resultant expanded model underwent the validation process using constraints-based
flux analysis with cell culture and in vivo gene essentiality data for verifying the
prediction. The presence of knowledge gaps was explored and again the model can
be improved interactively. Subsequently, the model was analyzed both structurally
and functionally to characterize mouse metabolism and identify key pathways,
reactions and metabolites. 90
5.2 Functional classifications of metabolic reactions in mouse genome-scale model,
(A) current updated model and (B) old model. Numbers on pie charts indicate
reactions in each subsystem. Metabolic subsystems with number of gene and non-
gene associated reactions are detailed in the table 96
5.3 Comparison of metabolites across mouse, yeast and E. coli genome-scale models.
Metabolites from cytosol were only considered for comparison 99
5.4 Comparison of in silico growth rate with experimentally observed growth rate
during batch culture. Specific growth rate is in h
-1
; mAb production rate in mg
gDCW
-1
h
-1
. The bars with black and white colors represent specific consumption
and production rates, respectively 101
5.5 Comparison of in silico substrate requirements with experimentally observed
substrate requirements for cell growth. Essential nutrients in the media are
highlighted in red colour and non-essential nutrients are highlighted in blue colour 102
5.6 The connectivity of metabolites in different reactions in the metabolic network.
The reactions involved in significantly improved metabolic subsystems such as
carbohydrates, lipids and amino acids metabolisms are indicated by their edge
colours: green, blue and red, respectively. Metabolites colors: blue - cytosol, red -
Figures
________________________________________________________________________
viii
mitochondria, green - extracellular and yellow - cofactors. Metabolites and
reactions from amino acids, lipids and carbohydrates metabolism were extracted to
draw individual edge generated graphs. Essential reactions and metabolites in the
sub networks are highlighted using cross and star-shaped nodes. Network diameter
and average path lengths (APL) for the main network and the three sub-networks
are also shown 106
5.7 Correlation between metabolite degree and betweenness centrality for (A) all
metabolites, (B) essential metabolites and (C) non-essential metabolites. The
metabolite can be identified as essential when its removal leads to no growth.
Highly-connected, bridging metabolites are highlighted in (A). ACP: acyl carrier
protein, ACCOA: acetyl-coA, ACCOAm: acetyl-coA mitochondiral, AKG: α-
ketoglutarate, AKGm: α-ketoglutarate mitochondrial, AMASA: L-2-
Aminoadipate-6-semialdehyde, ANA: N-acetylneuraminate, CAR: carnitine,
GLAC: D-galactose, GLC: D-glucose, GLU: L-glutamate, GLY: glycine,
MALACP: malonyl-[acyl-carrier-protein], PPIXm: Protoporphyrin mitochondrial,
PYR: pyruvate, SAH: S-adenosyl-L-homocysteine, SAM: S-adenosyl-L-
methionine, SUCC: succinate, SER: L-serine and URI: uridine 107
5.8 Visualization of the ACCOA interaction across lipid metabolism, TCA cycle and
glycolysis. The enlarged section shows the high connectivity and bridging
characteristics of ACCOA. Blue edges: lipid metabolic reactions, green: TCA
cycle and red: glycolysis. ACCOA: acetyl-coA 108
5.9 Comparison of (A) metabolite flux-sum and (B) metabolic flux distribution during
cell growth under normal and AKG deletion conditions. Metabolites flux sum and
flux distributions in carbohydrates and nucleotides metabolisms are shown in the
enlarged sections. Blue and red color bars represent normal and AKG deletion
conditions, respectively. AKG: α-ketoglutarate 110
5.10 Classification of essential (A) reactions and (B) metabolites according to different
metabolic subsystems in the mouse metabolism 113
5.11 Reaction usages in multiple optimal flux distribution. The graph shows the fraction
of the metabolic flux distributions that utilize a specific reaction categorized under
different subsystems 115
6.1 Profiles of viable cell density, mAb, amino acids, glucose, OUR, lactate and
ammonia in the fed batch culture. A: Viable cell density and mAb concentration.
B: Glucose, glutamine, OUR, lactate and ammonia concentrations. C:
Concentration profiles of all essential amino acids D: Non-essential amino acids
concentrations. mAb- monoclonal antibodies (IgG1); ARG- arginine; THR-
threonine; SER- serine; GLY- glycine; TYR- tyrosine; PHE- phenylalanine; MET-
methionine; HIS- histidine; ASN- asparagine; ASP- aspartate; LYS- lysine; VAL-
valine; ILE- isoleucine; GLU- glutamate; LEU- leucine; ALA- alanine; GLN-
glutamine; GLC- glucose; LAC- lactate; NH3- ammonia; OUR- oxygen uptake
rate. The concentration of amino acids tryptopan, cysteine and proline were
negligible 128
Figures
________________________________________________________________________
ix
6.2 Summary of the results from multivariate statistical analysis using PCA and PLS
for fed-batch mouse hybridoma cell culture. Amino acids consumption/production
rates were clustered using PCA. Correlation between the variables obtained from
PLS analysis is also shown. PCA- Principal Component Analysis; PLS- Partial
Least Squares 135
6.3 Schematic illustration of the correlation identified by PLS analysis. Dotted lines
indicate the negative interaction of the amino acids (asp, glu and ala) with cell
growth and mAb production rate 136
6.4 Experimental and simulated growth rates for different time points during the
exponential growth phase of the culture 138
6.5 Metabolic flux distributions across the carbohydrate metabolism in hybridoma
cells. Flux across the three pathways including glycolysis, pentose phosphate
pathway and TCA cycle are shown for all the 12 time points during the exponential
growth phase 140
6.6 Overall distributions of simulated internal fluxes across different metabolic
pathways on the left for time point V in Figure 3. The expanded region on the right
details the simulated flux values within the central carbon metabolism. Bar length
and the direction indicates the minimum and maximum possible flux values
achieved by flux variability analysis 142
6.7 The resulting flux distributions from MFA illustrate consumption of all essential
and non-essential amino acids from the media and subsequent utilization of all
essential amino acids for the production of non-essential amino acids within the
cell. 149
6.8 Metabolic activities of the consumed nutrients inside the cell. Metabolites in purple
colour, EAA; green, NEAA, black, ala, glu, lac and NH
3
; red, cell growth and
mAb. EAA, essential amino acids; NEAA, non-essential amino acids 156
7.1 The algorithm represents an iterative the method to identify the set of sufficient
genes and their corresponding reactions. For executing the algorithm the cellular
objectives (growth, biochemical productions) are fixed at different levels of their
maximum values and minimum sets of genes are determined 162
7.2 Illustration of sufficient genes identification approach. Circles 1, 2, and 3 represent
different levels of cellular objectives. The shaded region in dark circle shows the
essential set of genes for achieving cellular objective values for all the three cases
and the remaining regions correspond to necessary genes 163
7.3 Number of sufficient genes required for maintaining cell growth rates 166
7.4 Succinate production limits for wild type and the mutants. The bold line indicates
the limits for wild type strain and the points indicate double knockout mutants.
Red color circle: result of SUCD1i/SUCD4 and NADH6 knockout. Blue color
circle: result of SUCD1i and PGL. Other combinations are described in table 7.2 168
Nomenclature
________________________________________________________________________
x
Nomenclature
V Culture volume (ml)
X
v
Viable cell concentration (10
6
cells
-1
ml
-1
)
µ
Specific growth rate (h
-1
)
q
s
Specific substrate consumption rate (mmol h
-1
cell
-1
)
q
p
Specific production rate (mmol h
-1
cell
-1
)
S Substrate concentration (mM)
P Product concentration (mM)
S
f
, Substrate feed concentration (mM)
P
f
Product feed concentration (mM)
F Feed flow rate (ml h
-1
)
t Time (h)
v
j
Reaction flux (mmol gDCW
-1
h
-1
)
α
j
Lower bound for reaction flux (mmol gDCW
-1
h
-1
)
β
j
Upper bound for reaction flux (mmol gDCW
-1
h
-1
)
S
ij
Stoichiometric coefficient of metabolite i in reaction j (dimensionless)
Z objective function in the optimization problem
c
j
Weight associated with the reaction fluxes in objective function (dimensionless)
M Number of metabolites in the network (dimensionless)
N Number of reactions in the network (dimensionless)
Subscripts
s Substrate
p Product
v Viability
i Metabolites
j Reactions
Abbreviations
________________________________________________________________________
xi
Abbreviations
FBA Flux Balance Analysis
GAMS The General Algebraic Modeling System
IgG1 Immunoglobulin G
LP Linear Programming
mAb Monoclonal Antibody
MDS Multidimensional Scaling
MFA Metabolic Flux Analysis
MILP Mixed Integer Linear Programming
MINLP Mixed Integer Nonlinear Programming
MOMA Minimization of Metabolic Adjustments
OMNI Optimal Metabolic network identification
PCA Principal Component Analysis
PCR Principal Component Regression
PLS Partial Least Squares regression
QP Quadratic Programming
ROOM Regulatory On/Off Minimization
Summary
________________________________________________________________________
xii
SUMMARY
________________________________________________________________________
With advances in new experimental technologies, high throughput experimental data are
generated for describing micro/ macro-molecular cell functions of complex biological
systems. Understanding these functions is essential for improvements in biomedical
research and more importantly for biotechnological processes. Microbial and mammalian
cells are commonly used by these processes for producing very high-value therapeutics.
In recent years, there is an increasing demand for these compounds that points to the need
for improved cell culture performance. However, there are complexities associated with
the cell culture mainly due to deviations in the culture conditions, heterogeneous
interactions among different variables in the culture and between different cellular
components, which make it difficult to elucidate the cellular functions. In addition,
accumulation toxic metabolites in the culture also lead to reduced productivity or cell
death. These complexities pose a major challenge in developing high yielding cell
cultures. Motivated from these challenges, the main objectives of this research include
reviewing potential unresolved issues pertaining to understanding the complex
functionalities associated with microbial/ mammalian metabolisms, and resolving them
using suitable techniques, which would enable us to improve the performance of
fermentation processes for producing high-value therapeutics.
Multivariate statistical techniques have often been used to extract biologically
relevant information from the high throughput experimental data, even though they do
Summary
________________________________________________________________________
xiii
not provide any insights into the organism’s internal cell metabolic activities. To deal
with this, genome-scale modeling approaches can be useful in improving our
understanding of the internal cellular metabolism of organisms. Thus, these two
approaches can be concomitantly used to better understand and characterize the complex
microbial and mammalian cellular systems.
The emphasis of this research is to develop a framework by systematically
combining both statistical and in silico approaches to identify important nutrient
components in a culture media based on the experimental data and to study the effect of
these components on the internal metabolic behavior of cellular systems. This
understanding would be crucial for modifying/designing organisms for enhancing
byproduct yield and in developing efficient biotechnological processes
The major research issues addressed in this work and their corresponding outcomes are:
Combined framework: The first part of the thesis involves development of the
combined framework using multivariate statistical analysis techniques and in silico
modeling approaches for characterizing cell culture fermentation and exploring the
internal cell metabolism. The most relevant statistical methods for examining the
experimental data are described. Subsequently, various steps and procedure involved in
reconstructing a genome-scale metabolic model and conducting in silico analysis are also
detailed.
Application to microbial system: The second part of the thesis includes application of
the framework to microbial metabolic networks. E. coli was chosen as the model
organism due to its applicability to biotechnological processes. The framework was
Summary
________________________________________________________________________
xiv
applied to examine the growth and metabolism of E. coli DH5α strain grown in a
complex medium. Highly correlated nutrients from the culture media were obtained using
statistical analysis and the effect of nutrient consumption on intracellular metabolism was
explored using constraints-based genome-scale modeling.
Application to mammalian system: The third part of the thesis considers analysis and
characterization of mammalian metabolic system. In this case, mouse cell lines were used
due to their high degree of application to both biomedical and biotechnological
communities. Initially, we have reconstructed the mouse cell metabolic network by
resorting to the genome-scale modeling approach and investigated its structural properties.
Subsequently, statistical analysis was performed for a fed-batch culture of mouse
hybridoma cells grown in a complex medium, producing IgG1 (monoclonal antibody). In
silico analysis was then performed using the reconstructed model to elucidate the internal
metabolic states of mouse cells based on the observations from statistical analysis.
Strain improvement strategies: The last part of the thesis deals with the development of
a novel optimization algorithm to identify set of necessary genes/reactions in the
metabolic network for cell growth and byproduct production. This algorithm can be used
to select gene knockout candidates for mutant phenotypes that can enhance the yield of
desired byproducts (ex. amino acids, succinate, etc.). The applicability of this approach
can be easily tested and verified experimentally for developing high-yielding microbial/
mammalian cell lines.
Chapter 1: Introduction
________________________________________________________________________
1
1 Introduction
________________________________________________________________________
1.1 Cellular organisms and their complex functioning
Cellular functions are often complex due to the high degree of interaction among various
molecules and organelles within a cell and across cells. Based on the level of these
internal complexities, living cells/systems have been mainly classified into prokaryotes
and eukaryotes. Prokaryotes possess simplest cell structure. Nevertheless, their
functioning is highly complex due to their molecular interactions at different time and
spatial scales. Eukaryotes exhibit much more complex functions due to the presence of
different organelles within the cell thus making it even harder for understanding their
functions. Until recently most of the biological research was devoted to understand the
properties of isolated molecules by reducing the complexity involved in biological
systems. However, in reality, cell functions will definitely vary under interactions. The
presence of surrounding molecules in a cellular environment may result in activation,
suppression, or regulation of a molecule. Thus, functions that arise from the interaction of
different molecules cannot be easily understood/ predicted by studying isolated molecules.
Often biological systems vary significantly from physical systems due to their complex
microscopic and macroscopic behavior resulting from the interactions of several
thousands to few millions of different components (Hartwell et al. 1999). This entails the
need for a higher level of approach for handling the complexities as well as integrating
functionalities and interactions at different levels for elucidating cellular functions both at
Chapter 1: Introduction
________________________________________________________________________
2
microscopic and macroscopic levels. Such inferences are not easily achieved by the
conventional reductionist approach.
The availability of genome sequences for different microbial and mammalian
organisms and technological advancements in the field of genomics and high-throughput
experimental techniques have generated wealth of biological data that give information
on genes, mRNA, proteins, and metabolic products and their functions. So far, biologists
have not effectively utilized these billions of data due to the challenges involved in
integrating them. This complexity is coupled with the difficulty involved in integrating
different cellular organelle functioning. Such integration underlies the emergence of
“Systems Biology”, an interdisciplinary research field that aims to develop a quantitative
understanding of cellular functions. It involves characterizing different components of a
biological system using the knowledge and techniques of systems engineering (Kitano
2002). The Post-genomic era of cellular biology can focus on utilizing this approach to
understand the mechanisms through which biological functions emerge due to the
interaction of numerous molecular components.
1.2 Systems biology a new paradigm in biological research
Systems biology is a new scientific discipline that studies the behavior of complex
biological organizations through the integration of diverse quantitative information and
mathematical modeling to generate predictive hypotheses and elucidate the functions of a
biological system (Aderem 2005; Hartwell et al. 1999; Hood et al. 2004; Westerhoff and
Palsson 2004). Although engineers have applied the concept of integrating systems
behavior of biological systems for years, the term systems biology came into emergence
Chapter 1: Introduction
________________________________________________________________________
3
as a distinct research paradigm only in recent years. The significance of this
interdisciplinary research area is evident from the number publications available in the
name of systems biology in ISI web of science search. The number of articles in the topic
systems biology was merely 9 in 2001. This has grown several folds in recent years to an
extent that the number of such articles has exceeded 1000 in 2008 (ISI web of science).
Systems biology research has been propelled by the successes of molecular biology
and genetics, which have made genomic blueprints of numerous organisms, together with
extensive experimental data covering most aspects of cell functions. They also present an
opportunity for a significant role of theory that can guide experiments by developing
increasingly complex hypotheses, formed on the basis of modeling the phenomena and
analyzing genomic and other experimental data. Beyond the cell level, systems biology
addresses questions of how multi-cellular organisms develop and function, and how
populations interact on the ecological scale.
1.2.1 Knowledge required for systems biology
The progress in systems biology requires a deep and detailed understanding of biological
systems, which is essential for identifying the "right” questions. It requires development
of novel concepts geared towards living systems, which are extremely heterogeneous,
non-generic and nontrivially coupled to the environment. Since it is an intrinsically
interdisciplinary research, it involves expertise and perspectives from different disciplines
such as engineering, biology, computer science, physics, chemistry and mathematics.
Ideas and concepts from these diversified fields will enrich physical science as it strives
to describe the complexity of living matter. Biology provides a complementary
Chapter 1: Introduction
________________________________________________________________________
4
perspective from which to consider, analyze, and ultimately understand the living world,
whereas physics and chemistry come handy in probing the behavior of molecules and
their activity inside living cells. Engineering applications can effectively harness the
power of the living system and solve problems that cannot be solved in any other way.
Mathematics is important in developing accurate first principle models of a biological
system (to start with a small subsystem of a single cell) and then predicting dynamics
over time.
Figure 1.1 Interaction of the different expertise in performing a systems biology research.
Advanced technical expertise from bioinformatics, computation, statistical analysis,
and mathematical modeling are all pivotal for integrating and making sense of large and
complex datasets generated through high throughput experimental techniques. Through
integration and modeling, these studies would allow us to better exploit the complexity of
genomics and extract their biological and clinical significance. The integration and
modeling of such diverse information can vastly enhance the power of systems biology
approach and it would help us to decipher the mechanism behind the metabolic behavior
Chapter 1: Introduction
________________________________________________________________________
5
and provide new insights for exploration. This new technology can also be further
explored with various analyses, modeling, simulations, and design techniques that are
precisely used in electronic, control and system engineering. Furthermore a combined
effort by science, engineering and mathematics can be useful in exploring the complex
functional interactions of the system (Fig 2.1).
1.2.2 Approaches in systems biology
Model driven analyses and their experimental validations are the two major components
of systems biology research. Analysis of biological systems using this approach can be
mainly categorized into two types. The first one is quantitative systems biology that deals
with the extraction of quantified information such as molecular responses in a biological
system to a given perturbation. Some of the technology platforms used for this approach
is:
• Gene expression measurement through DNA micro arrays and SAGE
• Protein levels through two-dimensional gel electrophoresis and mass spectrometry,
including phosphoproteomics and other methods to detect chemically modified
proteins.
• Metabolomics for small-molecule metabolites
• Glycomics for sugars
These techniques are frequently combined with large-scale perturbation methods,
including gene-based (RNAi, misexpression of wild type and mutant genes) and chemical
approaches using small molecule libraries. Robots and automated sensors enable such
Chapter 1: Introduction
________________________________________________________________________
6
large-scale experimentation and data acquisition. These technologies are still emerging
and many face problems that the larger the quantity of data produced, the lower the
quality. A wide variety of quantitative scientists (computational biologists, statisticians,
mathematicians, computer scientists, engineers, and physicists) are working to improve
the quality of these approaches and to create, refine, and retest the models until the
predicted behavior accurately reflects the phenotype seen.
The second category in systems biology is utilized for deriving qualitative
predictions using knowledge from molecular biology to develop causal models
mimicking biological system of interest and proposing hypotheses that explain the
systemic properties. These hypotheses can then be confirmed and used as a basis for
developing mathematical models for the system. The causal models are used to explain
the effects of biological perturbations qualitatively while mathematical models are used
to predict how different perturbations in the system's environment affect the system
quantitatively.
1.2.3 Opportunities to unravel biological functions
The two important questions that may arise from using systems biology approach are:
• Is systems biology suitable for exploring most of the complex biological problems?
• What kind of opportunities and challenges that this field of research provides and
what would be the intellectual outcome in future?
The main goal of systems biology is to utilize the knowledge available in systems
engineering and to get clear understanding of the basic biological functionalities at
Chapter 1: Introduction
________________________________________________________________________
7
microscopic or macroscopic levels. It can be foreseen that in a few decades from now,
systems biology research will generate a vast amount of new information about life
processes starting from the role of specific genes to the metabolism of whole organisms.
This potential technology can possibly bring about changes in medicine, agriculture,
industry, bioremediation, and energy. When such technology is utilized, the mysteries of
biological evolution can be unlocked and the knowledge gained can be useful for creating
something useful for humankind.
1.3 Analysis techniques available in the data rich environment
Recent advances in experimental techniques, automation, and sophisticated measurement
technology have resulted in high precision, high speed, and high throughput data. This
has initiated an extensive interest and investigations are carried out with the aim of
improving the quality of the data obtained from different biotechnological and
biomedical processes. Huge amount of data sets are available in the public databases and
it is possible to do vast database searches and data mining to extract the information of
biological interest. Increasing number of genomic projects has also accelerated the
availability of datasets that provide information on gene, protein and physiological data
of multitude of organisms. Most of these projects are completed or currently in progress.
The excessive reliance of biotechnological, biopharmaceutical, and biomedical industries
on the vast amount of specified datasets provides an opportunity to apply data processing
techniques to gain knowledge from the generated datasets. However, the complexity of
the data obtained from these experiments poses a serious challenge to research
community. This has resulted in systems level studies for querying and understanding the
biological data sets. Various levels of statistical analysis techniques have been
Chapter 1: Introduction
________________________________________________________________________
8
extensively employed for processing the experimental data and gain valuable
information. The work presented here also attempts to perform statistical data analysis
mainly for the fermentation processes involving microbial and mammalian cell lines
producing different products ranging from important metabolites to recombinant proteins.
1.4 Motivation for research
A detailed literature review of the significance of analyzing complex biological systems
and their functioning is provided in Chapter 2 with important subtopics. The need for
systems level analysis of biological systems, higher confidence on the credibility of
computational analysis techniques, utilization of statistical data processing techniques for
bioprocesses are some of the important features that stand out in recent scientific research
literature. Observations from this review identified important problems yet to be solved
from the following areas:
Systems biology - overview of the current research activities with more emphasis on
computational analysis of complex networks
Statistical analysis techniques - various techniques available for performing data mining
and preprocessing of experimental data obtained from different cell culture experiments
Microbial and mammalian metabolism - available genomic and biochemical
information for microbial and mammalian metabolic systems, their biotechnological
applications, and limitations