Growth and characterisation of cobalt doped zinc oxide 6
Bạn đang xem bản rút gọn của tài liệu. Xem và tải ngay bản đầy đủ của tài liệu tại đây (1.41 MB, 40 trang )
Chapter 6 Origin of ferromagnetism from transport studies
147
CHAPTER
6
ELECTRICAL TRANSPORT PROPERTIES OF Co-
DOPED ZnO
6.1 Introduction
As discussed in Chapter 3, all the samples had been fabricated into Hall bars so
as to carry out systematic studies on the transport properties of Co-doped ZnO. The
electrical transport measurements that had been carried out include temperature-
dependence of resistivity, carrier density, differential conductance, MR and Hall effect.
The differential conductance measurement for DMS is new and is only performed for
the first time in this work (to the best of our knowledge). As the differential
conductance is very sensitive to local environment felt by the carriers, it is a powerful
technique to characterize the uniformity of ZnO:Co. Some preliminary results on the
study of ZnO:Co-superconductor junctions were also presented. The results of
electrical transport properties will be presented first, followed by the discussion of
origin of ferromagnetism in ZnO:Co, in combination with other results discussed in the
previous chapters.
6.2 Differential conductance studies
Inhomogeneity and disorder exist virtually in all types of materials, in
particular in the material system under study, as seen from the structural properties
presented and discussed in Chapter 3. These inhomogeneity and disorder would affect
the electrical transport properties in a profound way. In most of the work reported so
Chapter 6 Origin of ferromagnetism from transport studies
148
far for ZnO:Co, the electrical transport properties only include the resistivity, carrier
concentration and Hall effect. As average parameters, however, these quantities could
not reveal directly how the structural properties were related to the transport properties.
As inhomogeniety and disordering induce potential fluctuations, and in the extreme
case form sub-regions of totally different characteristics, the effects should be reflected
more apparently in the dynamic conductance as a function of the bias voltages. For
instance, in a system in which metallic particles were embedded in a semiconductor
host matrix, one should expect the appearance of Schottky junction behaviour when
the density of nanoparticles exceeds a certain threshold value or when the current path
was confined in a narrow region. Based on these considerations, the dI/dV
xx
versus
V
xx
curves for all the samples were measured at different temperatures. The results
were shown in Figs. 6-1 (a)-(h), respectively. Here the discussion was focused on the
following two aspects: (1) the shape of the conductance curve and (2) the size of the
zero-bias anomaly (ZBA). Before proceeding to discuss the data, the effect of current
induced heating will be commented on. When the bias current increased, it was
unavoidably that the sample would be heated up to a temperature which was higher
than the cryostat temperature. As all the samples under study exhibited a dirty metal
behaviour, the local heating might lead to a higher conductance at a higher bias. As all
the samples under study had almost the same thickness and the Hall bars were of same
dimension, the temperature rise should be inversely proportional to the resistivity of
the sample when the bias voltage was at the same level. Bearing this in mind, the
results from the dI/dV curves will now be discussed.
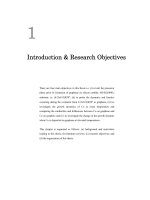
Shown in Fig. 6-1(a) are the dI/dV curves for Al-doped ZnO without Co-
doping. As can be seen from the figure, the differential conductance increased with the
bias voltage at low temperature and becomes almost a constant above 30 K. As the
Chapter 6 Origin of ferromagnetism from transport studies
149
ZBA disappeared at the presence of a magnetic field, it should originate from weak-
localization in this sample. As the sample was further doped with Co, both the shape
and ZBA of the dI/dV curve changed remarkably. As shown in Figs. 6-1(b) - (d) (x
=0.05, 0.14 and 0.2), the differential conductance curves for x < 0.2 had roughly a “V”
shape. With a further increase of Co composition, the low-bias curve evolved
gradually into a “U” or parabolic shape (Fig.6-1 (e)-(h)). The V-shape could be
understood as being caused by electrical-field assisted “de-trapping” of carriers
localized in shallow potential wells. On the other hand, the U-shape and parabolic
curves could be attributed to the transport across grain boundaries which could be of
either a tunnel junction or nanoscale heterojunctions / Schottky junctions,
1
depending
on the electrical characteristics of the secondary phases. Although current induced
heating may also affect the shape of the dI/dV curve, it should not be the dominative
mechanism because the resistivity of the lightly doped samples was almost the same as
that of heavily doped samples (to be discussed shortly).
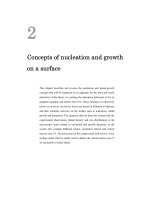
Now we turn to the temperature-dependence of ZBA for different samples, as
shown in Fig. 6-2 ((a)-(h)). In order to have a meaningful comparison, the ZBA was
defined as the conductance ratio between V = 2 V and 0 V, i.e., dI/dV
xx
(2V)/
dI/dV
xx
(0). The ZBA, in principle, can appear in many different situations. In a 4-
point probe measurement configuration like the one used in this study, the influence of
sample-electrode contact could be neglected and, apart from weak localization and
heating effect, the ZBA was mainly caused by electrostatic potential disorder in the
sample. The difference between weak localization and electrostatic potential induced
carrier localization could be readily differentiated from the dependence of ZBA on an
applied magnetic field. The ZBA for ZnO:Al disappeared completely at an applied
field of 1T perpendicular to the sample surface, while those for samples with Co
Chapter 6 Origin of ferromagnetism from transport studies
150
doping were insensitive to the external field. The size of ZBA served as an indicator of
carrier localization strength and the shape of the differential conductance curve helped
to identify the carrier transport mechanism in individual samples. Although currently
there is no theoretical model available to explain quantitatively the shape of
differential conductance curves observed here, clear changes in both the size of ZBA
and shape of the conductance curve as the Co composition was varied had been
observed.
Focussing on the ZBA at 4.2 K, its value initially increased with the Co
composition and reached a maximum at x = 0.25 beyond which it decreased again to
unity at high Co composition. As discussed in Chapter 4, the Co atoms were uniformly
dispersed in the host matrix in samples with x < 0.2. When x increased to 0.25 at the
onset of secondary phase formation, there was a significant increase in the degree of
disorder inside the samples. A further increase of Co composition would in turn lead to
the enhancement of ordering due to formation of percolated secondary phases or Co
clusters. Therefore, the ZBA was expected to increase with the Co composition below
the onset point of secondary phase formation and decreased again after it reached a
maximum value. It was worth noting that the shape of the dI/dV curves was also
different at the two sides of the onset composition. These results demonstrated clearly
the usefulness of this technique to establish the relationship between the structural
properties with the electrical transport properties. As would be shown later, the ZBA
was also correlated with the carrier localization in Co-doped samples.
Chapter 6 Origin of ferromagnetism from transport studies
151
-2 -1 0 1 2
7.58
7.60
7.62
7.64
-3 -2 -1 0 1 2 3
2.45
2.50
2.55
2.60
2.65
-4 -2 0 2 4
1.2
1.4
1.6
1.8
2.0
-3 -2 -1 0 1 2 3
4.4
4.5
4.6
-2 -1 0 1 2
3.55
3.60
3.65
3.70
-2 -1 0 1 2
1.958
1.960
1.962
1.964
1.966
-6 -4 -2 0 2 4 6
1.15
1.20
1.25
-2 -1 0 1 2
2.6
2.7
2.8
2.9
30K
20K
50K
30K
20K
(b) A (x=0.05)
G (10
-3
S)
Voltage (V)
(d) D (x=0.20)
G (10
-3
S)
Voltage (V)
(e) F (x=0.25)
G (10
-4
S)
Voltage (V)
15K
5K
20K
20K
20K
(g) J (x=0.30)
G (10
-3
S)
Voltage (V)
(h) L (x=0.33)
G (10
-3
S)
Voltage (V)
10K
10K
50K
30K
20K
15K
14K
14K
30K
20K
10K
10K
14K
10K
14K
15K
10K
14K
8K
8K
10K
8K
8K
8K
8K
10K
6K
6K
6K
8K
6K
5K 6K
6K
6K
4.2K
4.2K
4.2K
4.2K
4.2K
4.2K
4.2K
4.2K
(a)
G (10
-2
S)
Voltage (V)
(f) G (x = 0.27)
G (10
-3
S)
Voltage (V)
50K
(c) B (x = 0.14)
G (10
-3
S)
Voltage (V)
Figure 6-1 Differential conductance at various temperatures as a function of applied voltage of (a) Al-
doped ZnO and various co-doped samples, with x values indicated.
Chapter 6 Origin of ferromagnetism from transport studies
152
0 100 200 300
0.97
0.99
1.01
0 100 200 300
0.99
1.00
1.01
0 100 200 300
0.95
1.05
1.15
0 100 200
1.02
1.04
1.06
1.08
0 100 200 300
0.5
1.5
2.5
0 100 200 300
0.99
1.04
1.09
0 100 200 300
0.98
1.03
1.08
0 100 200 300
1.00
1.02
1.04
(a)
ZBA
Temperature (K)
(b) A (x=0.05)
ZBA
Temperature (K)
(c) B (x=0.14)
ZBA
Temperature (K)
(d) D (x=0.20)
ZBA
Temperature (K)
(e) F (x=0.25)
ZBA
Temperature (K)
(f) G (x=0.27)
ZBA
Temperature (K)
(g) J (x=0.30)
ZBA
Temperature (K)
(h) L (x=0.33)
ZBA
Temperature (K)
Figure 6-2 Zero bias anomaly as a function of temperature for (a) Al-doped ZnO and various co-
doped samples, with x values indicated.
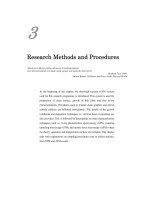
6.3 Temperature and Co composition-dependence of resistivity
From the dI/dV curves at different temperatures for samples with different Co
compositions, one could readily obtain the dependence of resistivity on both
temperature and the Co composition. The dependence of resistivity on the Co
composition is shown in Fig. 6-3 at 4.2 K. The resistivity increased slowly with the
Chapter 6 Origin of ferromagnetism from transport studies
153
increase of Co composition for x < 0.25. After reaching a maximum at x = 0.25, it
decreased with a further increase of the Co composition. The trend was almost the
same as that of the dependence of ZBA on Co composition, as shown in the inset. This
again suggested that the degree of disorder was highest at x = 0.25, the onset
composition of formation of secondary phases.
Figure 6-3 Resistivity versus Co composition at 300 K; Inset shows zero bias anomaly dependence on
Co composition at 4.2 K.
Fig. 6-4 shows the zero-bias resistivity as a function of temperature for samples
with different Co compositions. As could be seen from the figure, all the samples at
low and high Co compositions exhibited a typical “dirty metal” behaviour, while those
in-between behaved like an insulator due to strong disorder caused by the onset of
phase separation. On the other hand, as shown in the inset, the Al-doped ZnO sample
exhibited a weak semiconductor-like behaviour with the resistivity being almost
independent of temperature. Comparing Fig.6-4 with Fig.6-1, one immediately realized
that the dI/dV curves provided more insights into the electrical conduction mechanism
of the samples.
Co composition (%)
0 10 20 30 40
Chapter 6 Origin of ferromagnetism from transport studies
154
Figure 6-4 Resistivity versus temperature for various co-doped samples; Inset shows resistivity versus
temperature for Al-doped ZnO.
6.4 Hall effect
The presence of AHE is considered as one of the strong evidences for intrinsic
ferromagnetism in DMSs.
2,3
However, considering the fact that AHE had also been
reported in ferromagnetic clusters,
4
granular materials
5-7
and inhomogeneous DMS in
the hopping transport regime,
8
the observation of AHE alone cannot support the claim
that the DMS under study is a ferromagnet of intrinsic origin, unless it was correlated
with ferromagnetism observed by other means. Most importantly, secondary phases
and precipitates must be shown to be absent in the sample.
Chapter 6 Origin of ferromagnetism from transport studies
155
Figure 6- 5 Hall voltage as a function of applied magnetic field for (a) Al-doped ZnO and various co-
doped samples, with x values indicated, at 4.2K and 300 K, current applied 0.1mA.
Chapter 6 Origin of ferromagnetism from transport studies
156
Fig. 6-5 shows the Hall voltage as a function of the applied field for different
samples at different temperatures. For non-magnetic samples, it was well known that
the offset due to contact misalignment could be corrected by calculating the Hall
voltage as [V
xy
(B)-V
xy
(-B)]/2. However, for magnetic samples, the offset was
dependent on the magnetic field due to the strong MR effect. Therefore, all the data
shown in Fig. 6-5 had been corrected for the MR effect. However, the correction for
the nonmagnetic field dependent offset by calculating the Hall voltage as [V
xy
(B)-V
xy
(-
B)]/2 had not been carried out because the sample contains an antiferromagnetic phase;
any operation involving [V
xy
(B)-V
xy
(-B)]/2 may lead to a wrong V
xy
– B loop which
would make it difficult to compare the AHE loop with the M-H loop measured by
SQUID. However, [V
xy
(B)-V
xy
(-B)]/2 at the maximum field had been used as the Hall
voltage to calculate the carrier concentrations (to be presented shortly).
As shown in Figs. 6-5 (a)-(c), the Zn
1-x
Co
x
O samples with x < 0.2 showed only
OHE. As the Co concentration increased, the AHE appears in samples with x > 0.25.
The onset composition at which AHE started to appear also coincided with that of the
appearance of secondary phases, i.e., at x = 0.25 in sample F. All other samples (G-L)
with x > 0.25 exhibited very clear AHE characteristics, as shown in Fig. 6-5 (d)-(f) at
4.2K and Fig. 6-5 (g)-(i) at 300K for samples F, G and J, respectively. Therefore, now
it could be concluded that the presence of AHE in films with x > 0.25 was due to
ferromagnetic secondary phases and not due to intrinsic ferromagnetism. Although
clear hysteresis loops had been observed for all the samples by SQUID, there was a
fundamental difference between the samples with x < 0.25 and those with x 0.25. In
the former, the magnetic properties came from magnetic regions which were
electrically “isolated” from each other. On the other hand, the magnetic regions in
Chapter 6 Origin of ferromagnetism from transport studies
157
samples with x 0.25 had reached the electrical percolation threshold, leading to the
observation of AHE.
By now ferromagnetism in samples with x 0.25 had been observed by
SQUID, MCD and AHE. Naturally it would be interesting to know if there is any
correlation between the ferromagnetism observed by different techniques. One of the
possible ways to know this was to compare the hysteresis curves obtained by different
techniques which were shown in Fig. 6-6 for sample H. For the case of using MCD, it
had been shown the loops obtained by light with different photon energies. As could be
seen from the figure, the hysteresis curves obtained by SQUID, Hall and MCD
measured at 2.92 eV (425 nm),
9
were almost identical and matched well each other in
shape. However, the MCD curves measured at other photon energies were obviously
different from those measured by SQUID and AHE. As discussed in the MCD results
in previous chapter, these results suggested that the dominant phase in this sample
indeed consists of Zn-incorporated CoO, which had formed an electrically percolated
network. The curves obtained from MCD at wavelengths near the d-d transition do not
fit the SQUID or Hall results. This might be understood from the fact that the d-d
transitions originate from Co
2+
ions of which not all of them contributed to
ferromagnetism which would be picked up by SQUID and Hall effect. For example,
those inside the antiferromagentic clusters contributed to d-d transitions, but they did
not contributed to SQUID and Hall signals.
Chapter 6 Origin of ferromagnetism from transport studies
158
Figure 6-6 SQUID, AHE and MCD (at various energies) M-H curves for co-doped sample Co32W
(Zn
0.71
Co
0.29
O) at 300 K.
6.5 Temperature-dependence of carrier concentration
The temperature-dependence of carrier concentrations derived from Hall
measurements were shown in Figs. 6-7(a)-(h). The large fluctuation of carrier
concentration for low-resistivity samples was caused by the small OHE signal.
However, it could be seen very clearly that carrier localization indeed occured at low
temperature, < 50 K, in particular in samples with Co composition with x < 0.25. The
high-temperature over low-temperature carrier density ratio agreed well with the same
ratio of ZBA for different samples. This suggested strongly that carriers were localized
in potential wells at low temperature and become de-trapped as temperature increased.
However, the carrier localization did not lead to ferromagnetic ordering in low Co
composition samples.
Chapter 6 Origin of ferromagnetism from transport studies
159
Figure 6-7 Carrier concentration of (a) Al-doped ZnO and various co-doped samples, with x values
indicated, as a function of temperature.
6.6 Magnetoresistance
As showed above, carrier localization indeed occured in ZnO:Co at low
temperature; however, there was no intrinsic ferromagnetic ordering in lightly doped
samples. A question naturally arises here: is there any sp-d interaction in these samples?
Chapter 6 Origin of ferromagnetism from transport studies
160
The MR curves at different temperatures would be able to answer this question. To this
end, the MR had also been measured at various temperatures, from 1.5 to 300 K, in the
field range of -6T to 6T, using the same Hall bars that had been used for differential
conductance and Hall effect measurements. MR is defined as the ratio between
difference in resistance with and without applied magnetic field over resistance at the
maximum applied field. The MR was more sensitive to Co composition than AHE at
low doping levels; thus it allowed us to study s,p-d interactions in samples even if
AHE is absent. For all the measurements, a bias current as small as possible (limited
by the signal-to-noise ratio) had been used, though the possible influence of heating
from current flow, especially at low temperatures, could not be excluded.
The MR curves (Figs. 6-8(a)-(h)) for samples with x < 0.25 were very similar
to those reported in literature.
10-14
In Fig. 6-8 (a), the MR behaviour of Al-doped ZnO
films without Co is shown. A small negative MR was observed, decreasing with
temperature, which was characteristic of weak localization.
10,11,13
With doping of Co (x
≤
0.2), a positive MR appeared at intermediate field values which was superimposed
with a negative MR at both low and high applied magnetic field. At low temperature,
the field at which the MR changed from positive to negative increased with Co
composition but decreased with temperature. Above 10 - 50 K (depending on Co
composition), the MR became negative in the entire field range for samples A, B, C, D
and F (Figs. 6-8(b)-(e)). The negative MR near zero field exhibited a similar field
dependence as that of ZnO:Al; therefore it could be understood as being originated
from the destruction of quantum corrections due to weak-localization. With the further
increase of magnetic field, the spins of Co
2+
ions would become increasingly aligned
and large s-d interaction would lead to a splitting of the conduction band into spin-up
and spin-down sub-bands. The spin splitting of conduction band enhanced electron-
Chapter 6 Origin of ferromagnetism from transport studies
161
electron interactions in a disordered system which leads to a positive MR.
11,13
Detailed
simulation had been carried out to understand the MR behaviour of lightly doped
ZnO:Co (sample 3W and 8W) based on the effect of the field-induced giant spin-
splitting on disorder-modified electron-electron interactions.
15
In addition to the field
dependence, an anisotropy in the MR had been observed, which was due to the
anisotropy of Co moment in the ZnO host matrix.
When the field increased further, a negative MR appeared due to possibly the
increasing alignment of electron spins with those of Co
2+
ions
11
or the formation of
bound magnetic polarons.
13
As the Co composition increased further, the positive MR
became dominant in a much wider field range and, at x = 0.25, the MR continued to be
positive even up to 6T. As it was shown in the inset of Fig. 6-8e, starting from x = 0.25,
the negative MR peak at low field was no longer a single peak; instead it showed clear
hysteresis. The negative MR was relatively insensitive to temperature and became
dominant over the positive MR above 70 K. For samples with x > 0.25, the dominance
of negative MR with hysteresis became even more apparent (Figs. 6-8(f)-(h)) and the
positive MR was no longer observable in the entire field region below 6T. In order to
focus on the details of MR at low field, in Figs. 6-8 (f) – (h), the MR in the range of -
2T to 2T was presented. The samples with x > 0.25 showed a typical MR curve for
granular-like material at low field superimposed with a slowly changing negative
background. The onset Co composition of such MR behaviour again coincided with
the Co composition at which the Co-rich phase became dominant and Co clusters
started to appear.
Chapter 6 Origin of ferromagnetism from transport studies
162
Figure 6-8 MR of (a) Al-doped ZnO and various co-doped samples, with x values indicated, from 4.2 –
50 K as a function of magnetic field, applied perpendicular to sample plane; Inset in (e) shows
hysteresis in MR behaviour for sample Co25W (Zn
0.75
Co
0.25
O) for applied field of -1 to 1 T at 50 K.
Chapter 6 Origin of ferromagnetism from transport studies
163
Figure 6-9 MR dependence on temperature of (a) Al-doped ZnO and various co-doped samples, with x
values indicated, from 1.6 – 300 K .
The temperature dependence of MR for various samples is shown in Fig. 6-9.
As could be seen from the figure, significant changes in MR occured when
temperatures were lower than 50 K. This corresponded well with the temperature-
dependence of carrier concentration shown in Fig. 6-7, indicating that the MR was
partially caused by the redistribution of carriers at Zeeman splitting bands.
Chapter 6 Origin of ferromagnetism from transport studies
164
6.7 ZnO:Co-Nb junctions
As discussed above, although all the samples exhibited “ferromagnetism” in
SQUID measurement, the AHE effect was only observed in heavily doped samples
which were attributed to an extrinsic origin. Another possible way to study the
magnetic properties of ZnO:Co was to form junctions with a superconductor. The
electrical conduction at the interface between a normal metal and a superconductor
was carried out by a process called AR. In this process, an electron-like quasiparticle
from the normal metal, having energy of which was smaller than the cannot enter
the superconductor and was retroflected as a quasihole. At the mean time, a Cooper
pair was transferred into the superconductor electrode. In general, the electron
transport in an N/SC junction could be described by the BTK model, which calculated
the current-voltage relation of a point contact between a normal metal and a
superconductor by assuming that there existed a δ-shape energy barrier Z at the
interface.
In general, the AR was greatly suppressed at the interface between a
ferromagnet and a superconductor due to the large exchange energy in FM. It was
generally believed that Cooper pairs can only traverse through a ferromagnet with a
distance on the order of
/
ex
l D E
=
, where D if the diffusion constant of electrons in
the ferromagnet,
the Plank constant and E
ex
the exchange energy. As E
ex
was large, l
was usually less than 1 nm. Strijkers et. al. have developed a modified BTK model to
describe the electrical transport properties of the FM/SC interface by taking into
account both the barrier at the interface and polarization of electrons in the
ferromagnetic layer.
16
Shown in Fig. 6-10 were the normalized conductance versus
voltage curves for a point-contact FM/SC junction with different barrier height Z and
polarization of electrons P in the FM layer. As seen from the figure, for a constant Z,
Chapter 6 Origin of ferromagnetism from transport studies
165
the conductance below the superconducting gap decreased with increasing P. When P
= 1, the electrical conduction was completely suppressed in the gap region.
The suppression of electrical conduction across the FM/SC interfaces was
mainly caused by the fact that there was a lacking of quasiparticles with opposite spin
directions to form Cooper pairs. Therefore, it had been proposed and verified that the
AR at the FM/SC interfaces would be enhanced if the electron spins in the FM region
were not well-aligned such as those in domain walls
17,18
or granular materials.
19
In
these cases, the electrons in one region would be able to pair up with retro-reflected
holes neighboring regions with a distance which was shorter than the Cooper pair
coherence length. Therefore, this type AR was often termed CAR or non-local
Andreev reflection.
20
Bearing these basic facts in mind, we will discuss below the
experiments and results of ZnCoO/Nb junctions.
-6 -4 -2 0 2 4 6
0.0
0.5
1.0
1.5
0.0
0.5
1.0
1.5
0.0
0.5
1.0
1.5
0.0
0.5
1.0
1.5
0.0
0.5
1.0
1.5
0.0
0.5
1.0
1.5
2.0
-6 -4 -2 0 2 4 6
0.0
0.5
1.0
1.5
0.0
0.5
1.0
1.5
2.0
(h) Z = 1
(f) Z = 0.50
(e) Z = 0.50
Normalized conductance
(d) Z = 0.25
Normalized conductance
(c) Z = 0.25
(b) Z = 0
Bias Voltage (mV)
(g) Z = 1
Bias Voltage (mV)
P
P
P
P
P
P
P
P
(a) Z = 0
Figure 6-10 Normalized conductance versus voltage curves calculated at 4.2 K for (a) Z = 0, (c) Z =
0.25, (e) Z = 0.50, (g) Z =1, and at 1.6 K for (b) Z = 0, (d) Z = 0.25, (f) Z = 0.50, (h) Z = 1, where ∆ =
1.5 meV. The arrow indicates increasing P from 0 to 1 with an interval of 0.2.
Chapter 6 Origin of ferromagnetism from transport studies
166
Although both the original and modified BTK models were only valid for a
point contact, we had adopted a large-size contact because our samples were
inhomogeneous in nature and it was difficult to deduce the polarization ratio from
these measurements. Instead, we were only interested in how junctions with different
Co compositions were different from one another. To study the magnetic properties of
the samples, 2 superconducting Nb pads, with a size of 1.5 mm × 1.5 mm and a
spacing of 0.8 mm, as shown in Fig. 6-11, were deposited on the ZnO:Co thin film
samples via sputtering. Measurements were then carried using a two-probe
configuration on four samples: D (x = 0.20), G (x = 0.27), J (x = 0.30) and L (x = 0.33),
in the temperature range of 1.4 K- 10 K, i.e., below the critical temperature of Nb. The
resistance between the two electrodes consisted of the contributions from two
ZnCoO/Nb contacts and the centre portion of ZnCoO between the two electrodes. As
the ZBA for the four samples was very small (see Fig. 6.2), the dependence of
dynamic conductance, if any, should mainly originate from the contacts.
Al
2
O
3
substrate
ZnO:Co
Nb Nb
1.5mm 1.5mm0.8mm
V
R
contact
R
ZnO:Co-Nb
R
ZnO:Co
Nb Nb
V
ZnO:Co
Al
2
O
3
(a)
(b)
(c)
Al
2
O
3
substrate
ZnO:Co
Nb Nb
1.5mm 1.5mm0.8mm
Al
2
O
3
substrate
ZnO:Co
Nb Nb
1.5mm 1.5mm0.8mm
V
R
contact
R
ZnO:Co-Nb
R
ZnO:Co
Nb Nb
V
ZnO:Co
Al
2
O
3
(a)
(b)
(c)
Figure 6-11 (a) Schematic diagram of ZnO:Co sample with Nb superconducting pads, (b) cross-
sectional view with dimensions indicated, (c) circuit between the superconducting contacts, with
contributions from ZnO:Co-Nb junction, R
ZnO:Co-Nb
, ZnO:Co region between the two Nb contacts,
R
ZnO:Co
, and contact resistance, R
contact
.
Chapter 6 Origin of ferromagnetism from transport studies
167
We now discuss the measurement results. Firstly, the dI/dV curves of sample D,
are shown in Fig. 6-11. The shape of the dI/dV curves was very similar to those
obtained using non-superconducting electrodes (refer to Fig. 6-1 (d)), thought the ZBA
obtained here was much larger than that measured by the non-superconducting
electrodes using a four-probe technique. The large ZBA could be understood as being
caused by the existence of a potential barrier at the ZnO:Co and Nb interface. The
strong dependence of ZBA on temperature (Fig. 6-12(a)) indicated that the ZBA was
closely related to the superconductivity of Nb and its junction with ZnO:Co. The
difference between the shape of simulated curves shown in Fig. 6-10 and that of the
experimentally measured ones could be understood as being caused by the non-
uniform distribution of barrier heights under the large-size Nb pads. What’s important
here was that negligible changes had been observed when a magnetic field up to 4 T
was applied to the sample (Fig. 6-12(b)). This suggested that the sample was not
ferromagnetic globally, though it might contain ferromagnetic clusters.
Chapter 6 Origin of ferromagnetism from transport studies
168
Figure 6-12 dI/dV curves as a function of bias voltage for sample D as determined at (a) 1.6 – 10 K, (b)
1.6 K at various in-plane applied magnetic field.
Remarkable changes had been observed in the dI/dV curves when the Co
composition exceeded 0.25. Figs. 6-13, 6-14 and 6-15 shows the dI/dV curves for
samples G, J and L, respectively. Although the shapes were not exactly the same as
those of simulated ones shown in Fig. 6-10, they did exhibit certain characteristic of
superconductor - ferromagnet junctions. We first look at the dI/dV curves for sample G
which had a Co composition of 0.27. As discussed in previous chapters, x = 0.27 had
exceeded the onset threshold of secondary phases; therefore, ferromagnetic clusters
were expected to present in this sample. If these clusters were of metallic nature, one
should be able to observe dI/dV curves with features similar to those of a pure FM-SC
3.1×10
-
3
2.6×10
-3
2.1×10
-3
1.6×10
-3
3.2×10
-
3
2.8×10
-3
2.4×10
-3
2.0×10
-3
1.6×10
-3
Chapter 6 Origin of ferromagnetism from transport studies
169
junction. Therefore, the curves shown in Fig.6-13 consisted of contributions from both
FM-SC and semiconductor–superconductor junctions in parallel. The presence of FM-
SC junctions was reflected in the strong dependence of dI/dV curves on magnetic field
(Fig. 6-13(b)). The zero-bias resistance decreased sharply when the magnetic field
increased to 0.02T. This could be understood as follows. At the absence of applied
field, the magnetizations of ferromagnetic clusters were randomly oriented which
results in large scattering of Cooper pairs injected in the ZnCoO layer from the
superconducting Nb electrodes, leading to a larger resistance. When the applied field
increased, the magnetizations of different clusters would get increasingly aligned,
resulting in a decrease of resistance (Fig. 6-13(c)).
As shown in Fig. 6-10, in general, the subgap conductance was expected to
decrease in a superconductor/ferromagnet junction when the polarization increased.
However, if the ferromagnet was in the form of a granular material, it was possible that
subgap conductance could be enhanced by CAR. This occurs when the lateral distance
between Co clusters were smaller than the coherence length of the Cooper pairs.
21
The
CAR was absent in Sample G. However, as shown in Figs. 6-14 and 6-15, the CAR
had been seen clearly in samples J and L due to the further increase of density of FM
clusters and thus decrease of the distance among the clusters. The common feature of
the dI/dV curves shown in Fig. 6-14 and Fig. 6-15 was that the conductance exhibited
a peak at zero-bias which was suppressed by the application of a magnetic field of
about 25mT. This was because the applied field induced an in-plane alignment of the
Co clusters, resulting in a suppression of CAR. The increase of zero-bias resistance
was also reflected in the magnetoresistance curves shown in Figs. 6-14(c) and 6-15 (c),
respectively, obtained with an applied current of 0.1 mA.
Chapter 6 Origin of ferromagnetism from transport studies
170
1.56E+02
1.58E+02
1.60E+02
1.62E+02
1.64E+02
1.66E+02
-0.04 -0.02 0 0.02 0.04
Field (T)
Resistance (Ohm)
Figure 6-13 dI/dV curves as a function of bias voltage for sample G, Co30W (Zn
0.63
Co
0.27
O) at (a) 1.6 –
10 K, (b) 1.6 K at various in-plane applied magnetic field, (c) MR curve at 1.6 K for applied field -0.04
– 0.04T.
(a)
(b)
(c)
7.6
×
××
×
10
-
3
7.2×
××
×10
-3
6.8×
××
×10
-3
6.4×
××
×10
-3
6.0
×
××
×
10
-3
1.66×10
2
1.64×10
2
1.62×10
2
1.60×10
2
1.58×10
2
1.56×10
2
7.2×10
-
3
6.8×10
-3
6.4×10
-3
6.0×10
-3
Chapter 6 Origin of ferromagnetism from transport studies
171
4.82E+01
4.84E+01
4.86E+01
4.88E+01
4.90E+01
4.92E+01
4.94E+01
4.96E+01
-0.04 -0.02 0 0.02 0.04
Field (T)
Resistance (Ohm)
Figure 6-14 dI/dV curves as a function of bias voltage for sample J, Co40W (Zn
0.70
Co
0.30
O) at (a) 1.6 –
10 K, (b) 1.6 K at various in-plane applied magnetic field, (c) MR curve at 1.5 K for applied field -0.04
– 0.04T.
(a)
(b)
(c)
2.15×10
-
2
2.05×10
-2
1.95×10
-2
1.85×10
-2
2.2×10
-
2
2.1×10
-2
2.0×10
-2
1.9×10
-2
1.8×10
-2
4.96×10
1
4.94×10
1
4.92×10
1
4.90×10
1
4.88×10
1
4.86×10
1
4.84×10
1
4.82×10
1