Roles of TACC related protein, mia1p in MTOCs and microtubule dynamics in schizosaccharomyces pombe 4
Bạn đang xem bản rút gọn của tài liệu. Xem và tải ngay bản đầy đủ của tài liệu tại đây (3.4 MB, 61 trang )
44
Chapter III Results
3.1 Mia1p in assembly and maintenance of persistent MTOCs at the nuclear
envelope
3.1.1 Lack of microtubule binding protein Mia1p results in fewer interphase
microtubules
3.1.1.1 Mia1p is a microtubule binding protein
During interphase, Mia1p-GFP expressed from its native promoter was localized
along microtubules in a dotted pattern and was enriched at the regions where minus ends
of microtubules overlap, consistent with previously reported results (see Figure3.1.1.1
A). When interphase cells were treated with methyl benzimidazol-2-yl-carbamate
(MBC), microtubules were depolymerized with short stubs remaining around the NE.
Mia1p-GFP was found as several distinct dots around the NE, co-localizing with short
microtubule stubs and γ-tubulin (see Figure3.1.1.1 B), suggesting that Mia1p is one of
components of MTOCs. Far western analysis using prepolymerized taxol-stabilized
microtubules suggested that the recombinant Mia1p-GST could physically associate with
microtubules (carried out by Liangmeng Wee, see Supplementary Figure3.1.1.1C). Thus,
I concluded that Mia1p binds microtubules and is a component of S. pombe MTOCs.
45
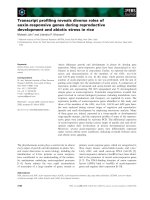
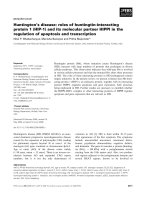
Figure 3.1.1.1: Microtubule-associated protein Mia1p binds microtubules and is a
component of S. pombe MTOCs. (A) Shown is the maximum projection of the z-stack
obtained by epifluorescence imaging of interphase cells expressing Mia1p-GFP. (B) On
MBC treatment, Mia1p-GFP localized to distinct dots around the NE coinciding with
short microtubule stubs (top panel) and predominantly colocalizing with γ-tubulin-rich
structures (bottom panel), as seen from anti-α-tubulin, anti-γ-tubulin, and anti-GFP
immunofluorescence images of Mia1p-GFP cells. (C) Mia1p binds directly to the
microtubule in vitro. Filter-immobilized recombinant Mia1p-GST bound taxol-stabilized
microtubules in the Far Western assay. Binding was not observed with GST alone (for
details, see material and methods).
46
3.1.1.2 Mia1Δ cells exhibit disordered and heterogeneous microtubule bundles
Normally 4-5 anti-parallel microtubule bundles run along the axis of interphase
fission yeast cells. One of them is nucleated by the SPB and the rest are nucleated by the
iMTOCs (interphase microtubule organizing centers) (for review, see Sawin and Tran,
2006). Thus minus ends of microtubules are anchored to the NE while plus ends face
towards cell tips (see Figure 3.1.1.2 A). In contrast, mia1Δ cells exhibited two
microtubule bundles curving around cell tips (see Figure 3.1.1.2 A). Quantification the
number of microtubule bundles per cell showed that 73% of wild type cells had 4
bundles, whereas majority of mia1Δ cells (~62%) exhibited 2 bundles (see graph in
Figure 3.1.1.2 B), indicating that Mia1p was involved in organizing microtubule arrays.
To examine microtubule polarity within the abnormally curved bundles
assembled in mia1Δ cells, I measured the fluorescence intensity along the length of
microtubule bundles in α-tubulin-GFP expressing wild type and mia1Δ cells. Distinct
medial zones of overlap (see Figure 3.1.1.2 C) were found in wild type cells, similar to
previously published data (Loiodice et al., 2005; Sawin and Tran, 2006). These high
intensity regions usually localized near the nucleus and overlapped with the iMTOCs. I
found no well defined or properly positioned zones of microtubule overlap in mia1Δ cells
using similar techniques (see Figure 3.1.1.2D), suggesting that the microtubule
architecture of mia1Δ cells was disordered and heterogeneous.
47
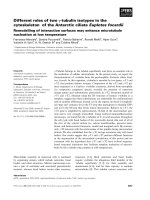
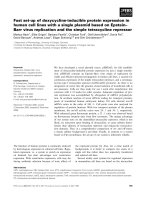
Figure3.1.1.2: Cells lacking Mia1p exhibit disordered and heterogeneous
microtubule bundles. (A) Compared to the wild-type case, mia1Δ cells contain fewer
microtubule bundles in mia1Δ cells. Shown is the maximum intensity projection obtained
by epifluorescence microscopy image of wild type and mia1Δ cells expressing α-tubulin-
GFP. (B) Quantification of microtubule bundles number per cell in wild-type and mia1Δ
cells (n=100) (C) Fluorescence intensity scans of individual microtubule bundles in eight
wild-type cells expressing α-tubulin-GFP (D) Fluorescence intensity scans of individual
microtubule bundles in eight mia1Δ cells expressing α-tubulin-GFP. Note that although
there are distinct medial regions of microtubule overlap in wild-type cells (A) mia1Δ
cells (B) show heterogeneous patterns of microtubule arrangement.
48
3.1.2 mia1Δ cells are defective in attachment of microtubules to the nucleation sites
3.1.2.1 Microtubules detached from the nucleation sites in mia1Δ cells
To further investigate role of Mia1p in microtubule organization, I performed
time-lapse analyses of microtubule and SPB dynamics in α-tubulin-GFP expressing
mia1Δ cells that also contained the SPB marker, Sid2p-GFP. In mia1Δ cells, I found that
microtubules continued to grow when they touched cell tips, producing longer and curved
microtubules (see Figure 3.1.2.1 A). One of microtubules was undergoing catastrophes
and shrinking from one cell end to the other (see Figure 3.1.2.1 A), indicating that
microtubule minus ends were dissociated from the NE. I also detected instances of the
SPB detachment from the associated microtubule bundles (see Figure 3.1.2.1 A).
To ascertain the phenotypes of mia1Δ cells described above, I tracked the
movement of the SPBs and compared SPB behavior and microtubule dynamics in wild
type and mia1Δ cells expressing Sid2-GFP and α-tubulin-GFP. In wild type, the SPB
always associated with underlying microtubule bundles throughout the movie, and
exhibited short range oscillations along the long axis around the geometric cell center as
indicated in the graph (100%, n=20 cells, observed for total of 3.5h; see Figure 3.1.2.1
B1). This behavior is due to the balanced pushing forces exerted by plus ends of
microtubules arranged in antiparallel bundles anchored at the NE (Tran et al., 2001).
When microtubules were depolymerized by MBC, the SPB stopped moving due to lack
of pushing forces (see Figure 3.1.2.1 B3). In mia1Δ cells, the SPB was either oscillating
on a much broader scale around the cell center or abruptly stopped for periods of time
(see graph in Figure 3.1.2.1 B2). During this period, microtubule bundle disassociated
from the SPB (26%, n=19 cells, observed for a total of 9.5h; see Figure 3.1.2.1 B2).
49
Figure 3.1.2.1: Mia1p is required for attachment of microtubules to the SPBs and
the NE. (A) Time-lapse sequence of mia1Δ cells expressing α-tubulin-GFP-and Sid2p-
GFP show presence of free microtubules undergoing catastrophe (indicated by an arrow)
and instances of microtubule bundles detaching from the SPB (indicated by a star). The
SPB in the sequence is indicated by an arrowhead. Shown is the maximum intensity
projection of Z-stacks obtained by epifluorescence microscopy imaging. Numbers refer
to the time, in minutes and seconds. Bar, 1μm.
50
Figure 3.1.2.1B: Mia1p is required for attachment of microtubules to the SPBs and
the NE. (1) Plot of SPB position over time in wild type cell expressing α-tubulin-GFP
and Sid2p-GFP. Some extreme positions of the SPB (indicated as 1-4) are shown on the
right of the graph. (2) Plot of SPB position in mia1Δ cell expressing α-tubulin-GFP and
Sid2p-GFP. Note that the SPB detached in the course of an experiment (compare
positions 2 and 3 with 1 and 4). (3) In MBC-treated wild-type cell, the SPB exhibited
only slight Brawnian motion. Shown are single maximum intensity projections of z-
stacks obtained by epifluorescence imaging.
51
3.1.2.2 Microtubules remained attached to the SPB in alp14Δ cells
Interestingly, I found that in the absence of Mia1p-interacting protein of the
MAP215 family, Alp14p, microtubules remained attached to the SPBs in the time-lapse
sequence analysis of α-tubulin-GFP Sid2p-GFP expressing alp14Δ cell (100%, n=20
cells, observed for total 3h; see Figure 3.1.2.2 A), suggesting that Mia1p could function
in microtubule attachment to the nucleation site independently of Alp14p. However, the
SPB remained stationary in the course of the movie, suggesting that microtubules didn’t
exert sufficient pushing force (see Figure 3.1.2.2 B).
52
Figure 3.1.2.2: Although SPBs remain stationary in alp14Δ cells, microtubules are
attached to the SPBs. (A) Time-lapse sequence of alp14Δ cell expressing α-tubulin-
GFP and Sid2p-GFP. Shown are the maximum intensity projections of z-stacks obtained
by epifluorescence imaging. Numbers refer to the time, in minutes and seconds. (B) Plot
of the SPB position over time in alp14Δ cell expressing α-tubulin-GFP and Sid2p-GFP.
Note that the SPB remained stationary in the course of the experiment.
53
3.1.3 Mia1p is not required for microtubule nucleation
3.1.3.1 Microtubules could be nucleated on the preexisting microtubules in mia1Δ
cells
Since mia1Δ cells exhibited reduced numbers of microtubule bundles, I was
interested in finding out whether mia1Δ cells are defective in nucleating microtubules.
However, time-lapse analysis of microtubule dynamics in α-tubulin-GFP expressing
mia1Δ cell showed that microtubules could be nucleated from the NE but did not
maintain their attachment to it: a growing microtubule was ejected from its nucleating
site and continued to grow at its plus end, pushing the stable minus end toward the cell
center (see Figure 3.1.3.1 A). Subsequently, I observed a second nucleation event, as
judging by a sudden increase in fluorescence intensity in the vicinity of the minus end in
kymograph (as marked by a cross in Figure 3.1.3.1 A & B). The newly born microtubule
quickly formed antiparallel bundle with mother microtubule. I measured microtubule
growth rate and found that the resulting bundle grew at both plus ends. Transition from
monopolar growth to bipolar growth is shown in Figure 3.1.3.1 C.
My data suggested that nucleation and bundling could occur in cells lacking
Mia1p. However, these cells exhibited a compromised anchoring of minus ends of
microtubules to the nucleation sites.
54
55
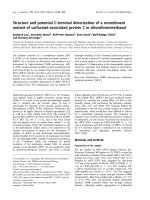
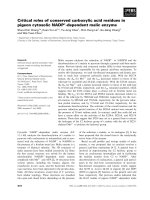
Figure 3.1.3.1: Microtubules could be nucleated on the preexisting microtubules in
mia1Δ cells. (A) Time-lapse sequence of mia1Δ cell expressing α-tubulin-GFP. A
microtubule nucleation event (indicated by an arrowhead) is followed by microtubule
ejection from the NE (indicated by a star). A second nucleation event on the preexisting
microtubule is marked by a cross. Shown are single maximum intensity reconstructions
of z-stacks obtained by epifluorescence microscopy imaging. Numbers refer to the time,
in minutes and seconds. (B) Kymograph of the growing microtubule ejection from the
time-lapse sequence presented in Figure 3.1.3.1A. Time 0 corresponds to the time of
microtubule ejection from the NE (marked by a star in the Figure 3.1.3.1A). Note that
microtubule initially grew at the plus end facing the cell tip, and consequently pushing its
minus end toward the center of the cell. A second nucleation event was followed by
formation of the antiparallel bundle (marked by a cross; also see corresponding image in
A). The resulting bipolar microtubule bundle continued to grow on both sides. Eventually
the older bundle underwent catastrophe. (C) Graph of microtubule growth rate obtained
from the kymograph.
56
3.1.3.2 Microtubules could be nucleated from several sites around the NE in
mia1Δ cells
So far, my experiments were performed using steady-state mia1Δ cells. I
wondered where microtubules could be nucleated in mia1Δ cells if microtubules were
artificially removed by treating cells with the microtubule-depolymerizing drug MBC and
then re-polymerized by washing-out drug. I performed time-lapse analyses of α-tubulin-
GFP Sid2p-GFP-expressing wild type and mia1Δ cells in a perfusion chamber mounted at
the microscope stage. In wild type cells, microtubules rapidly depolymerized upon
addition of 50 μg/ml MBC (within 45 sec), leaving microtubule remnants that appeared
as several dots around the NE. When the drug was washed out with fresh medium,
repolymerization of microtubules was initiated from these dots in a bidirectional manner
(see Figure 3.1.3.2 A). In contrast in mia1Δ cells, although the process of microtubule
depolymerization was somewhat slower (~90sec) than in wild type cells, most
microtubules eventually disassembled, leaving no microtubule remnant but just a single
fluorescent structure representing the SPB (see Figure 3.1.3.2 B). Surprisingly,
microtubules could be nucleated from several sites around the NE upon MBC wash-out
(see Figure 3.1.3.2 B). However, these microtubules eventually detached. In the case
shown in the Figure 3.1.3.2 B, one of microtubules was undergoing catastrophe and
shrinking across the cell body exhibiting a plus-end depolymerization rate of ~12μm/min
(see Figure 3.1.3.2 B 11’30”-12’15”), suggesting that Mia1p was not required for
microtubule nucleation but was required for maintenance of microtubule bundles.
Another way to depolymerizing microtubules is to disassemble them by shifting
cells on ice. To confirm my conclusions, I shifted ice-treated wild type and mia1Δ cells
57
expressing the NE marker Uch2p-GFP and α-tubulin-GFP to the room temperature and
performed time-lapse analyses to observe microtubule dynamics. I found that
microtubule nucleation could be initiated from the NE in both wild type and mia1Δ cells
(see Figure 3.1.3.2 C&D). However, compared to wild type cells in which microtubules
remained attached to the NE and nucleus was deformed by the polymerizing
microtubules when they touched cell ends (see Figure 3.1.3.2 C), in mia1Δ cells
microtubules were released from the nucleation sites and were eventually rearranged as
one long microtubule bundle curving around cell tips (see Figure 3.1.3.2 D).
58
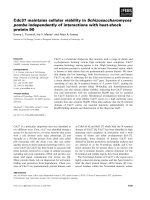
Figure 3.1.3.2: Microtubules could be nucleated from several sites around the NE in
mia1Δ cells. (A) Wild- type cells expressing α-tubulin-GFP Sid2p-GFP were mounted in
the flow chamber allowing the time-lapse analysis of microtubule dynamics during MBC
treatment (50μg/ml) and subsequent washout. MBC treatment caused microtubule
depolymerization, leaving stable microtubule “stubs” at the NE. On washout,
microtubules rapidly repolymerized from these “stubs” toward cell periphery. Shown are
the maximum projection image of the z-stack obtained by epifluorescence imaging.
59
Figure 3.1.3.2: Microtubules could be nucleated from several sites around the NE in
mia1Δ cells. (B) mia1Δ cells expressing α-tubulin-GFP Sid2p-GFP were mounted in the
flow chamber allowing the time-lapse analysis of microtubule dynamics during MBC
treatment (50μg/ml) and subsequent washout. Microtubules depolymerized after MBC
treatment leaving one bright dot presented the SPB at the NE. On washout with fresh
medium, I detected efficient nucleation of microtubules from around the NE. At least one
microtubule eventually detached and underwent catastrophe (as indicated by an arrow).
Shown are maximum projection images of z-stacks obtained by epifluorescence imaging.
Numbers refer to the time, in minutes and seconds. Bar, 1μm.
60
Figure 3.1.3.2: Microtubules could be nucleated from several sites around the NE in
mia1Δ cells. (C) Time lapse sequences of cold-treated α-tubulin-GFP Uch2p-GFP
expressing wild type after temperature shift-up to 24
o
C. Microtubules depolymerized
after incubated on ice, leaving stable “stubs” at the NE. On washout, microtubules rapidly
repolymerized from these “stubs” toward cell periphery. (D), Time lapse sequences of
cold-treated mia1Δ cells expressing α-tubulin-GFP and Uch2p-GFP after temperature
shift-up to 24
o
C. Note that microtubules polymerize from the nuclear surface in mia1Δ
cells. However, mia1Δ cells could not sustain the microtubule-nuclear envelope
attachment. Shown is the maximum projection image of the z-stack obtained by
epifluorescence imaging.
61
3.1.4 Mia1p is required for maintenance of microtubule bundles
My results from microtubule depolymerization and recovery experiments
suggested that microtubule bundles were unstable in mia1Δ cells. To confirm this
phenotype, I performed fast (every 5 sec) time-lapse analyses of single focal planes in
wild type and mia1Δ cells expressing α-tubulin-GFP. I found that microtubule bundles
were relatively stable in wild type cells. Rare events of disappearance of preexisting
bundles were observed (1.2 events per bundle per hour, n=8, total time=3.5) (see Figure
3.1.4 A), and microtubule nucleation was mainly maintained to preexisting MTOCs ( I
observed only 4.7 de novo nucleation events per cell per hour, n=6, total time=2.5h). In
contrast, in mia1Δ cells the lifetime of microtubule bundles was significantly reduced
(bundles disappeared with the rate of 13.6 events per bundle per hour, n=10, total
time=3.5h) (see Figure 3.1.4 B), and microtubules were frequently nucleated from
different sites around the NE (23 events per cell per hour, n=11, total time=3.3h). I
concluded that Mia1p was not required for microtubule nucleation but was required for
maintenance of microtubule bundles.
62
Figure3.1.4: Mia1p is required for maintenance of microtubule bundles. (A) Graph
and representative still images (1 to 3) following number of microtubule bundles present
in one focal plane of the wild type cell over a period of time. Note that microtubule
nucleation was mainly maintained to preexisting MTOCs in wild type cells. (B) Graph
and representative still images (1 to 5) following number of microtubule bundles present
in one focal plane of the mia1Δ cell over a period of time. Note that microtubules were
frequently nucleated from different sites around the NE. Shown is one focal plane time
lapse image with 5 seconds temporal resolution of wild type and mia1Δ cells expressing
α-tubulin-GFP.
63
3.1.5 Mia1p is required for sustaining proper post-anaphase array dynamics
3.1.5.1 PAA dynamics is abnormal in mia1Δ cells
At the end of mitosis, the eMTOC localizes at the cell center to nucleate a
specialized microtubule network called the PAA (post anaphase array), producing
symmetrical radial arrays of microtubules at both sides of the eMTOC with their plus
ends facing to mother cell tips (for review see Hagan 1998). I found that Mia1p-GFP
localized to the equatorial γ-tublin ring (eMTOC), as judged by live GFP
immunofluorescence (see Figure 3.1.5.1 A) and immunoEM analyses (see Supplementary
Figure 3.1.5.1 B). Since Mia1p has been found to be involved in maintaining stable
microtubule bundles during interphase, I decided to check whether any aspects of the
eMTOC/PAA dynamics could be affected in mia1Δ cells. I performed time-lapse
analyses in α-tubulin-GFP wild type and mia1Δ cells. In wild type cells, microtubule
nucleating-structures started as two foci at the cell center in late anaphase (see Figure
3.1.5.1C, marked with stars in 1’30” time point). These foci persisted and eventually
fused together to form a single ring-like structure that constricted with the actomyosin
ring (see Figure 3.1.5.1C). I tracked paths of these focal structures over the course of cell
division and combined them on a single superimposed image (see Figure 3.1.5.1C). My
analysis confirmed that once assembled, these microtubule-nucleating structures
remained fairly stable. In contrast, I observed that nucleation of microtubules did occur at
the medial region of mia1Δ cells, consistent with the results obtained from interphase
cells, but that the nucleating structures were unstable (see Figure 3.1.5.1D). Tracking
analysis indicated that the lifetime of each structure was short and that cells initiated
multiple nucleation events from different sites at the eMTOC (see Figure 3.1.5.1D). This
64
behavior resulted in a poorly organized PAA and a loss of microtubule from the medial
region (see Figure 3.1.5.1D).
65
Figure 3.1.5.1: Mia1p is required for PAA organization. (A) Mia1p-GFP localizes to
both the SPBs and the eMTOC at the division site during cell division. Shown is the
maximum projection image of the z-stack obtained by epifluorescence imaging. (B)
Mia1p localizes to the eMTOC at the division site. Immunoelectron micrography of cell
expressing Mia1p-GFP stained with gold paricle-coupled anti-GFP antibodies. Mia1p-
GFP is found to localize on both sides of the division site (indicated by stars). Bar,
300nm (for details, see material and methods). (C)Time-lapse sequence of the dividing
wild type cells expressing α-tubulin-GFP. Once established, the microtubule-organizing
structures are maintained as judged by tracking from their appearance to ring constriction
(as shown in C’). Stars mark the medial microtubule foci. Different colors in C’ denote
independent nucleation sites. (D) Time-lapse sequence of the dividing mia1Δ cell
expressing α-tubulin-GFP suggests that although microtubule can be nucleated from the
eMTOC. There are no persistent nucleation sites. Different colors in D’ represent
independent nucleation sites. Ejection event is marked by the arrow at time point 1’30”.
Shown is the maximum projection image of the z-stack obtained by epifluorescence
imaging. Numbers refer to the time, in minutes and seconds. Bar, 1μm.
66
3.1.5.2 Mia1p is not required for the assembly of the eMTOC
I wondered whether the defects of PAA organization could be attributed to the
absence of the properly assembled eMTOC in mia1Δ cells. However, I found no evidence
of this scenario: Several eMTOC markers, including Alp4p-GFP, Mto1p-GFP and
Rsp1p-GFP, localized to the eMTOC in both wild type and mia1Δ cells (see Figure
3.1.5.2). The eMTOC constriction and disappearance of the equatorial ring material
proceeded similarly in mia1Δ and wild type cells. I concluded that although Mia1p was
not required for eMTOC assembly, it was necessary to sustain the continuing use of
nucleating sites through the course of cell division.
67
Figure 3.1.5.2: Mia1p is non-essential for the assembly of the eMTOC. Proteins
associated with the γ-tubulin complex, Rsp1p-GFP, Alp4p-GFP and Mto1p-GFP localize
at the cell equator in both wild type and mia1Δ cells. Shown is the maximum projection
image of the z-stack obtained by epifluorescence imaging.
68
3.1.6 There are no detectable γ-tubulin-rich iMTOC structures in mia1Δ cells
Since nucleation of microtubules could occur from around the NE in mia1Δ cells,
suggesting that Mia1p was downstream of MTOC components, I suspected that γ-TuRC
components localized normally in the absence of Mia1p and the iMTOC structures could
be detected in interphase mia1Δ cells. In the steady-state interphase wild type cells,
Mto1p-GFP and Alp4p-GFP localized to the SPB and to several bright dots around the
nucleus and along microtubules (see Figure 3.1.6A), likely representing the MTOCs. In
mia1Δ cells, I detected only the SPB signal together with very faint and even staining
along microtubules and around the NE (see Figure 3.1.6A).
When microtubules were depolymerized by addition of MBC in both wild type
cells and mia1Δ cells expressing fluorescent MTOC markers, I detected several bright
dots around the NE in wild type cells, as expected (see Figure 3.1.6B). One of them is the
SPB, and the rest are the iMTOCs. Surprisingly, the MTOC markers appeared as sole dot
which represented SPB, but no iMTOC structures were detected around the NE in mia1Δ
cells after microtubule depolymerization (see Figure 3.1.6B).
I concluded that although the microtubule-nucleating complexes were active at
the NE of mia1Δ cells, they were not organized into discernible iMTOC structures,
probably reflecting the lack of microtubule/NE attachment sites. Thus, it seemed that
mia1Δ cells were deficient in establishing the iMTOC structures at the NE.