Essays on TRIPs, pharmaceuticals and developing countries with special reference to india
Bạn đang xem bản rút gọn của tài liệu. Xem và tải ngay bản đầy đủ của tài liệu tại đây (1.26 MB, 180 trang )
PART I
1
CHAPTER 1
GLOBAL PHARMACEUTICAL MARKETS:
BRANDNAME VS GENERIC DRUGS
In Part I of the thesis, we analyze certain aspects of the behaviour of international
pharmaceutical markets. The global pharmaceutical industry is undergoing rapid
changes, both from the demand and supply sides. The demand side dynamics
reflect the affordability and access of drugs while the supply side changes
correspond to innovations of new drugs through R&D. While policymakers are
concerned about rising costs of health care, pharmaceutical companies are seeking
ways to discover new domestic and international markets to cover the accelerating
costs of R&D.
Estimating the demand for pharmaceutical products is challenging since
demand is usually determined by the physician’s prescription for pharmaceutical
products and patients are usually covered by some sort of insurance in developed
countries. Thus, there may be a discrepancy between the realized marginal
benefits and the price paid for pharmaceutical products in developed countries. In
developing countries, most of the expenditure on prescription drugs is made by
patients’ own funds. On the supply side, the cost of producing and marketing the
first unit of the drug is very high, but the marginal cost of manufacturing
additional units of the drug is small.
2
While developed countries produce new drugs, developing countries
usually produce generic versions of brandname drugs not only for domestic use
but also for export to the rest of the world. For instance, the destination of exports
of Indian pharmaceuticals is North America, Western Europe, Japan and Australia.
In 2002-03, India exported nearly 40 percent of its total pharmaceutical output
with exports valued at nearly $2.6 billion. The major market is the U.S. which
accounted for 17 percent of all Indian pharmaceutical exports in 2002-03.
Moreover, the generic markets in the U.S. and E.U. are likely to expand at 10-15
percent per year, as attempts are made to contain rising health care costs by
switching to less expensive drugs.
1.1. BACKGROUND
From a worldwide perspective, the pharmaceutical industry consists of a large
number of firms producing a variety of drugs including brandname and generic
drugs. It was after World War II that the modern pharmaceutical industry
emerged in its present form with its characteristic features of high research
intensity and high sales promotion. Large pharmaceutical multinational
corporations (MNCs) co-exist with small firms in this industry. The competition
in pharmaceutical markets is based on product differentiation based on R&D
efforts and hence the need for patents to reward the innovator for undertaking
risky ventures and spending huge resources for inventing new drugs.
The reason why patents are crucial for pharmaceutical firms is that it takes
hundreds of millions of dollars to discover, develop and get regulatory approval
3
for a new medicine. In the absence of patent protection, imitators can duplicate
the innovator’s chemical compound at a fraction of the latter’s cost since imitation
costs are low compared to the costs of discovering and developing a new drug.
Moreover, with or without patent protection, the pricing policy for the product is
likely to be different at each stage of the product’s life cycle. Throughout the
product cycle, continual changes occur in price elasticity and in costs of
production and distribution, so that these changes call for price adjustments.
1.1.A. Patent system
The pharmaceutical industry is one of the most research-intensive manufacturing
industries with product quality subjected to close regulation by regulatory
authorities like the USFDA (U.S. Food and Drug Administration), which
regulates the introduction of new drugs and maintains high product quality
standards, and approval requires difficult and lengthy pre-clinical and clinical
trials. Given the uncertainty in predicting the outcomes of pharmaceutical
research, there is intense debate on the issue of pharmaceutical pricing, financing
of research and optimal length of patent protection. Given that knowledge
(including knowledge about pharmaceutical technology) is a global public good,
national self-interests are often in conflict with the worldwide harmonization of
patent legislations propagated by the Agreement on Trade Related Aspects of
Intellectual Property Rights (TRIPs).
According to TRIPs, all member-countries of the World Trade
Organization (WTO) have to provide exclusive marketing rights to an inventor
4
through the grant of patents for 20 years from the date of filing the patent
application. Patents can be either product patents or process patents. Product
patents are granted for a new product while process patents are granted for a novel
method of manufacturing a similar or identical product. In principle, the patent
system provides incentives to innovators to engage huge resources in drug
innovation and development and earn monopoly profits till the patent expires.
However, the effective patent life is 12-15 years because of the time taken in
clinical testing and obtaining regulatory approval. When the patent expires,
generic competitors can enter the market with barriers to entry being reduced.
Pharmaceutical R&D expenditures have increased sharply over the years.
It has been estimated that at 1987 prices, the out-of-pocket cost for every new
chemical entity (NCE) approved was $231 million (DiMasi et al., 1991). More
recent estimates show that since then, costs have increased at an annual rate of 7.4
percent above general inflation. DiMasi et al. (2003) surveyed costs of drug
development of 10 large pharmaceutical firms producing 68 drugs over the period
1980-99. At 2000 dollars, they reported the average estimated base case cost of
every new drug development to be $403 million and the total pre-approval
capitalized cost up to the marketing stage to be $802 million. Once a drug is
developed and ready to be marketed, these R&D costs become sunk costs and
thus become irrelevant for short-run pricing decisions. The decision to carry on
with such high-risk projects thus depends on potential therapeutic benefits and
future revenues which are guaranteed by patents till the patent term expires.
5
As noted above, under patent protection, brandname drugs enjoy market
exclusivity for a limited time period. The nominal patent life is the time between
patent registry and expiration whereas the effective patent life is the time between
product entry and expiration. Grabowski and Vernon (2000) found that for NCEs
introduced between 1990 and 1995 in the U.S., the effective patent life was only
11.7 years, despite the 20 year patent term stipulated by TRIPs.
The extent to which market exclusivity for brandname drugs guarantees
monopoly rights depends on the competition they face from other brands within a
therapeutic class. An improved competitor “me-too” drug treating the same
ailment can be awarded patent rights as long as it is sufficiently different from the
original drug, raising the issue of patent breadth or scope. Thus, the analysis of
patent protection requires a two-dimensional approach that includes patent length
and patent breadth.
1.1.B. Process of drug innovation
New drug development is a lengthy sequential process fraught with risk and
uncertainty. Typically, even though the development of NCEs may be spread over
many years, only a small proportion of these new products finally get approval for
marketing. The process of drug innovation begins with research by chemists and
biologists to develop concepts for new compounds, which are then synthesized
and tested for pharmacological activity. If found promising, the innovator firm
files for an investigational new drug application with the regulatory authority and
6
on approval, it goes on to the next stage of clinical trials for testing the efficacy
and toxicity of the drug.
DiMasi et al. (2003) describe the three phases of clinical trials. In phase I,
usually tests are carried out on a small number of healthy volunteers to determine
the safety, absorption, metabolism and toxicity of the compound. In phase II, the
testing is done on more patients having the targeted condition or disease. In the
final phase III of clinical trials, testing is done on a large scale in different
locations to establish efficacy and look for side-effects. These clinical trials
require testing on humans and are very time-consuming. Once the phase of
clinical development is successful, the innovator firm can apply for a new drug
application (NDA). In general, the USFDA takes one to four years to grant
approvals after reviewing the applications, but if the firm concerned is a research-
intensive firm reputed for its quality, the review period may be considerably
shortened (Olson, 1997). With the USFDA clearing the drug, the innovator firm
can start marketing the product.
1.2. PHYSICIAN AS AGENT
A pharmaceutical product can be viewed as a bundle of characteristics that affects
patient well being such as efficacy, safety and reliability. Ideally, a physician tries
to prescribe the drug that perfectly matches the patient idiosyncrasies. However,
there is evidence of habit formation by physicians while prescribing drugs
(Hellerstein, 1998; Coscelli, 2000; Lundin, 2000 and Richard and Horn, 2004).
7
1.2.A. Prescription drug insurance
One of the reasons attributed for habit persistence in drug prescriptions is the
insurance coverage provided for drug expenditure, particularly in developed
countries. In a study of the U.S., Berndt (2002) found that costs for prescription
drugs increased from 5.1 percent of total health care costs in 1980 to 9.7 percent
in 2000, which translates into $121.8 billion or $450 per person. At the same time,
he found that pharmaceutical expenditures grew at about 11.9 percent between
1987 to1994 and 12.9 percent between 1994 and 2000. In the first sub-period, the
price growth of 6.1 percent annually was responsible for more than half the sales
growth but in the second sub-period, price growth was responsible for only a fifth
of revenue growth, four-fifths being accounted by volume changes. Thus, in
recent years, price increases have become less important for explaining rising
pharmaceutical expenditures, and instead, quantity growth in terms of greater use
of brandname products, has become the prime mover for increased spending.
Nearly 40 percent of prescriptions in the U.S. are covered by insurance
(Scott Morton, 2000). Given that a patient is only concerned about quality and is
not paying out of her own pocket for prescription drugs, it is likely that she will
not purchase the cheaper generics available in the market after patent expiration.
Many empirical studies have found that expenditure on prescription drugs is
higher for patients with higher insurance coverage (Leibowitz et al. 1985; RAND
Health Insurance Experiment, 1993; Lundin, 2000; Pavcnic, 2002; Cleanthouse,
2003 and Buchmueller et al., 2004). In fact, while insurance leads to greater
8
spending, growth in insurance coverage is itself stimulated by the availability of
better and newer drugs (Danzon and Pauly, 2001 and 2002).
1.2.B. Detailing
Sales promotion for pharmaceuticals takes several forms, the most important of
which is detailing. This is a costly process that requires visits by medical
representatives to physicians, pharmacists and other professional distributors to
promote new drugs and answer queries. The large force of detailers is a fixed cost
for brandname firms and acts as an incentive for continuous innovations. While
detailing no doubt helps in information dissemination, it also encourages brand
consciousness among physicians since detailing is not aimed at the consumer but
is primarily aimed at increasing the likelihood that physicians prescribe
brandname pharmaceutical products. Moreover, despite large expenditures on
marketing and promotion, about 20 to 30 percent of sales, promotional
information seldom reports actual prices (Brekke and Kuhn, 2003). The fact that
physicians do not know the price of the drugs they prescribe suggests that they
cannot be fully price sensitive and at best can only estimate the magnitude of cost
saving from generics. Medical journal advertising is also an important
promotional activity aimed at maintaining the general goodwill of the brandname
firm. Expenditures on detailing are four to five times higher than for journal
advertising in the U.S pharmaceutical industry (Berndt et al., 1999).
9
1.2.C. Consumption Externalities
Besides physician prescription and advertising, consumption externalities also
play a role in affecting demand for pharmaceuticals (Berndt et al., 2003a).
Consumption externalities arise when demand for pharmaceuticals by patients and
physicians depends on the number of other patients that have taken the drug and
demand is influenced by their opinion regarding its efficacy, safety and
acceptability. Thus, herd behaviour can also create captive markets for a
particular drug despite the availability of close substitutes.
1.2.D. Demographic Changes
Finally, demographic changes in the industrialized countries with the ageing of
baby-boomers have increased the demand for health care services. Since the bulk
of the demand for drugs comes from senior citizens, as the baby-boomer
population reaches the 60+ age group in 2005, demand for drugs is expected to
rise. Also, as real incomes rise in the industrialized countries, demand for health
care will rise, particularly for new drugs.
1.3. RISING HEALTH CARE COSTS
Among all the components of health care expenditures, spending on prescription
drugs is growing the fastest. In the U.S. in 2001, spending on prescription drugs
alone exceeded $150 billion (Dubois, 2003). The primary reasons propelling this
growth in health care spending are increased third-party prescription drug
coverage, the introduction of newer and better products, increased outlays for
10
sales promotion through direct to consumer (DTC) marketing and demographic
changes.
1.3.A. Cross-price sensitivity
Recent developments in the health sector have increased the cross-price
sensitivity between brandname and generic drugs even in the U.S. Ellison et al.
(1997) found a high elasticity of substitution between brandname and generic
drugs. Prescription drug markets in the U.S. have changed considerably in recent
years, due to governmental scrutiny of the drug industry and the rapid growth of
managed care. The health care reform initiatives in 1993 included limits on drug
prices and Medicaid reimbursement, as well as other regulatory controls. Also, the
emergence of managed care as a major player in the prescription marketplace has
recently altered the way drugs are prescribed. In order to contain escalating
prescription drug costs, managed care providers employ various methods to
influence physicians’ prescription decisions such as drug budgets and formularies
(regulated lists of approved medications) to restrict reimbursement to a fairly
small number of cost-effective drugs in a given therapeutic class.
Private third-party insurers have also introduced a number of measures to
control the spiraling health care expenditures. First, they now insist on using
drugs included in their list of formularies. Second, they have adopted a “two-tier”
method for lower co-payments from users of generic drugs as compared to users
of brandname drugs. Thus, private insurers were able to make the demand for
pharmaceuticals more elastic by the threat of excluding brandname drugs from
11
their formulary list. Also, mail order dispensing of medications to treat long-term
chronic conditions is being encouraged by insurers, which in turn has exerted a
pressure on retail pharmacy to lower their dispensing costs.
1.3.B. New drugs
Spending in a therapeutic class increases with the number of new products
entering the class and the extent of their therapeutic benefit. New products play a
significant role in increasing drug expenditures since new products are priced at a
higher level (Danzon and Ketcham, 2004). However, newer and better quality
drugs tend to lower other nondrug expenditures on health care, resulting in a
reduction in overall cost of treatment for a given condition (Lichtenberg, 2001).
Mullins et al. (2001) studied the increase in drug spending between 1995
and 1998 and found that overall spending increased by 15 percent for all drugs, 25
percent for newer drugs and 7 percent for older drugs. Thus new drugs
contributed 75.3 percent of the increase in drug expenditures; the remaining 25
percent was due to expenditure growth of drugs more than five years old in the
market. Thus, considering expenditures on new drugs is important for
understanding and predicting future drug trends.
1.4. PATENT EXPIRATION AND GENERIC ENTRY
Griliches and Cockburn (1996) have listed the requirements for generics to be
certified as “therapeutically equivalent” by the USFDA: (a) they should contain
the same active ingredients, be of the same dosage form and strength and offer the
12
identical route of administration while meeting the same quality standards, (b)
they should be bioequivalent to the original brandname drug with respect to the
rate and extent of absorption of the active ingredient and its availability at the site
of action, (c) they should be properly labeled and manufactured in compliance
with good manufacturing practices. However, even therapeutically equivalent
products may differ in other characteristics like shape, color, flavor, packaging,
labeling and shelf life. These trivial factors are crucial in affecting the patient’s
ability to distinguish between different pills and their dosages.
It is believed that worldwide, the profitability of pharmaceutical majors is
likely to be squeezed due to shrinking sales growth after patent expiration and
mounting costs for R&D and advertising. The total generic business is expected to
grow due to expiration of patents or exclusivity for brandname drugs. According
to Graham Lewis, Vice-President, Strategic Consulting, IMS Health, out of the 35
leading molecules worldwide, 13 molecules (Simvastatin, Omeprazole,
Amlodipine, Fluoxetin, Loratadine, Pravastatin, Fluticasone, Amoxyclavulanic
Acid, Sertraline, Lisinopril, Nifedipine, Ciprofloxacin, Famotidine) will lose
patents by 2005 throwing open sales worth $52.9 billion for top 29
pharmaceutical companies (Lewis, 2001).
In the U.S., the Drug Price Competition and Patent Term Restoration Act
(commonly known as the Hatch-Waxman Act) of 1984 eliminated the strict
requirements for USFDA approval of generic substitutes by easing the stringent
testing requirements. With the passage of the Hatch-Waxman Act, the market
share of generic drugs has more than doubled in the U.S. from 18.6 percent in
13
1984 to 47.1 percent in 1999 (Berndt, 2001). More recently, the Greater Access to
Affordable Pharmaceuticals Act (GAAP) in 2003 was passed in the U.S. Senate to
cut health care costs and close loopholes in the 1984 Act that allowed brandname
drug manufacturers to keep the generic manufacturers out of the market. The
Congressional Budget Office has estimated that this Act would result in savings
worth $60 billion over the next 10 years.
1. 4.A. Entry procedure
In the U.S., generics producers enter the market by applying to the USFDA for an
abbreviated new drug application (ANDA). They can file an ANDA even before a
patent expires and so with USFDA approval can enter the market on the very day
of patent loss. They have to prove that their product is exactly the same as the
brandname drug in strength, dosage form and route i.e. it is a “bioequivalent”. But
even bioequivalency studies for ANDAs can take months to years depending on
the drug formulation and the generic firm’s research capacity. The application
process requires factory inspections and independent tests of several preliminary
batches of the product. Thus, the generic firm has to be ready to make the drug
months before it gets the approval for marketing. These entry costs are sunk costs
that must be incurred prior to entry and these entry costs can be significant when
there is likely to be fierce competition in the generic market.
Empirical studies on the impact of generic entry on brandname drugs
show that quantity demanded of brands is adversely affected with the availability
of cheaper therapeutic equivalents. According to Caves et al. (1991), the demand
14
for brandname drugs falls by 20 percent in the year of patent expiration and
continues to decline at the rate of 12 percent per year. Aronsson et al. (2001)
analyzed the impact of generic competition on the market shares of 12 brandname
drugs from 1972 to 1996. In five out of twelve cases, entry by cheaper generics
adversely affected the market share of the brandname drug. Berndt et al. (2003b)
found consumers benefited from generic entry and the introduction of over-the-
counter (OTC) versions of prescription drugs on patent expiration for antiulcer
and heartburn drugs.
Generic substitutes appear in the market at 30-50 percent lower rates and
capture much of the market share of brandname drugs (Griliches and Cockburn,
1996). However, even with such large price differentials between brands and
generics, the former is able to maintain a substantial share of its demand since not
all patients switch to the cheaper substitute. Thus, patients have different
valuations or differential information regarding the quality and efficacy of such
drugs resulting in considerable patient heterogeneity and physician preferential
prescription of drugs.
1.4.B. Entry determinants
Characteristics of a drug market are important determinants of generic entry.
Some of the factors that attract generic entrants are larger sales revenues of the
brandname firm prior to patent expiration, profit opportunities in a particular
market, whether a drug treats chronic conditions as opposed to acute illness and
the extent to which the drug is purchased by hospitals.
15
Scott Morton (1999) found that the estimated costs of filing an ANDA
range from $250,000 to $20 million depending on different drugs and drug-firm
combinations and that generics enter brandname markets with annual sales of $22
million where the first entrant receives revenues worth less than $10 million. The
first entrants are the important players since late entrants often withdraw
applications in response to rivals’ approvals. On average, five generics enter the
market in the first year of patent loss but only three more enter in the next three
years (Frank and Salkever, 1997). A study by Hudson (2000) regarding generic
entry across four countries, the U.K., U.S., Germany and Japan also showed that
the market size at patent expiration is an important consideration, both for generic
entry and the lag between patent expiration and generic entry. He concludes that
the patent system acts as a “risk-smoothing” device since successful brands attract
greater generic entry than the less successful brands whose revenue stream will be
unaffected by patent expiration.
1.4.C. Brand price response
The price response of brandname drugs to generic entry has been a source of
controversy. However, most studies show that prices of brandname drugs rise
after generic entry (Grabowski and Vernon, 1990; Caves et al., 1991; Frank and
Salkever, 1992 and 1997; Suh et al., 2000; Ellison and Ellison, 2000; Danzon and
Chao, 2000). Grabowski and Vernon (1990) studied the effect of generic entry on
18 drugs between 1984 and 1987 and found that brand prices rose with generic
entry. They found that the brand price was higher by 7 percent one year after
16
generic entry and by 11 percent two years after generic entry. Caves et al. (1991)
also estimated a model of the ratio of generic to brandname prices for 30 drugs
that went off patent during 1976-1987 and found similar results that greater
generic entry, measured by the number of ANDA applications, had a downward
effect on generic prices relative to brandname prices. The estimated results
showed that initial generic entry resulted in brand prices falling about 2 percent.
Frank and Salkever (1997) used data for a sample of 32 drugs during the 1980s to
show that brand prices increase after generic entry. In addition, they find that after
three years of entry, generic prices were less than half that of brand prices. This
implies that the generic market is a highly competitive fringe to the brandname
drug. However, they concede that with generics capturing a large share of the
market at significantly reduced prices, the average price of a drug subjected to
generic competition falls.
Suh et al. (2000) found that on patent loss, innovator firms continued to
increase prices while price of generic drugs fell significantly over time. By the
fourth year after patent expiration, innovators’ sales had decreased 12 percent and
quantity had decreased 30 percent. Thus, innovators have the first-mover
advantage with a captive market of brand-loyal consumers. Another study by
Ellison and Ellison (2000) shows that prices of brandname drugs increased
(relative to a pharmaceutical price index) during the final years of patent
protection. After patent expiration, prices fall for the group of pharmaceuticals
where entry is predicted to be likely, and continue to rise for pharmaceuticals
where the probability of entry is low or medium high.
17
Danzon and Chao (2000) found that competition from generics had little
effect on the price of brandname drugs, but this may not reflect the true extent of
competition because rebates are given to managed care customers to get included
in the list of formularies. They found a monthly price fall of 3.7 percent for every
month of entry lag indicating that price undercuts by successive entrants does not
fully erode the first-mover advantage of the brandname firm. They conclude that
generic competition plays a greater role in lowering prices in the U.S. and other
less regulated markets like Canada, U.K., Germany than in the more strictly
regulated markets in France, Italy and Japan.
Perloff et al. (2005) studied the anti-ulcer drug market and found that the
price rose with the entry of other firms. They demonstrated that the effect of entry
on price depends on how close together the products are located in characteristic
space. They showed that if the new product is a perfect substitute to the existing
product, price would fall, but if it is located far apart, then price of the existing
product will not be affected. If the products are located near enough to compete
for the same consumers, then the existing firm will raise prices and sell to
consumers whose demand is relatively inelastic. Ellison et al. (1997) examined
the price sensitivity and generic entry for four cephalosporins. They found high
cross price elasticity among the different generics but low elasticity for
brandname drugs used to treat the same conditions.
To summarize, the goodwill developed by the innovator firm during the
period of patent protection goes a long way in differentiating its product from
later generic entrants. This can be seen from the lukewarm response by brands to
18
generic prices and the inability of generics to swamp the market even with such
large price discounts. In general, one observes falling or stable trends in the prices
of generics and the simultaneous rising trends in their quantities. However, given
the emphasis on cost containment and the growth of managed care, the price
differential between brandname and generic drugs may become lower. As the
cross-price sensitive segment of the market grows, the increases in brandname
prices with generic entry will be dampened. The expansion of the cross-price
elastic segment of the pharmaceutical market would tend to reduce prices if this
growth does not cause an increase in demand of brandname drugs and if the
demand curve for cross-price sensitive consumers is more elastic than the demand
curve for loyal consumers (Frank & Salkever, 1992).
1.5. REGIONAL DISPARITY IN HEALTH EXPENDITURES
Given the disparities in health spending across different regions of the world, in
general, and low purchasing power of consumers in developing countries, in
particular, there continues a raging debate on the extension of pharmaceutical
product patent rights to developing countries. Table 1.1 presents the year of
adoption of product patents for pharmaceuticals for some developed and
developing countries with their GDP per capita at that time. It is clear that
pharmaceutical patent protection was adopted in the developed world recently
after reaching a high level of per capita income. However,
developing countries
now extending protection to pharmaceutical products are at a much lower level of
income than those adopting earlier. This adversely affects the welfare of poor
19
consumers in low-income countries arising from higher prices due to the adoption
of stricter patent laws. In fact,
the Doha Declaration on TRIPs and Public Health
has extended the deadline for the implementation of pharmaceutical patent
protection in 49 least developed countries from 2006 to 2016. These recent steps
implicitly recognize that the trade-offs between pricing and incentives associated
with patents are different for different countries.
Undoubtedly patents stimulate R&D investments for lifesaving drugs, but
at the same time patents also raise pharmaceutical prices for consumers in low-
income countries, denying them access to medicine. The incentives to invest in
research on global diseases in developed and developing countries are different
from those for neglected diseases (like malaria) that primarily affect developing
countries. Witness the case that the USFDA licensed only 8 out of 1,233 drugs
(less than one percent) between 1975 and 1997 for tropical diseases (Lanjouw,
2003). For global diseases, the prime mover for R&D is the market in developed
countries so that extending patent rights to developing countries only raises prices
while contributing little to incentives. Thus, the main policy issue is to stimulate
R&D for “orphan drugs”
1
and neglected diseases
2
since purchasing power in poor
countries is low with very little spending on health care.
Table A1.1 lists the health expenditures of 191 WHO member-countries. It
clearly shows the wide disparities in payments for health expenditures between
1
Orphan drugs are defined as drugs that are developed for orphan diseases affecting less than
200,000 people. These treat conditions that occur rarely and the pharmaceutical industry has little
incentive to venture into these drugs owing to financial considerations.
2
Neglected diseases are mainly tropical diseases that affect millions of people in low-income
countries. But efficacious treatment for these diseases is absent since poor people do not have the
purchasing power to buy those drugs and again the pharmaceutical industry ignores these diseases
due to small market size and low profitability.
20
the developed and developing countries. In some countries like the U.S., South
Africa, France and the Netherlands, the share of private insurance in private
health expenditure is above 50 percent. But, in most middle- and low-income
countries, there is negligible or no insurance plan at all for covering health
expenditures. In general, most of the health expenditure by patients in these
countries is met by out-of-pocket payments, implying that the price of essential
drugs does matter to poor people and to poor countries. Moreover, a high-ability
individual is more likely to be fully insured, while a low-ability individual only
partly insured. Thus, lower income patients are at a disadvantage when it comes
to insurance coverage.
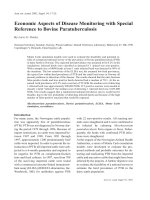
With low purchasing power, sales of drugs in developing countries have
remained much below the level found in affluent countries. In 2000, per capita
expenditures on pharmaceuticals in North America, Europe and Japan were huge
at $484.2, $204.6 and $455.7, respectively as compared to the per capita sales of
only $2.7 in the Indian subcontinent and $6.3 in East Asia including China (Table
1.2). Growth estimates for 2005 also reflect the same scenario with North
America, Europe and Japan accounting for 83 percent of the global sales, and
Southeast Asia, China, India, Latin America and the rest of the world including
Africa contributing to only 17 percent of sales despite being the most densely
populated regions of the world (Figure 1.1).
21
1.5.A. Reform of the patent system
Even after the signing of TRIPs in 1994 and its enforcement in developing
countries by January 2005, there is a question mark on the appropriateness and
equity/efficiency effects of a uniform patent system across the world. Given that
developing countries and the least developed countries not only have low
purchasing power but are also home to many specific diseases and epidemics,
different proposals have been put forward for the reform of the patent system.
These include the proposal for foreign filing licenses by Lanjouw (2003) and
differential pricing by Danzon (2002). In the next chapter, we analyze a proposal
along these lines for exempting developing countries from provisions of TRIPs.
Lanjouw (2003) proposes the foreign filing license solution such that
when a pharmaceutical firm files patents for drugs related to global diseases, the
patent owner cannot claim patent rights worldwide and is required to choose
patent protection either in high-income countries or in low-income countries, but
not both. This would typically lead the patent owner to maintain patent protection
in the former rather than the latter thereby allowing access to generic drugs at
lower prices in developing countries. However, when the pharmaceutical firm
files patents for orphan drugs related to neglected diseases, the patent owners
would be provided protection worldwide to encourage R&D. Thus, this proposal
allows firms to protect their important markets while at the same time allowing
patent rights in developing countries to provide incentives for innovation.
22
1.5.B. Differential pricing
Another policy measure advocated for access to affordable drugs in developing
countries is differential pricing for pharmaceuticals (Danzon, 2002). Differential
pricing entails charging different prices in different markets based on “Ramsey
pricing” such that prices are inversely related to the elasticity of demand. Price
differentials could be such that prices in high-income countries exceed the costs
of production and distribution to cover joint costs of R&D and prices in low-
income countries cover smaller markups. In the absence of parallel imports where
drugs cannot be resold in other countries at cheaper prices and given that demands
are independent for patients in high- and low-income countries, it is reasonable to
charge different prices in the two markets. No doubt, differential pricing and ban
on parallel trade
3
may seem to go against the standard principles of free trade and
marginal cost pricing, but, in the case of research-based pharmaceuticals, joint
costs of R&D cannot be sustained under marginal cost pricing. Thus, from the
viewpoint of efficiency and equity, differential pricing can be welfare-improving
if more new drugs are developed and distributed in developing countries and
lower prices are charged in low-income countries. As opposed to this, uniform
pricing leads to high prices in developing countries or launch delays or even no
launches at all. In fact, van Dijk (1995) in a model of patent breadth generating
linear demand curves shows that dynamic efficiency improves with price
discrimination compared to uniform pricing.
3
Trade in products that occurs outside the official distribution channel of a firm is called parallel
trade. Parallel traders buy products in countries where they are sold at lower prices and sell them
in high-price countries.
23
Demand heterogeneity coupled with low marginal costs of production and
marketing efforts at brand consciousness creates the right setting for nonuniform
pricing (Berndt, 2002). Malueg and Schwartz (1994) demonstrate that when
demand dispersion across markets is large, uniform pricing by a monopolist yields
lower global welfare than third-degree price discrimination
4
. Further, they found
that “mixed systems” permitting discrimination across but not within specific
groups of markets, result in greater welfare than uniform pricing or unrestricted
multimarket discrimination. They conclude against allowing parallel imports and
support international price discrimination that allows serving additional markets.
Moreover, differential pricing has long been a feature of the
pharmaceutical industry. Cash-paying patients pay higher prices than institutional
purchasers and “the law of one price” does not hold for the prescription drug
market (Frank, 2001). In addition, with unequal income distributions within some
countries, a small high-income subgroup dominates potential drug sales. In such
cases, one needs to examine the separability of submarkets within a country say,
by designing programmes that serve only the low-income subgroup and not the
high-income subgroup. In this way, prices could differ between subgroups
nationally and cross-nationally. Jack and Lanjouw (2003) using a public
economics framework for the pricing of pharmaceuticals, show that in the face of
the extremely unequal distribution of world income, even the standard Ramsey
pricing for covering own marginal cost should not be applied for poor countries.
4
Third-degree price dicrimination occurs when a manufacturer is able to segment its customers
into two or more separate markets, each market defined by its unique characteristics and price
elasticity.
24
Our proposal outlined in the next chapter is the scenario where developing
countries are exempt from TRIPs obligations to enforce product patents for
pharmaceuticals. We build a model of pharmaceutical markets in the light of a
patent race among competing firms. The incentive for R&D is the patent on either
the breakthrough or the me-too drug. A feature of our model that has not been
analyzed before is the prevalence of insurance in developed countries as opposed
to developing countries, such that the true burden of financing R&D falls to a
greater extent on the former than the latter. We suggest that generics drugs be
allowed in low-income countries, particularly since most of them do not have a
well-established and functioning pharmaceutical industry. Our model makes a
contribution analogous to Lanjouw (2003) and examines how valuable the
implementation of this proposal would be by undertaking some simulation
exercises.
25