Exact BER analysis and design of prerake combining schemes for direct sequence ultra wideband multiple access systems
Bạn đang xem bản rút gọn của tài liệu. Xem và tải ngay bản đầy đủ của tài liệu tại đây (752.02 KB, 159 trang )
EXACT BER ANALYSIS AND DESIGN OF PRERAKE
COMBINING SCHEMES FOR DIRECT SEQUENCE
ULTRA-WIDEBAND MULTIPLE ACCESS SYSTEMS
CAO WEI
NATIONAL UNIVERSITY OF SINGAPORE
2007
EXACT BER ANALYSIS AND DESIGN OF PRERAKE
COMBINING SCHEMES FOR DIRECT SEQUENCE
ULTRA-WIDEBAND MULTIPLE ACCESS SYSTEMS
CAO WEI
(B. Eng, M. Eng)
A THESIS SUBMITTED
FOR THE DEGREE OF DOCTOR OF PHILOSOPHY
DEPARTMENT OF ELECTRICAL AND COMPUTER ENGINEERING
NATIONAL UNIVERSITY OF SINGAPORE
2007
Acknowledgment
The work in this thesis could not have been accomplished without the contribution
of friendship, support and guidance of many people.
First of all, I would like to express my sincere gratitude to my supervisors, Dr.
Arumugam Nallanathan, Dr. Chin Choy Chai and Dr. Balakrishnan Kannan, for
their valuable guidance and helpful technical support throughout my PhD study.
Had it not been for their advices, direction, patience and encouragement, this
thesis would certainly not be possible. Not only their serious attitude towards
research but also their courage to face difficulties make a great impact on me.
I specially thank Dr. Yong Huat Chew, Dr. Yan Xin and Dr. Meixia Tao,
who are always willing to share their research experiences. I also thank Mr. Siow
Hong Lin, who gives full technical support for a good working environment.
My sincere thanks go to my colleagues in the laboratory for their genuine
friendship and many stimulating discussions in research. Special thanks to
Sheusheu Tan, Feng Wang, Ronghong Mo, Kainan Zhou, Cheng Shan, Tek Ming
Ng, Feifei Gao, Pham The Hanh, Hon Fah Chong, Yan Li, Le Cao, Jianwen
Zhang, Yonglan Zhu, Jinhua Jiang, Lan Zhang, Rong Li, Jun He and Yang Lu.
I am also grateful to all my friends for their deep concern and enthusiastic
support. Sharing with them the joy and frustration has made my life fruitful and
complete.
I dedicate this thesis to my husband, my parents and my brother for their
i
Acknowledgment
great care and endless love to me throughout the years. I will be forever indebted
to them for all that they have done.
Last but not least, I acknowledge National University of Singapore for
supporting my PhD study.
ii
Contents
Acknowledgment i
Contents iii
Summary viii
List of Tables x
List of Figures xi
List of Acronyms xvi
List of Notations xviii
Chapter 1. Introduction 1
1.1 Background of UWB Communications . . . . . . . . . . . . . . . 1
1.2 Current Research and Challenges . . . . . . . . . . . . . . . . . . 4
1.3 Objective and Contribution . . . . . . . . . . . . . . . . . . . . . 6
1.4 Organization of the Thesis . . . . . . . . . . . . . . . . . . . . . . 9
Chapter 2. Overview of UWB Communication Systems 11
2.1 Signal Generating Schemes . . . . . . . . . . . . . . . . . . . . . . 11
2.2 UWB Pulse Shapes . . . . . . . . . . . . . . . . . . . . . . . . . . 13
iii
Contents
2.3 Modulation Schemes . . . . . . . . . . . . . . . . . . . . . . . . . 15
2.4 Multiple Access Schemes . . . . . . . . . . . . . . . . . . . . . . . 16
2.5 Channel Model . . . . . . . . . . . . . . . . . . . . . . . . . . . . 17
2.6 Energy Combining Schemes . . . . . . . . . . . . . . . . . . . . . 19
Chapter 3. Exact BER Evaluation for DS UWB systems in AWGN
Channels 22
3.1 Introduction . . . . . . . . . . . . . . . . . . . . . . . . . . . . . . 23
3.2 System Model . . . . . . . . . . . . . . . . . . . . . . . . . . . . . 25
3.2.1 Signal Format . . . . . . . . . . . . . . . . . . . . . . . . . 25
3.2.2 Template Waveform . . . . . . . . . . . . . . . . . . . . . 26
3.3 Characteristic Function Analysis of DS PAM UWB System . . . . 27
3.3.1 Decision Statistics . . . . . . . . . . . . . . . . . . . . . . 27
3.3.2 Characteristic Function Analysis . . . . . . . . . . . . . . 28
3.4 Characteristic Function Analysis of DS PPM UWB System . . . . 30
3.4.1 Decision Statistics . . . . . . . . . . . . . . . . . . . . . . 30
3.4.2 Characteristic Function Analysis . . . . . . . . . . . . . . 31
3.5 BER Formula . . . . . . . . . . . . . . . . . . . . . . . . . . . . . 34
3.6 BER Derivation Using the GA Method . . . . . . . . . . . . . . . 34
3.7 Numerical Results . . . . . . . . . . . . . . . . . . . . . . . . . . . 35
3.8 Conclusions . . . . . . . . . . . . . . . . . . . . . . . . . . . . . . 41
Chapter 4. Exact BER Analysis and Comparison of DS PAM UWB
and DS PPM UWB systems in Lognormal Multipath Fading
Channels 43
4.1 Introduction . . . . . . . . . . . . . . . . . . . . . . . . . . . . . . 44
4.2 System and Channel Models . . . . . . . . . . . . . . . . . . . . . 46
4.2.1 Signal Format . . . . . . . . . . . . . . . . . . . . . . . . . 46
iv
Contents
4.2.2 Channel Model . . . . . . . . . . . . . . . . . . . . . . . . 47
4.2.3 Received Signal . . . . . . . . . . . . . . . . . . . . . . . . 48
4.3 Characteristic Function Analysis of DS PAM UWB System . . . . 49
4.3.1 Decision Statistics . . . . . . . . . . . . . . . . . . . . . . 49
4.3.2 Characteristic Function Analysis . . . . . . . . . . . . . . 53
4.4 Characteristic Function Analysis of DS PPM UWB System . . . . 55
4.4.1 Decision Statistics . . . . . . . . . . . . . . . . . . . . . . 55
4.4.2 Characteristic Function Analysis . . . . . . . . . . . . . . 59
4.5 BER Formula . . . . . . . . . . . . . . . . . . . . . . . . . . . . . 61
4.6 BER Derivation Using the GA Method . . . . . . . . . . . . . . . 62
4.7 Numerical Results and Comparison . . . . . . . . . . . . . . . . . 63
4.7.1 System Parameters Setting . . . . . . . . . . . . . . . . . . 63
4.7.2 BER Results and Comparison . . . . . . . . . . . . . . . . 66
4.7.3 Explanation Based on Characteristic Functions . . . . . . 69
4.8 Conclusions . . . . . . . . . . . . . . . . . . . . . . . . . . . . . . 73
Chapter 5. Design and Analysis of Prerake DS UWB Multiple
Access Systems Under Imperfect Channel Estimation 75
5.1 Introduction . . . . . . . . . . . . . . . . . . . . . . . . . . . . . . 76
5.2 System Model . . . . . . . . . . . . . . . . . . . . . . . . . . . . . 78
5.2.1 Channel Model . . . . . . . . . . . . . . . . . . . . . . . . 78
5.2.2 Transmitted Signal . . . . . . . . . . . . . . . . . . . . . . 79
5.2.3 Received Signal . . . . . . . . . . . . . . . . . . . . . . . . 80
5.2.4 Channel Estimation . . . . . . . . . . . . . . . . . . . . . . 81
5.3 Signal Modeling and Decision Statistics . . . . . . . . . . . . . . . 82
5.3.1 Signal Modeling . . . . . . . . . . . . . . . . . . . . . . . . 82
5.3.2 Decision Statistics . . . . . . . . . . . . . . . . . . . . . . 83
v
Contents
5.4 BER Performance Analysis . . . . . . . . . . . . . . . . . . . . . . 85
5.5 Multiple Access Performance Analysis . . . . . . . . . . . . . . . 87
5.5.1 Definition of Degradation Factor . . . . . . . . . . . . . . 87
5.5.2 Degradation Factor and Number of Users . . . . . . . . . . 88
5.6 Numerical Results and Discussion . . . . . . . . . . . . . . . . . . 88
5.7 Conclusions . . . . . . . . . . . . . . . . . . . . . . . . . . . . . . 94
Chapter 6. Design and Analysis of High Data Rate Prerake DS
UWB Multiple Access Systems 96
6.1 Introduction . . . . . . . . . . . . . . . . . . . . . . . . . . . . . . 96
6.2 System Model . . . . . . . . . . . . . . . . . . . . . . . . . . . . . 98
6.2.1 Channel Model . . . . . . . . . . . . . . . . . . . . . . . . 98
6.2.2 Transmitted Signal . . . . . . . . . . . . . . . . . . . . . . 99
6.2.3 Received Signal . . . . . . . . . . . . . . . . . . . . . . . . 99
6.2.4 Channel Estimation . . . . . . . . . . . . . . . . . . . . . . 100
6.3 Signal Modeling and Decision Statistics . . . . . . . . . . . . . . . 101
6.3.1 Signal Structure . . . . . . . . . . . . . . . . . . . . . . . . 101
6.3.2 Signal Modeling . . . . . . . . . . . . . . . . . . . . . . . . 101
6.3.3 Decision Statistics . . . . . . . . . . . . . . . . . . . . . . 104
6.4 Distribution of Interference . . . . . . . . . . . . . . . . . . . . . . 105
6.4.1 Inter-Chip Interference . . . . . . . . . . . . . . . . . . . . 107
6.4.2 Multiple Access Interference . . . . . . . . . . . . . . . . . 107
6.5 BER Performance Analysis . . . . . . . . . . . . . . . . . . . . . . 109
6.6 Numerical Results and Discussion . . . . . . . . . . . . . . . . . . 111
6.6.1 Distribution of Interference . . . . . . . . . . . . . . . . . 111
6.6.2 BER Performance . . . . . . . . . . . . . . . . . . . . . . . 113
6.6.3 Effect of Imperfect Channel Estimation . . . . . . . . . . . 115
vi
Contents
6.7 Conclusions . . . . . . . . . . . . . . . . . . . . . . . . . . . . . . 120
Chapter 7. Conclusions and Future Work 122
Bibliography 125
Appendix A. Expectation Related to ˜g
j,k
134
A.1 The 2nd Moment . . . . . . . . . . . . . . . . . . . . . . . . . . . 134
A.1.1 j = L
p
− 1 . . . . . . . . . . . . . . . . . . . . . . . . . . . 134
A.1.2 j = L
p
− 1 . . . . . . . . . . . . . . . . . . . . . . . . . . . 135
A.2 The 4th Moment . . . . . . . . . . . . . . . . . . . . . . . . . . . 135
A.2.1 j = L
p
− 1 . . . . . . . . . . . . . . . . . . . . . . . . . . . 135
A.2.2 j = L
p
− 1 . . . . . . . . . . . . . . . . . . . . . . . . . . . 136
A.3 Expectation of Square Product . . . . . . . . . . . . . . . . . . . 136
List of Publications 137
vii
Summary
Recently, direct sequence ultra-wideband (DS UWB) communication systems
have attracted much attention of both academia and industry because of its
potential for high data rate applications within a short range. In this thesis, we
study two important aspects of DS UWB communication systems: The first one
is to exactly evaluate the bit error rate (BER) performance of DS UWB multiple
access systems. The second one is to effectively capture energy using Prerake
combining schemes.
Although the Gaussian approximation (GA) on the distribution of multiple
access interference (MAI) prevails in previous performance studies of UWB
systems, validity of the GA method is found to be questionable. Hence we
propose to use a novel metho d based on characteristic function (CF) to compute
BER values. We make use of the Fourier transform pair of probability density
function (PDF) and characteristic function to find the distribution of total noise
at the receiver. Then BER formula is derived based on the distribution of total
noise. Our results show that the CF method outperforms the GA method in
both additive white Gaussian noise (AWGN) channels and lognormal multipath
fading channels. Furthermore, the BER formula enables us to accurately compare
the performance of different modulation schemes and provides useful criteria for
choosing appropriate modulation schemes in practical UWB applications.
Rich multipath diversity is an attractive feature of UWB communications.
viii
Summary
However, how to utilize this advantage is not straightforward. We propose to
use the Prerake combining in DS UWB communication systems, which enables
effective energy capture with a simple correlation receiver instead of complex
Rake receivers. Most of previous studies on the Prerake combining address
single user scenario and/or perfect channel estimation, which are impractical
for most UWB applications. Here we consider imperfect channel estimation and
highlight the tradeoff between data rate and system performance in a multiple
access environment. On the other hand, the Prerake combining allows higher
data rate transmission. Hence, we design a high data rate (HDR) Prerake DS
UWB system and employ the CF method to accurately analyze its performance.
ix
List of Tables
3.1 The system parameters used in numerical study . . . . . . . . . . 36
5.1 The system parameters used in numerical study . . . . . . . . . . 89
6.1 The system parameters used in numerical study . . . . . . . . . . 111
x
List of Figures
1.1 FCC regulated spectral mask for indoor and outdoor UWB
communication systems . . . . . . . . . . . . . . . . . . . . . . . . 2
2.1 The Gaussian pulse and its second derivative, the duration of the
pulse is 1ns, the energy is normalized as 1. . . . . . . . . . . . . . 14
2.2 Commonly used modulation methods in UWB communication
systems: (a) binary PAM, (b) binary PPM, (c) OOK. . . . . . . . 15
2.3 Comparison of Rake MRC and Prerake combining . . . . . . . . . 20
3.1 The autocorrelation functions of z(t): (1) is R
P AM
(∆T
k
), (2) is
ˆ
R
P AM
(∆T
k
). . . . . . . . . . . . . . . . . . . . . . . . . . . . . . . 37
3.2 The cross correlation functions of z(t) and q(t): (1) is R
P P M
(∆T
k
),
(2) is R
P P M
(∆T
k
+ T
p
). . . . . . . . . . . . . . . . . . . . . . . . 38
3.3 The BER performance of the DS PAM UWB system under perfect
power control (P
0
= P
1
), number of users is K = 2. . . . . . . . . 39
3.4 The BER performance of the DS PPM UWB system under perfect
power control (P
0
= P
1
), number of users is K = 2. . . . . . . . . 40
3.5 The BER performance of the DS PAM UWB system under
imperfect power control (P
2
= 5P
0
= 5P
1
), numb er of users is
K = 3. . . . . . . . . . . . . . . . . . . . . . . . . . . . . . . . . . 41
xi
List of Figures
3.6 The BER performance of the DS PPM UWB system under
imperfect power control (P
2
= 5P
0
= 5P
1
), numb er of users is
K = 3. . . . . . . . . . . . . . . . . . . . . . . . . . . . . . . . . . 42
4.1 The autocorrelation functions of z(t): (1) is R
P AM
(∆T
k
), (2) is
ˆ
R
P AM
(∆T
k
). . . . . . . . . . . . . . . . . . . . . . . . . . . . . . . 64
4.2 The cross correlation functions of z(t) and q(t): (1) is
R
P P M
(∆T
k
, 0), (2) is R
P P M
(∆T
k
, 1), (3) is
ˆ
R
P P M
(∆T
k
, 0), (4) is
ˆ
R
P P M
(∆T
k
, 1). . . . . . . . . . . . . . . . . . . . . . . . . . . . . 65
4.3 Comparison of the GA and CF methods for the DS UWB systems:
2 users, 3 paths, Nr=64 . . . . . . . . . . . . . . . . . . . . . . . . 66
4.4 Comparison of the GA and CF methods for the DS UWB systems:
2 users, 3 paths, Nr=128 . . . . . . . . . . . . . . . . . . . . . . . 67
4.5 Comparison of the GA and CF methods for the DS UWB systems:
2 users, 3 paths, Nr=256 . . . . . . . . . . . . . . . . . . . . . . . 68
4.6 Comparison of the GA and CF methods for the DS UWB systems:
2 users, 3 paths, Nr=512 . . . . . . . . . . . . . . . . . . . . . . . 69
4.7 The characteristic functions of the DS PAM UWB system: 2 users,
3 paths, Nr=64 . . . . . . . . . . . . . . . . . . . . . . . . . . . . 70
4.8 The characteristic functions of the DS PAM UWB system: 2 users,
3 paths, Nr=512 . . . . . . . . . . . . . . . . . . . . . . . . . . . 71
4.9 The characteristic functions of the DS PPM UWB system: 2 users,
3 paths, Nr=64 . . . . . . . . . . . . . . . . . . . . . . . . . . . . 72
4.10 The characteristic functions of the DS PPM UWB system: 2 users,
3 paths, Nr=512 . . . . . . . . . . . . . . . . . . . . . . . . . . . 73
xii
List of Figures
5.1 BER performance of the Prerake DS UWB system in UWB channel
model CM1 under imperfect channel estimation, the data rate
increasing factor N
c
= 1, 4, 8, 20, the number of users K = 1,
the number of training monocycles N
t
= 100. . . . . . . . . . . . .
90
5.2 BER performance of the Prerake DS UWB system in UWB channel
model CM1 under imperfect channel estimation, the data rate
increasing factor N
c
= 1, 8, the number of users K = 10, 50, the
number of training monocycles N
t
= 100. . . . . . . . . . . . . . . 91
5.3 BER performance of the Prerake DS UWB system in UWB channel
model CM1 under imperfect and perfect channel estimation, the
data rate increasing factor N
c
= 1, 8, the number of users K = 50,
the number of training monocycles N
t
= 100, 200, ∞. . . . . . . . 92
5.4 BER performance of the Prerake DS UWB system in UWB channel
model CM1 and CM3 with different number of users, the data
rate increasing factor N
c
= 1, the number of training monocycles
N
t
= 100, 200, ∞. . . . . . . . . . . . . . . . . . . . . . . . . . . . 93
5.5 The number of users K as a function of degradation factor in CM1
and CM3 under perfect channel estimation. The desired BER is
set as 10
−3
. The data rate increasing factor N
c
= 1, 4, 8. . . . . . . 94
6.1 Comparison of HDR Prerake and Partial-Prerake schemes, (a) is
the channel impulse response h
(k)
(t) with L = 10, (b) is the reversal
of h
(k)
(t), (c) is the structure of two chips (one in dashed lines, the
other in solid lines) in the HDR Prerake scheme, with L
c
= 4,
L
p
= 6, (d) is the structure of two chips (one in dashed lines, the
other in solid lines) in the Partial-Prerake scheme, with L
c
= L
p
= 4.102
xiii
List of Figures
6.2 The variance of ˜g
j,k
, (a) is in CM1, L
p
= 200 with perfect channel
estimation (N
t
= ∞), (b) is in CM1, L
p
= 45 with imperfect
channel estimation (N
t
= 200), (c) is in CM3, L
p
= 400 with
perfect channel estimation (N
t
= ∞), (d) is in CM3, L
p
= 125
with imperfect channel estimation (N
t
= 200). . . . . . . . . . . 106
6.3 Comparison of the simulation PDF of I
M
and its generalized
Gaussian fitting and Gaussian fitting in CM1, R
b
= 50Mbps,
L
p
= 200, L
c
= 5, p erfect channel estimation (N
t
= ∞), 4 users. . 113
6.4 Comparison of the simulation PDF I
M
and its generalized
Gaussian fitting and Gaussian fitting in CM3, R
b
= 25Mbps,
L
p
= 125, L
c
= 10, imperfect channel estimation (N
t
= 200),
4 users. . . . . . . . . . . . . . . . . . . . . . . . . . . . . . . . . .
114
6.5 Comparison of the simulation PDF of I
C
and its Gaussian fitting
in CM3, R
b
= 25Mbps, L
p
= 125, L
c
= 10, imperfect channel
estimation (N
t
= 200), 4 users. . . . . . . . . . . . . . . . . . . . . 115
6.6 BER performance comparison of the HDR Prerake DS UWB
system and the Partial-Prerake DS UWB system in CM1, R
b
=
25Mbps, under both perfect (N
t
= ∞) and imperfect channel
estimation (N
t
= 200). . . . . . . . . . . . . . . . . . . . . . . . . 116
6.7 Comparison of the accuracy of the GA and the CF methods in
BER calculation under perfect channel estimation (N
t
= ∞) in
CM1, R
b
= 50Mbps, L
p
= 45, the number of users K = 4 and 8
respectively. . . . . . . . . . . . . . . . . . . . . . . . . . . . . . . 117
6.8 Comparison of the accuracy of the GA and the CF methods in
BER calculation under imperfect channel estimation (N
t
= 200)
in CM3, R
b
= 25Mbps, L
p
= 125, the number of users K = 4 and
8 respectively. . . . . . . . . . . . . . . . . . . . . . . . . . . . . . 118
xiv
List of Figures
6.9 The effect of imperfect channel estimation (N
t
= 200) with
different number of taps L
p
in Prerake filter in CM1, R
b
= 50Mbps,
L
c
= 5, 4 users. . . . . . . . . . . . . . . . . . . . . . . . . . . . . 119
6.10 Multiple access performance of the HDR Prerake DS UWB system
and the Partial-Prerake DS UWB system under perfect (N
t
= ∞)
and imperfect channel estimation (N
t
= 200), R
b
= 25Mbps, L
c
=
10, E
b
/N
0
= 16dB. . . . . . . . . . . . . . . . . . . . . . . . . . . 120
6.11 The output SNIR as a function of number of taps L
p
in the Prerake
filter under perfect (N
t
= ∞) and imperfect channel estimation
(N
t
= 200, 500, 1000) with E
b
/N
0
= 16dB in CM1, R
b
= 50Mbps,
4 users. . . . . . . . . . . . . . . . . . . . . . . . . . . . . . . . . . 121
xv
List of Acronyms
AWGN additive white Gaussian noise
BER bit error rate
CDMA code division multiple access
CF characteristic function
CLT central limit theorem
DF degradation factor
DS direct sequence
FCC Federal Communications Commission
FDMA frequency division multiple access
GA Gaussian approximation
HDR high data rate
ICI inter-chip interference
IPI inter-pulse interference
IR impulse radio
ISI inter-symbol interference
LOS line-of-sight
MAI multiple access interference
MMSE minimum mean-square error
MRC maximal ratio combining
xvi
List of Acronyms
NBI narrow band interference
NLOS nonline-of-sight
OFDM orthogonal frequency division multiplexing
OOK on-off keying
PAM pulse amplitude modulation
PDF probability density function
PPM pulse position modulation
PSD power spectral density
SI self interference
SINR signal-to-interference-plus-noise ratio
SNR signal-to-noise ratio
TDD time division duplex
TDL tapped delay line
TDMA time division multiple access
TH time hopping
TR transmitted reference
UWB ultra-wideband
WPAN wireless personal area network
xvii
List of Notations
a lowercase letters are used to denote scalars
a boldface lowercase letters are used to denote column vectors
A boldface uppercase letters are used to denote matrices
(·)
T
the transpose of a vector or a matrix
E[·] the statistical expectation operator
⊗ the Kronecker product
0
x
the zero vector with x elements
I
x
the x ×x identity matrix
· the integer floor operation
∗ convolution operation
xviii
Chapter 1
Introduction
In this chapter, the background of UWB communications and an overview
of our work are given. Section 1.1 briefly describes the basic principle of
UWB communications. Current research on UWB communication systems is
summarized in Section 1.2. The objective and contribution of our work are
presented in Section 1.3. The organization of this thesis is given in Section 1.4.
1.1 Background of UWB Communications
With rapid growth of number of wireless devices and ever-increasing demand
on high data rate applications, radio spectrum becomes very precious resource.
Though elaborate effort on well allocating sp ectrum resources has been
continuously taken, it is necessary to find alternative approaches to exploit
spectrum resources efficiently. In recent years, UWB technique has received
significant interest from both research community and industry. The novel
and unconventional approach employed by UWB communications is based on
optimally sharing already occupied sp ectrum by means of the overlay principle,
rather than looking for still available but possibly unsuitable new frequency
bands.
1
1.1 Background of UWB Communications
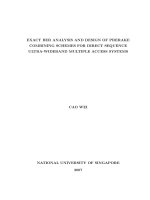
In 2002, the US Federal Communications Commission (FCC) approved the
use of UWB technique for both indoor and outdoor communications in the
frequency band of 3.1GHz to 10.6GHz [1]. According to the FCC regulations,
UWB communication systems are defined as those where the bandwidth is greater
than 500MHz, or where the signal fractional bandwidth is greater than 0.2. The
fractional bandwidth is defined by 2(f
H
− f
L
)/(f
H
+ f
L
), where f
H
is the upper
frequency and f
L
is the lower frequency at the −10dB emission points.
The main limiting factor of UWB communication systems is power spectral
density (PSD) rather than bandwidth. In order to coexist harmoniously with
those existing radio systems in the same frequency band, UWB communication
systems must fulfill certain restriction with respect to both bandwidth and PSD.
In Fig. 1.1, the emission limits and spectral mask assigned by FCC for indoor
and outdoor UWB communication systems are illustrated.
Figure 1.1: FCC regulated spectral mask for indoor and outdoor UWB
communication systems
Due to the super large bandwidth, UWB communications come with unique
advantages including enhanced capability to penetrate through obstacles, ultra
2
1.1 Background of UWB Communications
high precision ranging at the centimeter level, potential for high data rate
transmission along with a commensurate increase in user capacity, and potentially
small size/processing power. All these advantages enable us to use the UWB
technique in various wireless applications, which include:
1. Wireless personal area networks (WPANs): WPANs allow short range ad
hoc connectivity among portable consumer electronic and communication
devices. They are envisioned to provide high-quality real-time multimedia
distribution, file exchange among storage systems, and cable replacement
for home entertainment systems. UWB technique emerges as a promising
physical layer candidate for WPANs, because it offers high data rate
transmission over short range, with low cost and high power efficiency.
2. Sensor networks: Sensor networks consist of a large number of static/mobile
nodes spread across a geographical area. Key requirements for sensor
networks operating in challenging environments include low cost, low power,
and multifunctionality. High data rate UWB communication systems are
well motivated for real-time gathering/disseminating/exchanging a vast
quantity of sensory data. Typically, energy is more limited in sensor
networks than in WPANs because of the nature of sensing devices and
the difficulty in recharging their batteries. Studies have shown that
current commercial Bluetooth devices are less suitable for sensor network
applications because of their energy requirements and system cost [2]. In
addition, exploiting the precise localization capability of UWB promises
wireless sensor networks with improved positioning accuracy.
3. Radar imaging systems: Different from conventional radar systems where
targets are typically considered as point scatterers, UWB radar pulses (also
called UWB monocycle) are generally shorter than the target dimensions.
3
1.2 Current Research and Challenges
The reflected UWB pulses exhibit changes in both amplitude/time shift and
pulse shape. As a result, UWB waveforms exhibit pronounced sensitivity
to scattering relative to conventional radar signals. This property has
been readily adopted by radar systems and can be extended to additional
applications, such as underground and ocean imaging, as well as medical
diagnostics and border surveillance devices.
1.2 Current Research and Challenges
Interest in UWB technique prior to 2001 was primarily limited to military
applications, where supporting large number of users is not necessarily a main
objective. However, multiple access scheme becomes much more important in
commercial applications. Hence choosing an effective multiple access scheme is
the first step in commercialization of UWB. Most of early research focuses on
time hopping (TH) UWB systems [3]. In a typical UWB system, each data
symbol is represented by a number of pulses, and each pulse is put in a frame.
For a TH UWB system, multiple access is achieved by altering the pulse position
from frame to frame, according to the TH code of a specific user. Later, DS
UWB systems [4] attract much attention from both industry and academia,
which enable multiple access by modifying the pulse phase from frame to frame.
Intuitively, TH UWB system is suitable for low data rate applications because of
its relatively low duty cycle, while DS UWB system has the potential to support
high data rate applications. In addition, some research [5][6][7] has shown that
DS UWB systems outperform TH UWB systems in terms of BER performance,
multiple access capability and achievable data rate. Therefore, we concentrate
on DS UWB systems in this thesis.
Unlike those narrow-band wireless communication systems, UWB systems
4
1.2 Current Research and Challenges
suffer much less from channel fading effects. The reason is that extremely
narrow UWB pulses propagate over different paths and cause a large number
of independently fading multipath components. These multipath components
can be distinguished due to fine time resolution, which results in significant
multipath diversity. Although UWB systems feature a certain inherent robustness
to multipath effects, they are not entirely immune to them. For example,
when a symbol sequence goes through multipath channels with large delay
spread, inter-symbol interference (ISI) could occur due to overlapped multipath
components. In a multiple user scenario, MAI and ISI could severely limit the
system p erformance. In performance study of DS code division multiple access
(CDMA) systems, MAI and ISI are generally assumed to be Gaussian distributed.
However, recent studies [8][9] have shown that the Gaussian approximation of
MAI is not suitable in UWB systems. To accurately analyze the performance
and effectively mitigate the interference in UWB systems, it is necessary to study
the statistical properties of the interference.
Another particularly challenging task is the receiver design. The first
proposed UWB receiver is the correlation (matched filter) receiver [3][10][11],
where received signal is correlated with the transmitted pulse. Later, efforts
have been made to exploit rich multipath diversity, which has motivated research
towards designing correlation-based Rake receivers to collect signal energy on
multipaths [12][13]. However, Rake reception generally requires a large number of
fingers with corresponding channel amplitudes and delays which are cumbersome
to obtain [14][15]. In addition, hardware complexity, power consumption and
system cost scale up significantly with increasing number of Rake fingers. To
utilize the multipath diversity, an alternative approach is to use an autocorrelation
receiver which correlates the received signal with a previously received signal
[16][17]. The autocorrelation receiver can capture the entire received signal energy
5