A new hybrid treatment system of bioreactors and electrocoagulation for superior removal of organic and nutrient pollutants from municipal wastewater
Bạn đang xem bản rút gọn của tài liệu. Xem và tải ngay bản đầy đủ của tài liệu tại đây (1.34 MB, 11 trang )
This article appeared in a journal published by Elsevier. The attached
copy is furnished to the author for internal non-commercial research
and education use, including for instruction at the authors institution
and sharing with colleagues.
Other uses, including reproduction and distribution, or selling or
licensing copies, or posting to personal, institutional or third party
websites are prohibited.
In most cases authors are permitted to post their version of the
article (e.g. in Word or Tex form) to their personal website or
institutional repository. Authors requiring further information
regarding Elsevier’s archiving and manuscript policies are
encouraged to visit:
/>Author's personal copy
A new hybrid treatment system of bioreactors and electrocoagulation
for superior removal of organic and nutrient pollutants from municipal
wastewater
Dinh Duc Nguyen
a
, Huu Hao Ngo
b
, Yong Soo Yoon
a,
⇑
a
Department of Chemical Engineering, Dankook University, Republic of Korea
b
School of Civil and Environmental Engineering, University of Technology, Broadway, Sydney, NSW 2007, Australia
highlights
A new hybrid system consisting of RHMBR, MBR and EC was developed.
Complete nitrification was achieved by the combination explored.
T-N concentration in treated effluent of this system was low (3.81 ± 0.9 mg/L).
The system effectively eliminated phosphorus (0.03 ± 0.024 mg/L in treated effluent).
article info
Article history:
Received 3 October 2013
Received in revised form 16 November 2013
Accepted 19 November 2013
Available online 27 November 2013
Keywords:
Integrated hybrid system
Municipal wastewater
Phosphorus
Nitrogen
Internal recycling ratio
abstract
This paper evaluated a nov el pilot scale hybrid treatment system which combines rotating hanging media
bioreactor (RHMBR), submerged membrane bioreactor (SMBR) along with electrocoagulation (EC) as post
treatment to treat organic and nutrient pollutants from municipal wastewater. The results indicated that
the highest removal efficiency was achieved at the internal recycling ratio as 400% of the influent flow
rate which produced a superior effluent quality with 0.26 mgBOD
5
L
À1
, 11.46 mgCOD
Cr
L
À1
,
0.00 mgNH
þ
4
-N L
À1
, and 3.81 mgT-N L
À1
, 0.03 mgT-P L
À1
. During 16 months of operation, NH
þ
4
-N was
completely eliminated and T-P removal ef ficiency was also up to 100%. It was found that increasing in
internal recycling ratio could improve the nitrate and nitrogen removal efficiencies. Moreover, the TSS
and coliform bacteria concentration after treatment was less than 5 mg L
À1
and 30 MPN mL
À1
, respec-
tively, regardless of internal recycling ratios and its influent concentration.
Ó 2013 Elsevier Ltd. All rights reserved.
1. Introduction
The increase of inorganic nutrients in naturally receiving non-
point sources, especially nitrogen and phosphorus, can induce
eutrophication, causing negative effects on water resource quality
(Yang et al., 2010). As a major strategy to control the unintended
nutrient enrichment of surface waters, a number of wastewater
treatment plants have adopted various treatment systems that
can highly and simultaneously remove nitrogen and phosphorus
from wastewater. Among those, biological nutrient removal pro-
cesses, such as suspended and attached growth biofilm techniques,
have been developed and widely applied due to their economic
advantages over other chemical treatment processes (Fan et al.,
2009).
Compared to the common activated sludge process, biofilm pro-
cesses are increasingly being employed in wastewater treatment
because of their advantages due to smaller facility operating areas
footprints, ease of operation, short hydraulic retention time (HRT),
insensitivity to organic and hydraulic shock loading, and higher
biomass concentration (Jou and Huang, 2003; Cresson et al.,
2006; Nguyen et al., 2010). They also minimize biomass drift to
other work units. Nowadays, several new biofilm technologies,
based on the modification of existing processes, have attracted a
great deal of attention from those responsible for treating
wastewater. For example, Tandukar et al. (2007) evaluated the
performance of the down-flow hanging sponge (DHS), which was
preceded by an up-flow anaerobic sludge blanket (UASB) for treat-
ing sewage and showed removal rates of 94.3%, 89.7% and 55.9% for
total BOD, total COD, and T-N, respectively. Kim et al. (2010) re-
ported that the integrated fixed-film activated sludge (IFAS) with
a media of extruded high density polyethylene demonstrated
0960-8524/$ - see front matter Ó 2013 Elsevier Ltd. All rights reserved.
/>⇑
Corresponding author. Tel.: +82 31 8005 3539; fax: +82 31 8021 7216.
E-mail addresses: (D.D. Nguyen), chemyoon@unitel.
co.kr (Y.S. Yoon).
Bioresource Technology 153 (2014) 116–125
Contents lists available at ScienceDirect
Bioresource Technology
journal homepage: www.elsevier.com/locate/biortech
Author's personal copy
higher removal efficiencies of 90%, 90% and 85% for COD, TP
and ammonia, respectively, with a solids residence time (SRT) of
8 days. Recently, Di Trapani et al. (2011). Performance of a
hybrid activated sludge/biofilm process for wastewater treatment
in a cold climate region: Influence of operating conditions. The
results showed that the average removal efficiencies of total COD
and ammonium were higher than 76% and 70–99% for HRT of
3.5 h and 4.5 h, respectively. One of the biofilm support media is
made of plastic. They use various forms/types of plastic, such as
polyethylene (PE) and polypropylene (PP) (Khoshfetrat et al.,
2011).
Hence, when selecting a suitable biofilm carrier media for use in
the RHMBR studies, certain parameters were set (Orantes and
Gonzalez-Martinez, 2003; Levstek and Plazl, 2009; Nacheva and
Chavez, 2010) as follows: (i) the media must have a high specific
surface area to support the high-density presence of active micro-
organism; (ii) it must have a low apparent specific weight per
square centimeter, yet be strong enough to support the added
weight of the cultured biomass; and (iii) the material used must
be durable and highly resistant to environmental conditions, for
effectiveness and longevity. As PE & PP media met these conditions
well, they were chosen as the carrier media to be used for the
RHMBR in this study.
In recent years, membrane bioreactor (MBR) processes have
been widely used to reduce or eliminate nutrients due to their
advantages over other conventional activated sludge systems.
These advantages include a smaller footprint, less sludge produc-
tion, high organic loading rate, highly improved effluent quality,
water reuse and potential for removal of pathogenic microorgan-
isms (Defrance et al., 2000; Le-Clech et al., 2006; Judd Simon and
Claire, 2010). However, the nitrogen removal efficiency of the con-
ventional submerged MBR is limited because its configuration does
not compensate for anaerobic or anoxic conditions that hinder bio-
logical denitrification process (Yang et al., 2009).
Phosphorus discharge standards for municipal wastewater in all
developed and developing countries have become increasingly
stringent, while the phosphorus concentrations in final effluent
from Biological Wastewater Treatment Systems has been difficult
to manage. These limitations have caused levels to exceed more
than 2 mgT-P L
À1
, creating an urgent need for a better treatment
technology. Thus, there is a need to explore novel and applied
advanced technologies to create high efficiency in phosphorus
removal. The criterion for these technologies is restrictive. They
must use less space, lower capital investment; lower installation
cost; have lower operating and maintenance costs, and eliminate
the need for additional, frequent, and expensive chemical use
(Markus et al., 2011; Wahab et al., 2011; Oleszkiewicz and Barnard,
2006; Bektasß et al., 2004). For these reasons and others, this EC pro-
cess study was applied as a post treatment add-on, with potential
for reasonably easy retrofitting to existing facilities.
In this study, a hybrid system consisting of RHMBR – SMBR with
EC as post treatment was developed and implemented as a pilot
scale unit to treat municipal wastewater. The objectives of this
study were: (1) to investigate the performance of an integrated hy-
brid system to remove organics, nitrogen, and phosphorus with re-
spect to the nitrogen and phosphorus loading rate as a function of
operation time or hydraulic residence times; and biological and
non-biological phosphorus removals in the hybrid system were
also studied; (2) to determine the efficiency of T-N, and T-P
removal at different initial concentrations; and (3) to evaluate
the efficiency of denitrification and nitrification toward total
nitrogen removal at different internal recycle ratios of a long-term,
real-world operation.
2. Methods
2.1. Experimental set-up and description
Experiments were conducted using a large pilot-scale hybrid
RHMBR MBR and EC located at the municipal wastewater treat-
ment plant (WWTP) of Y City, Korea, for 475 days of continuous
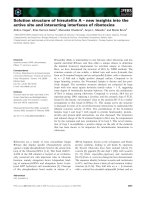
operation as shown in Fig. 1. The pilot system was constructed
using an external steel framework and pre-fabricated PDF wall pa-
nel tank system, with a lining made of high-density polyethylene
(HDPE) inside (Gentrol Co., LTD., Korea). The equalizing reactor
(EQ) with functioned to reduce variation in influent flow, influent
pollutant concentrations/loads, and reduced oxygen concentration
in the internal recycle flows, and was divided into three compart-
ments: EQ1, EQ2, and EQ3. They were constructed with a working
volume of 1.226 m
3
, 1.197 m
3
, and 1.989 m
3
, respectively, followed
sequentially by a RHMBR (9.922 m
3
), a MBR (9.44 m
3
) and then EC
with electrolysis time of approximately 2 min. The influent waste-
water was pumped continuously from WWTP using two sub-
merged pumps (Wilo Pump, Korea) to the pilot system, which
has a working volume of approximately 53 m
3
day
À1
. The influent
was passed through a fine screen (FS), with 5 mm openings, to
remove the larger materials and avoid damage to the work units
beyond, especially the membrane, prior to the wastewater flow
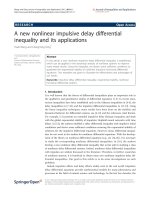
Fig. 1. Schematic diagram of the pilot scale hybrid treatment system used.
D.D. Nguyen et al. /Bioresource Technology 153 (2014) 116–125
117
Author's personal copy
entering the EQ and then the RHMBR. The primary-function of the
RHMBR is denitrification. Secondly, it partially removes phospho-
rus, and, thirdly, it enhances contact between biomass with the
carbon source and nutrients in the wastewater. The RHMBR efflu-
ent was treated using the MBR under aerobic conditions before
being discharged alternately through two automatic suction
pumps (P3, P4). Wastewater level in the MBR reactor was con-
trolled using level sensors. The wastewater was allowed to flow
naturally from the EQ through the RHMBR to the MBR via gravity
flow to save capital costs.
Both the equalizing reactor and RHMBR were agitated at
120 rpm and 0.16 rpm, respectively by a commercial agitator
(Hyup Dong Co., LTD., Korea). In RHMBR, fiber polypropylene med-
ia was hung on a mount and turned around the axis of the agitator
at the center of the reactor (Fig. 1). The packing ratio of the fibrous
was 60 ± 5% based on the volume of the reactor for the attached
growth biomass. The picture of polypropylene fiber media is
shown in Fig. 1c. A bundle of the media consisted of thousands
of fibers having a total specific surface area of 560–725 m
2
m
À3
,
and a specific weight of 0.530 ± 0.027 kg m
À3
.
Two flat-sheet modules of submerged membrane in the MBR
were microfiltration membranes (model TC10A05, Yuasa Corpora-
tion, Korea) with outline dimensions of 1.3 m in length, 0.75 m in
width, and 1.52 m in height. The number of membrane elements
was 75 per module. The effective filtration area per membrane ele-
ment was 0.8 m
2
with an average pore size of 0.25
l
m (ranging
from 0.1 to 0.45
l
m) and total surface area of 120 m
2
. The designed
operational trans-membrane pressure (TMP), in the range of À0.05
to 0.0 MPa, and the phenomenon of bio-fouling in the MBR were
monitored for changes in TMP via the vacuum gauge. The pri-
mary-function of MBR is to maintain a high biomass density under
aerobic conditions and separation of particles larger than the
membrane pore size.
Two air blowers (3 phase Ring blower, model HRB-402S, Hwang
Hae Electric Co., Ltd.) were operated alternately, maintaining an
uninterrupted air supply through an air diffuser system. It was in-
stalled beneath the membrane modules to provide coarse bubble
aeration (15.49–17.98 m
3
air h
À1
) for enhanced organic carbon oxi-
dation and nitrification while helping to reduce the membrane foul-
ing and increase the sludge mixing. All pumps, agitators, air blowers,
electric valves, sensors, membrane backwashing system and other
equipment were automatically controlled by a programmable logic
controller (PLC). There was also a manual operating mode.
A flow diagram of the EC process used in this study is shown in
Fig. 1b. A small portion of wastewater from the effluent of the hy-
brid pilot plant was contained in a 200 L polypropylene tank. From
this tank, wastewater was continuously pumped through the flow
meter in an upward axial flow through an annular region between
two coaxial cylinders of radius 5 cm and 9.5 cm in the EC reactor as
shown in Fig. 1d. Electrodes were connected to a Dual DC Power
Supply (Sunchang Electronic Co., LTD., South Korea) which in-
cludes: voltage and current monitor, an on-off switch, and a rheo-
stat used to vary the desired output voltage. In each channel of the
DC power supply, there are digital voltage meters with a voltage
response (0–30 V) monitor and current meter to set the applied po-
tential and current level.
2.2. Operating conditions
Characteristics of raw and treated municipal wastewater used
for the hybrid pilot plant are shown in Table 1.
The DO concentrations in the RHMBR and MBR were controlled
and sustained under 0.05 mg L
À1
and over 1.7 mg L
À1
, respectively,
during the study period. In addition, pH in each tank ranged from
6.6 to 8.0. Water flux and TMP were maintained in a range of
18.45–28.21 L m
À2
h
À1
(LMH) and 20.0–51.0 kPa, respectively.
The MBR was operated for a 10 min cycle-filtration consisting of
9 min of filtration and 1 min of relaxation. An internal recycle flow
(R) rate from the MBR to the EQ (like a buffer tank) was performed
to carry out reduced oxygen concentration in the internal recycle,
denitrification and phosphorus removal. The recirculation flow rate
was adjusted into the compartments (EQ1, EQ2, and EQ3) of EQ as
shown in Table 2. The R value remained at 1.0, 2.0, 3.0 and 4.0,
based on the influent flow rate, corresponding to Run 1, Run 2,
Run 3 and Run 4, respectively. The primary-function of MBR is to
maintain a high biomass density under aerobic conditions and sep-
aration of particles larger than the membrane pore size. Through-
out the study period, MLSS in the RHMBR and MBR was kept at
around 4155–7810 mg L
À1
and 4565–8690 mg L
À1
, respectively,
depending on the internal recycling ratio. Excess sludge was dis-
charged from the MBR tank to keep the MLSS concentrations at
the designated values with an amount of 120–180 L day
À1
. Specific
HRTs of the individual reactors, recirculation ratios and other
parameters are summarized in Table 3.
The EC process consists of a pair of aluminum electrodes cylin-
drically shaped and placed in concentric cylinders together. The in-
side electrode has dimensions of 5 cm ID Â 45.5 cm H with a
geometric area of 714.71 cm
2
while outside electrode has dimen-
sions of 9.5 cm OD Â 50 cm H with a geometric area of
1492.26 cm
2
and a working surface area of 1357.95 cm
2
. The gap
between the electrodes was 2.25 cm (Fig. 1d). During operation, a
constant electric potential of 10 volts (V) was applied with a
hydraulic retention time of 2 min (more details are summarized
in Table 6).
2.3. Analytical methods
The influent, EQ, RHMBR, MBR and the effluent samples were
collected 1–3 times per week to monitor the performance and kept
in a refrigerator prior to analyses. The water quality parameters
including biological oxygen demand (BOD
5
), total coliform, mixed
liquor volatile suspended solids (MLVSS), mixed liquor suspended
solids (MLSS), total suspended solids (TSS) and alkalinity were ana-
lyzed according to standard methods (APHA, 2005). Chemical oxy-
gen demand (COD
Cr
), total nitrogen (T-N), ammonia nitrogen
(NH
þ
4
-N), nitrate (NO
À
3
-N), total phosphorus (T-P), phosphate
Table 1
Characteristics of raw municipal wastewater.
Parameters Units Raw water
Range Average
pH Unitless 7.0–8.0 7.70
SS mg L
À1
175–460 281.90
BOD
5
mg L
À1
166.73–222.32 205.76
COD
Cr
mg L
À1
187.7–334.9 238.83
T-N mg L
À1
30.83–63.08 41.16
NO
À
3
-N mg L
À1
0.00–1.06 0.20
NH
þ
4
-N
mg L
À1
18.89–43.54 29.85
PO
3À
4
-P
mg L
À1
2.51–6.95 4.46
T-P mg L
À1
3.00–8.39 5.45
Alkalinity mgCaCO
3
L
À1
90–220 163.43
Coliform bacterial MPNÁ(100 mL)
À1
1.5E + 6–2.0E + 7 7.56E + 06
COD:N:P ratio 43.85:7.55:1.00
Table 2
Distribution mechanism of internal recycle flows into the compartments of EQ.
Recirculation modes (internal recirculation value) EQ1 EQ2 EQ3
Run 1 (1Q) 1Q
Run 2 (2Q) 1Q 1Q
Run 3 (3Q) 1Q 1Q 1Q
Run 4 (4Q) 1Q 1Q 2Q
118 D.D. Nguyen et al. /Bioresource Technology 153 (2014) 116–125
Author's personal copy
(PO
3À
4
-P) were analyzed with analyzer kits using
Spectrophotometer HS 3300, and an HS R200 Oven (Humas Co.,
LTD., Korea). Values for pH, and both dissolved oxygen (Martin &
Nerenberg) concentration and temperature were measured online
using a XL60 (Accumet
Ò
XL60, Thermo Fisher Scientific Inc.) and
YSI 550A DO Instrument (YSI Environmental, US), respectively.
All samples from EQ, RHMBR, MBR, and after EC treatment, were
filtered using a Whatman
Ò
GF/C glass microfiber filters 1.2
l
m.
3. Results and discussion
3.1. Ammonia nitrogen removal
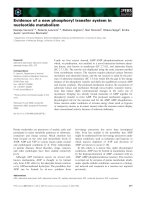
Fig. 2 shows the ammonia nitrogen concentration in each reac-
tor both in influent flow and effluent flow, and NH
þ
4
-N loading
rate, NH
þ
4
-N/MLVSS ratio based on MLVSS in MBR, and COD
Cr
/
NH
þ
4
-N ratio in the hybrid system during operation. It was ob-
served that the nitrogen removal in this system was based on
simple denitrification in RHMBR, followed by nitrification in
MBR, where nitrifying bacteria convert nitrogen in the form of
ammonia into nitrite and nitrate. Nitrification is the important
primary process in removing total nitrogen from influent waste-
water. However, its requirements of long SRT and high DO con-
centration are usually considered as the limiting steps of the
nitrogen removal process in wastewater (Tan and Ng, 2008). As
shown in Fig. 2a, the influent NH
þ
4
-N concentration ranged from
18.86 to 43.46 mg L
À1
with an average of 29.79 ± 4.69 mg L
À1
.
The final effluent NH
þ
4
-N concentrations of all runs was nil. This
means that the nitrification process in this system was fully com-
pleted as all NH
þ
4
-N was converted into nitrate throughout the
Table 3
Operational conditions of the hybrid pilot plant.
Factors Internal recirculation rate (R)
Run 1 Run 2 Run 3 Run 4
Influent flow rate (m
3
day
À1
) 55.0–65.0 (60.64) 46.0-63.0 (57.67) 44.6-59.6 (51.43) 45.0-66.3 (52.44)
Anoxic/anaerobic HRT (h) 1.83–2.16 (1.97) 1.26-1.73 (1.39) 1.00-1.33 (1.16) 0.72-1.06 (0.92)
Oxic HRT (h) 1.74–2.06 (1.87) 1.20-1.64 (1.32) 0.95-1.27 (1.11) 0.68-1.01 (0.87)
MLSS (g L
À1
) in MBR 5.33–8.055 6.73-8.69 4.565-7.260 5.438-6.980
MLSS (g L
À1
) in RHMBR 4.960–6.63 5.64-7.81 4.155-6.40 5.06-6.295
Sludge waste (L day
À1
) 120–180
SRT (day) 16.15–20.11 (17.04)
Flux (LMH) 18.45–28.21 (22.81)
TMP (kPa) 20.0–51.0 (31.72)
Anoxic DO (mg L
À1
) 0.00–0.05 (0.03)
Oxic DO (mg L
À1
) 1.70–3.21 (2.64)
Operation cycle (min) 9 min filtration + 1 min idle
Specific aeration (m
3
airÁh
À1
) 15.49–17.98
Temperature 13.2–25.6 (20.35)
pH 7.01–7.95 (7.67)
Chemical cleaning reagents NaOCl solution 0.5–1.2%
F:M ratio (gCOD/g MLVSS) 0.1–0.21 (0.15) 0.09–0.16 (0.11) 0.08–0.19 (0.12) 0.09–0.16 (0.11)
The average value is show in parentheses.
Table 4
Nitrogen removal during the operational period of different Runs.
R parameter Unit process
Influent EQ3
a
RHMBR
a
MBR
a
Effluent
Run 1
T-N (mg L
À1
) 42.43 ± 6.65 8.39 ± 1.58 9.45 ± 0.56 12.09 ± 1.41 11.17 ± 1.21
NO
À
3
-N (mg L
À1
) 0.55 ± 0.23 1.38 ± 0.82 0.00 ± 0.00 9.95 ± 1.34 9.61 ± 1.27
NH
þ
4
-N (mg L
À1
)
25.45 ± 4.30 7.07 ± 0.82 7.66 ± 1.25 0.00 ± 0.00 0.00 ± 0.00
pH 7.67 ± 0.27 7.56 ± 0.32 7.47 ± 0.33 7.21 ± 0.32 6.93 ± 0.31
Alk. (mg L
À1
) 164.3 ± 12.6 – 114.8 ± 12.9 62.7 ± 8.6 –
Run 2
T-N (mg L
À1
) 43.04 ± 8.05 7.96 ± 2.57 8.62 ± 1.54 10.03 ± 1.61 9.55 ± 1.30
NO
À
3
-N (mg L
À1
) 0.48 ± 0.10 2.28 ± 1.80 0.05 ± 0.12 8.22 ± 0.85 8.18 ± 0.86
NH
þ
4
-N (mg L
À1
)
25.95 ± 2.24 5.42 ± 1.37 5.20 ± 1.55 0.06 ± 0.15 0.00 ± 0.00
pH 7.66 ± 0.30 7.48 ± 0.44 7.37 ± 0.40 7.25 ± 0.27 7.08 ± 0.14
Alk. (mg L
À1
) 165 ± 12.1 – 109.64 ± 15.5 74.36 ± 16.1 –
Run 3
T-N (mg L
À1
) 41.24 ± 7.36 7.60 ± 2.25 5.75 ± 1.53 7.31 ± 1.64 6.34 ± 1.39
NO
À
3
-N (mg L
À1
) 0.11 ± 0.17 2.52 ± 1.16 0.32 ± 0.39 5.42 ± 1.27 5.1 ± 1.33
NH
þ
4
-N (mg L
À1
)
29.45 ± 3.86 3.75 ± 0.98 4.01 ± 0.99 0.12 ± 0.15 0.00 ± 0.00
pH 7.69 ± 0.19 7.63 ± 0.13 7.66 ± 0.15 7.59 ± 0.18 7.54 ± 0.20
Alk. (mg L
À1
) 170.33 ± 16.4 – 99.7 ± 10.1 71.48 ± 12.4 –
Run 4
T-N (mg L
À1
) 40.48 ± 6.58 6.41 ± 1.66 3.53 ± 1.24 4.44 ± 0.89 3.81 ± 0.90
NO
À
3
-N (mg L
À1
) 0.06 ± 0.14 1.86 ± 0.98 0.25 ± 0.33 3.88 ± 0.77 3.4 ± 0.74
NH
þ
4
-N (mg L
À1
)
31.47 ± 4.97 2.70 ± 0.79 2.36 ± 0.76 0.25 ± 0.16 0.00 ± 0.00
pH 7.41 ± 0.2 7.36 ± 0.49 7.46 ± 0.12 7.45 ± 0.15 7.41 ± 0.14
Alk. (mg L
À1
) 152.6 ± 20.2 – 104.7 ± 13.2 72.7 ± 8.61 –
Alk. = Alkalinity (mg CaCo
3
L
À1
).
a
The values measured after filtering through glass microfiber filters 1.2
l
m.
D.D. Nguyen et al. /Bioresource Technology 153 (2014) 116–125
119
Author's personal copy
entire study (Fig. 2a). This complete and constant removal of
NH
þ
4
-N was definite, regardless of any internal recycling ratios,
or variations in the influent strength and the NH
þ
4
-N loading rate.
It also corresponded to volumetric NH
þ
4
-N loading rate based on
the volume of MBR from 0.1 to 0.29 kgNH
þ
4
-N m
À3
day
À1
with
an average of 0.17 ± 0.031 kgNH
þ
4
-N m
À3
day
À1
(Fig. 2b and
Table 4). The results show that in all running modes, the nitrifica-
tion of NH
þ
4
-N always occurred completely in MBR but incom-
plete denitrification in RHMBR was observed (Fig. 4c). This can
be explained by the process of agitation in the RHMBR was not
completely mixed.
Guo et al. (2009) reported that NH
þ
4
-N removal of more than
99% with 10% sponge media at NH
þ
4
-N influent concentration of
15–20 mg L
À1
. It also determined the ratio of NH
þ
4
-N/MLVSS base
on the MLVSS in MBR. The ratio of COD
Cr
/NH
þ
4
-N in the influent
during operation of the hybrid pilot plant was also determined,
as shown in Fig. 2c and d.
In addition, during the monitoring period of hybrid system, the
average alkalinity concentration in influent, RHMBR and MBR were
163.43 ± 19.06, 103.28 ± 12.65 and 71.89 ± 11.45, respectively. The
alkalinity in RHMBR was higher than that in MBR as in addition to
being available in the inflow of wastewater, alkalinity is also
Table 5
The influent and effluent T-P, PO
3À
4
-P concentrations and various key parameters of ratios versus phosphorus during the operational period of different Runs.
Parameters Internal recirculation rates
1234
T-P of influent (mg L
À1
) 5.23 ± 1.05 5.53 ± 0.80 5.28 ± 1.09 5.72 ± 0.69
PO
3À
4
-P of influent (mg L
À1
)
3.95 ± 0.46 4.40 ± 0.47 4.33 ± 0.94 4.75 ± 0.89
T-P of effluent (mg L
À1
) 0.39 ± 0.38 1.05 ± 0.27 1.30 ± 0.32 1.49 ± 0.27
PO
3À
4
-P of effluent (mg L
À1
)
0.39 ± 0.39 1.02 ± 0.24 1.29 ± 0.33 1.25 ± 0.34
T-P of final effluent
a
0.03 ± 0.024 mg/L (99.33 ± 0.56%)
T-P loading rate (g m
À3
day
À1
) 16.42 ± 3.60 16.57 ± 3.34 14.07 ± 3.35 15.25 ± 2.25
COD
Cr
/T-P ratio
b
51.93 ± 11.90 47.04 ± 6.79 46.45 ± 11.43 41.79 ± 7.15
T-N/T-P ratio
b
8.60 ± 3.12 7.93 ± 2.30 8.16 ± 2.52 7.25 ± 1.41
PO
3À
4
-P/T-P ratio
b
0.78 ± 0.15 0.82 ± 0.16 0.84 ± 0.17 0.84 ± 0.16
NO
À
3
-N/T-P ratio
c
1.84 ± 0.45 2.42 ± 0.34 2.31 ± 0.59 2.16 ± 0.49
COD:N:P ratio 50.15:8.11:1.0 46.43:7.78:1.0 44.60:7.81:1.0 40.99:7.07:1.0
a
Using Electrocoagulation at post-treatment.
b
The ratio of influent wastewater.
c
The ratio of total nitrate to total phosphorus entering anoxic/anaerobic tank. Values in the above table is the average values.
Table 6
Summary of some key operating parameters and results during operation of EC
process.
No. Parameters Average (range)
1 Initial T-P (mg/L) 5.45 ± 0.95 (3.00–8.39)
2 T-P of effluent without EC (mg L
À1
) 1.28 ± 0.41 (0.04–2.09)
3 T-P of effluent with EC (mg L
À1
) 0.03 ± 0.02 (0.00–0.11)
4 pH of effluent flow 7.67 ± 0.16 (7.10–7.92)
5 Electrical conductivity (
l
Scm
À1
) 460.02 ± 0.07 (431.00–
548.00)
6 Current (Ampere, A) 1.91 ± 0.07 (1.80–2.10)
7 Current densities (A m
À2
) 4.61 ± 0.18 (4.34–5.07)
8 Specific energy consumption, SEC
(kWh m
À3
)
a
0.2733 ± 0.0104 (0.2573–
0.3002)
9 Specific aluminum consumption, SAC
(g m
À3
)
9.1725 ± 0.3489 (8.6349–
10.0741)
10 The mole ratio of Al to T-P 8.4416 ± 2.2729 (5.3293–
15.1614)
11 Sludge generated (kg m
À3
) 0.0437 ± 0.0106 (0.022–
0.0437)
12 Upflow velocity (m s
À1
) 0.0038
13 Hydraulic retention time (min) 2
14 Applied electric potential (Volts, V) 10
a
Electric energy consumption of EC process.
0
2
4
6
8
10
20
30
40
0
20
40
60
80
100
0.1
0.2
0.3
0.004
0.006
0.008
0.010
Influent (mg/L)
Conc. (mgNH
4
+
-N/L)
MBR* (mg/L) RHMBR* (mg/L) Effluent (mg/L)
Conversion efficiency (%)
Removal efficiency (%)
Run 4Run 3Run 2
Run 1
A
NH
4
+
-N loading (kg/m
3
.day)
(c)
(a)
(b)
A: NH
4
+
-N loading rate (Kg/m
3
.day) base on the volume of MBR
B
NH
4
+
-N/MLVSS ratio
B: NH
4
+
-N/MLVSS ratio base on the MLVSS in MBR
0 25 50 75 100 125 150 175 200 225 250 275 300 325 350 375 400 425 450 475
6
9
12
15
(d)
C: COD
Cr
/NH
4
+
-N ratio of the influent wastewater
C
O
p
eration time
(
da
y
s
)
COD
Cr
/NH
4
+
-N ratio
Fig. 2. Variations of NH
þ
4
-N concentrations, NH
þ
4
-N conversion efficiency, NH
þ
4
-N loading rate, NH
þ
4
-N/MLVSS, and COD
Cr
/NH
þ
4
-N ratio in the hybrid system during operation.
120 D.D. Nguyen et al. /Bioresource Technology 153 (2014) 116–125
Author's personal copy
produced in denitrification under RHMBR condition and then is
partially consumed in the nitrification process under MBR condi-
tion. The results indicated that there was enough buffering avail-
able in the wastewater for nitrogen, phosphorus removal process
in particular, and a biological process in general throughout all
runs.
3.2. Total nitrogen removal and mechanism
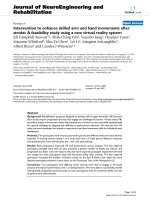
The influent and effluent of T-N concentrations and T-N re-
moval efficiencies; COD
Cr
/T-N ratio in the influent, and volumetric
nitrogen loading rater (NLR) based on the total volume of RHMBR
and MBR in this system are shown in Fig. 3c. The average influent
T-N concentration, COD
Cr
/T-N ratio in the influent, and NLR were
41.16 ± 7.04 mg L
À1
, 5.96 ± 1.14, 0.11 ± 0.02 kgTN m
À3
day
À1
,
respectively. Fig. 3a shows that as the internal recycle ratio (R)
increased from 1.0 to 4.0, the T-N removal efficiencies increased
from 72.99 ± 5.95% to 90.42 ± 2.43%, which corresponds to the final
effluent T-N concentration of 11.17 ± 1.21 mg L
À1
–
3.81 ± 0.9 mg L
À1
, respectively.
In this study, four recycle ratios 1, 2, 3, and 4 were investigated.
The higher the recycle ratio (R), the better the nitrogen removal
was. For example, the T-N removal efficiencies were increased
from 72.99 ± 5.59% (R = 1), 77.06 ± 5.99% (R = 2), 84.24 ± 4.09%
(R = 3) to 90.42 ± 2.43% (R = 4), respectively. The results also indi-
cated that total nitrogen levels could be achieved less than
10 mg L
À1
with a circulation rate. Thus, in this study, the most
appropriate circulation rate should be used in Runs 3 or 4 in terms
of nutrient removal.
However, the experimental results also demonstrated that the
changes in the COD
Cr
/T-N, COD
Cr
/NH
þ
4
-N and NH
þ
4
-N/MLVSS ratio
ranged from 3.52 to 8.82 (Fig. 3b), 4.72–13.13 (Fig. 2d), and
0.0036–0.01037 (Fig. 2c), respectively, but did not significantly af-
fect T-N, NH
þ
4
-N and COD
Cr
removal. On the other hand, changes in
the R strongly effected the T-N removal. With an increase in the R,
nitrogen removal efficiency significantly improved. The effect of
the R on nitrogen removal was also investigated in previous studies
(Baeza et al., 2004; Tan and Ng, 2008). Ahn et al. (2005) have
shown that the T-N removal efficiency improved to 67% as the
internal recycle ratio was 300% of influent flow rate. Similarly,
Lee et al. (2010) observed that T-N removal efficiency was in-
creased from 70 ± 9% to 89 ± 3% in a pre-denitrification membrane
process as the internal recycle ratio from aerobic to anoxic zone in-
creased from 2 to 6.
Temperature is one of the important factors in the process of
nitrification and denitrification. During operation, the temperature
was varied from 13.2 °C to 25.6 °C. Depending on the variations of
the internal cycling ratio, the biomass concentrations were con-
trolled from 3.330 to 6.949 gMLVSS L
À1
(4.155–7.810 gMLSS L
À1
)
and from 3.640 to 6.881 gMLSS L
À1
(4.565–8.690 gMLSS L
À1
)in
RHMBR and MBR, respectively (Table 3).
During the operating period, the COD
Cr
/T-N ratios in the influ-
ent flow rate were between 3.52 and 8.22, with an average
5.96 ± 1.14 (Fig. 3b), Alkalinity buffering in the RHMBR and MBR
was 103.28 ± 13.16 mgCaCO
3
L
À1
and 71.89 ± 11.65 mgCaCO
3
L
À1
,
respectively. The experimental results also suggested that there
was enough carbon available in the municipal wastewater for re-
moval of nitrogen in all runs, without adding an external carbon
and energy source.
The variations of NO
À
3
-N concentrations during the study are
also represented in Fig. 4. During the whole operation, the initial
concentrations of NO
À
3
-N in the wastewater were low (0.0–
1.06 mg L
À1
, average of 0.16 mg L
À1
). The NH
þ
4
-N concentration in
final effluent were zero, indicating almost NH
þ
4
-N completely nitri-
fication to NO
À
3
-N in the MBR (Fig. 2). The average of NO
À
3
-N con-
centrations in the final effluent were low and significantly
decreased, from Run 1 to Run 4 were 9.61 ± 1.27 mg L
À1
,
8.18 ± 0.86 mg L
À1
, 5.10 ± 1.33 mg L
À1
, and 3.4 ± 0.74 mg L
À1
(Fig. 4d), respectively. In general, the experimental results demon-
strated that the R influenced the nitrification and denitrification.
The increase in R improved the nitrification rate in MBR conditions
(Fig. 4c), but gradually reduce the denitrification rate in RHMBR
conditions (Fig. 4b).
However, the nitrification efficiency was high enough to pro-
duce low NO
À
3
-N concentrations of 0.0–1.26 mg L
À1
(average of
0.25 mg L
À1
) after flowing through the RHMBR, indicating that
most of NO
À
3
-N in the MBR was converted into nitrogen gas in
the anoxic/anaerobic conditions of the RHMBR. The RHMBR
showed its important role in the denitrification process, which
can provide media support for microbial growth utilizing excellent
material, and agitation to increase contact with denitrifying bacte-
ria. In addition, these results also demonstrated that T-N removal
efficiency increased with increasing in the internal recycling ratio
R. The T-N in the final effluent was mainly in the form of NO
À
3
-N,
with concentrations ranging from 1.89 to 11.4 mg L
À1
with respect
to the R. However, an increased internal recycle ratio would in-
crease the energy consumption, causing a subsequent increase
the operating costs.
3
6
9
12
40
50
60
70
20
40
60
80
100
0 25 50 75 100 125 150 175 200 225 250 275 300 325 350 375 400 425 450 475
0.05
0.10
0.15
0.20
0.05
0.10
0.15
0.20
Influent (mg/L) Effluent (mg/L)
T-N loading rate (kg/m
3
.day)
T-N Removal efficiency (%)
T-N LR: T-N loading rate (kg/m
3
.day)
Run 1
T-N removal efficienc
y
(
%
)
Run 4Run 3Run 2
(a)
(c)
(b)
O
p
eration time
(
da
y
s
)
T-N LR
T-N concentration (mg/L)
4
6
8
10
4
6
8
10
COD
Cr
/T-N
COD
Cr
/T-N ratio of the influent wastewater
Fig. 3. Variations of T-N concentrations, T-N removal efficiency, COD
Cr
/T-N ratio, and NLR in the pilot system during operation.
D.D. Nguyen et al. /Bioresource Technology 153 (2014) 116–125
121
Author's personal copy
Consequently, it is suggested that the total recycling ratio can
be adjusted according to the effluent nitrogen requirements. It is
important in choosing the best value internal recirculation by
balancing between energy costs, effluent nitrogen quality
requirements and a number of other parameters that would be
favorable to improving the effluent quality.
3.3. Phosphorus removal
Figs. 5(b–e) shows the variations of phosphorus concentrations
in influent, effluent, and in each tank’s total phosphorus removal
efficiency, T-P loading rate, T-N/T-P ratio, and COD
Cr
/T-P ratio of
the influent wastewater in different phases throughout the study.
The influent T-P concentration fluctuation ranged between 3.00
and 8.39 mg L
À1
(average 5.45 ± 0.95 mg L
À1
) and generally, the
effluent T-P concentration was stable and lower than 2.0 mg L
À1
with an average of 1.28 ± 0.41 mg L
À1
regardless of internal recy-
cling ratios (Fig. 5b). The influent total nitrogen to total phosphorus
ratio was in a range between 4.15 and 18.87 (average 7.87 ± 2.26)
(Fig. 5e). The influent COD
Cr
to total phosphorus ratio was in a
range between 27.44 and 87.39 (average 45.53 ± 10.29) (Fig. 5d).
In terms of the specific operating conditions, the average T-P
0.0
0.5
1.0
0.0
0.5
1.0
1.5
3
6
9
12
3
6
9
12
0 25 50 75 100 125 150 175 200 225 250 275 300 325 350 375 400 425 450 475
0.000
0.001
0.002
0.003
Influent (mg/L)
Run 4
Run 3
Run 2
Run 1
RHMBR* (mg/L)
NO
3
-
-N concentration (mg/L)
MBR* (mg/L)
Effluent (mg/L)
NO
3
-
-N/MLVSS ratio base on the MLVSS in RHMBR
(e)
(d)
(c)
(b)
(a)
Operation time (days)
NO
3
-
/MLVSS
NO
3
-
-N/MLVSS ratio
Fig. 4. Variations of NO
À
3
-N concentrations, removal efficiency and NO
À
3
-N/MLVSS in the pilot system during operation.
0
1
2
3
4
5
6
7
8
9
0
20
40
60
80
100
0
1
2
3
4
5
6
7
8
(a)
(d)
(c)
(b)
T-P remv. _without EC (%) T-P remv. _with EC (%)
T-P conc. eff._with EC (mg/L) T-P conc. eff._without EC (mg/L)
T-P con. influent (mg/L) T-P con. in RHMBR (mg/L)* T-P con. in MBR (mg/L)*
T-P conc. (mg/L)
T-P removal (%)
Run 4Run 3Run 2
R
un
1
40
60
80
(e)
Starting EC
T-P LR: T-P loading rate (kg/m
3
.day)
COD
Cr
/T-P ratio
COD/TP
0 25 50 75 100 125 150 175 200 225 250 275 300 325 350 375 400 425 450 475
4
8
12
16
Operation time (days)
T-N/T-P ratio
TN/TP
10
20
T-P LR
T-P loading (kg/m
3
.day)
PO
4
3-
-P con. influent (mg/L)
PO
4
3-
-P con. influent (mg/L) PO
4
3-
-P con. effluent (mg/L)
-40
-20
0
20
40
60
80
100
PO
4
3-
-P removal efficiency (%)
PO
4
3-
-P removal (%)
Fig. 5. Variations of T–P concentrations and PO
3À
4
-P concentrations, and removal efficiencies, T-P loading rate, COD
Cr
/T-P ratio, and T-N/T-P ratio in the pilot system during
operation.
122 D.D. Nguyen et al. /Bioresource Technology 153 (2014) 116–125
Author's personal copy
removal efficiencies of the hybrid system without an EC process
were 92.61 ± 7.57%, 80.78 ± 5.49%, 74.42 ± 8.26%, and
73.44 ± 6.03%, corresponding to Rs 1, 2, 3 and 4, respectively. These
results showed the influence of the internal recirculation flow on
the phosphorus removal performance of the system, and in partic-
ular, the effect of dissolved oxygen and nitrate concentrations,
caused by changes in the internal recirculation ratios (Chen et al.,
2011; Ozgur Yagci et al., 2003). It should be noted that the high
T-P removal efficiency in the first phase was attributed to the effect
of high biomass production which occurred through assimilation
(Monclús et al., 2010).
Fig. 5b indicated that T-P in the MBR was lower than T-P in the
RHMBR as phosphorus was taken up under aerobic conditions in
the MBR by poly-phosphate accumulating organisms (PAOs), and
released under anoxic/anaerobic conditions in the RHMBR. Although
these occurred simultaneously under the same conditions of anoxic/
anaerobic conditions, there was also a small portion of phosphorus
uptake by denitrifying PAOs (Peng et al., 2006). Excess sludge was
discharged from the MBR tank to keep the MLSS concentration at
the designated values with an amount of 120–180 L day
À1
. The aver-
age influent and effluent T-P concentrations, the ratios of COD
Cr
/T-P,
T-N/T-P, PO
3À
4
-P/T-P of influent, and the NO
À
3
-N/T-P ratio of total
nitrate to total phosphorus entering anoxic/anaerobic tank in differ-
ent runs throughout the study are listed in Table 5. The hybrid pilot
plant treated municipal wastewater throughout the study with
average COD:N:P ratios of 50.15:8.11:1.00, 46.43:7.78:1.00,
44.60:7.81:1.00, and 40.99:7.07:1.00 corresponding to Runs 1Q,
2Q, 3Q and 4Q, respectively.
The variation of PO
3À
4
-P concentration in influent and effluent,
and removal of PO
3À
4
-P by the hybrid system are shown in
Fig. 5a. The average PO
3À
4
-P concentration in the influent was
4.33 ± 0.85 mg L
À1
and removal efficiencies of the hybrid system
were 90.05 ± 9.91%, 76.48 ± 6.00%, 68.40 ± 12.95% and
70.52 ± 11.33% with the values corresponding to Runs 1, 2, 3 and
4, respectively. The initial PO
3À
4
-P/T-P ratio of wastewater fed into
the system was in ranged between 0.42 and 1 (average of
0.82 ± 0.17). It was found that T-P the most appropriate circulation
rate should be used in runs 2 or 3.
This system also was successful in reducing the fouling of the
membrane, as the membrane was only chemically cleaned in place
during its year of operation using sodium hypochlorite (NaOCl)
solution 0.5–1.2% (v/v) for 2 h without aeration. This stabilized
the system operation at a constant membrane permeation flux of
22.77 ± 2.19 LMH under ambient temperature conditions. This
reduced overall maintenance needs and increased operational
efficiency of the system.
3.4. Enhanced phosphorus removal by EC
The hybrid pilot plant was operated without adding supple-
mental reactive compounds (carbon sources, chemicals, etc.) to
the solution which resulted in relatively good phosphorus re-
moval, with less than 2 mg L
À1
remaining. However, due to more
stringent regulations and wastewater reuse strategies, it is neces-
sary to achieve phosphorus concentrations after treatment below
0.2 mg L
À1
(guideline). Innovation and advanced technology are
needed to achieve better efficiency in phosphorus removal. Anal-
ysis results of the PO
3À
4
-P/T-P ratio in the effluent flow through
the membrane bioreactor averaged 0.94 ± 0.16, indicating that
phosphorus in the effluent exists mainly as orthophosphate
(PO
3À
4
-P). For these reasons and others the electrocoagulation
(EC) process using cylindrical aluminum electrodes, was carried
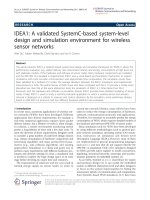
out continuously in the 145th to 316th day in post-treatment.
During that time, T-P concentration in final effluent showed that
excellent T-P removal was achieved in the 145th to 316th inves-
tigation days. The highest effluent concentration detected during
the course of the experiment using the EC process was
0.11 mgTP L
À1
(Fig. 6a). Irrespective of internal recycling ratios,
the T-P removal efficiency of the hybrid system combined with
EC process at post-treatment has now been shown, in practice,
as an excellent method with removal percentages of T-P main-
tained stably and constantly at a high level of 97.23–100% (aver-
age of 99.33 ± 0.56%). The corresponding concentration of T-P in
the final effluent remaining was approximately 0.00–0.11 mg L
À1
(average of 0.03 mg L
À1
). During that period without using EC
process, the efficiency was only in the range of 73.30 ± 8.65%.
140 160 180 200 220 240 260 280 300 320
0.0
0.1
0.2
0.3
0.4
0.5
140 160 180 200 220 240 260 280 300 320
0.0
0.4
0.8
1.2
1.6
3
4
5
6
7
8
9
ΑΑ
ΑΑΑΑ
Α
Α
ΑΑ
ΑΑΑ
Α
ΑΑ
Α
ΑΑΑ
Α
Α
ΑΑ
ΑΑ
Α
Α
ΑΑ
Α
Α
ΑΑΑΑ
Α
Α
Α Α
ΑΑ
ΑΑΑΑ
Α
Α
Α
ΑΑΑΑΑΑΑΑΑ
Current densities (A/m
2
)
Removal efficiency (%)
Α
Current (A)
Sludge generated (Kg/m
3
)
SAC (kg Al/m
3
)
The mole ratio of Al to T-P
SEC(kWh/m
3
)
SEC(kWh/m
3
)
Operation time (days)
0
5
10
15
20
25
30
The mole ratio of Al to T-P
0.0
2.0x1
0
-3
4.0x10
-3
6
.
0x
1
0
-3
8
.0x10
-3
1.
0x
1
0
-2
SAC (kg Al/m
3
)
0.0
0.1
0.2
0.3
0.4
0.5
(8)
(7)
(7)
(6)
(5)
(5)
Sludge generated (Kg/m
3
)
(6)
(8)
Run 3
Run 4
T-P concentration (mg/L)
discharge limit, 0.2mg/l
T-P conc. influent (mg/L) Whithout EC treatment (mg/L)
Whith EC treatment (mg/L) Conductivity (microS/cm)
0
20
40
60
80
100
TP removal efficiency (%)
0
1
2
3
4
5
6
7
8
9
10
Α
Current (A)
Current (A) or Current densities (A/m
2
0
80
160
240
320
400
480
560
(b)
(a)
(2)
(2)
(2)
(4)
(4)
(3)
(3)
(1)
(2)
(2)
(1)
(1)
Conductivity (µS/cm)
Run 3
Run 4
Fig. 6. Effect of the EC process on phosphorous removal, and variation of specific energy consumption (SEC), specific aluminum consumption (SAC), mole ratio of Al to T-P and
sludge generated during operation of EC process.
D.D. Nguyen et al. /Bioresource Technology 153 (2014) 116–125
123
Author's personal copy
Fig. 6a showed that the effluent quality could stably and signifi-
cantly be maintained for phosphorus removal when the EC pro-
cess was used as a combined process, despite obvious
fluctuations in the concentration of influent T-P.
During the course of operating with the EC process in continu-
ous-flow, electrical energy consumption cost, amount of aluminum
used, and sludge generated per cubic meter of wastewater were
averaged. The results achieved were 0.2733 ± 0.0104 kWh/m
3
,
9.1725 ± 0.3489 g m
À3
, and 0.0437 ± 0.0106 kg m
À3
, respectively,
and the corresponding mole ratio of Al to T-P was
8.4416 ± 2.2729 (Fig. 6b). Knowing the amount of aluminum elec-
trode used per cubic meter of wastewater treated would enable
operators to have a predictable plan for replacement of used
electrodes.
The activity of the anode can decrease over time due to the exis-
tence of ions such as Ca
2+
,Mg
2+
,NH
þ
4
, HCO
À
3
,SO
2À
4
, etc., in wastewa-
ter. This is caused by the precipitation of ions or the formation of
insoluble hydroxides, or sludge layers on the surface of the elec-
trodes. These layers insulate the surface of the electrodes, conse-
quently reducing amperage and preventing the needed anode
electrode dissolution in the electrolytic solution (Bektasß et al.,
2004; Chen, 2004; Martin and Nerenberg, 2012; Nguyen et al.,
2013). The EC electrodes used in this study were designed and
operated to avoid these above concerns. To find and establish the
optimum operating parameters for effective EC processing in this
experiment, a series of lab-scale experiments were done using both
synthetic wastewater and real municipal wastewater. In this way,
the ideal operating conditions for effective EC processing were
determined in advance (Nguyen et al., 2013). By using this prede-
termined optimum condition for T-P removal with the advanced
aluminum electrodes in continuous mode, a hydraulic retention
time of 2 min, and application of a constant electric potential of
10 V, some of the highest removal rates ever achieved were re-
corded. Other parameters measured during the course of the
experiment with EC are shown in Fig. 6, and Table 6. During the
EC experiment, the temperature and pH value were not altered
much, and remained in the range of 13.2–25.6 °C and 7.10–7.92,
respectively.
In spite of the fact that a hybrid system with RHMBR and a
submerged MBR performed well in the biological treatment of
wastewater, some cases require stringent quality control of T-P
concentration after treatment. These initial results show that this
method of combined EC processing as post-treatment promises to
be essential in meeting those requirements and extant stringent
regulations. Consequently, further investigation is critically and
urgently needed for the broad implementation of this pragmatic
and effective methodological tool in the struggle to contain the
negative anthropomorphic impacts of phosphorus and related
wastewater pollution on surface and groundwater resources
worldwide.
4. Conclusions
An integrated hybrid RHMBR and MBR system together with an
advanced EC process as post treatment performed extremely well
in removing COD, NH
þ
4
-N, T-N and T-P. The internal recycling ratio
significantly affected on the nitrogen removal efficiency. Due to the
completed nitrification, T-N in effluent was mainly in the form of
NO
À
3
-N and its removal rate was better at high recycling ratios.
The EC process as post treatment proved highly efficient in produc-
ing high and stable levels of T-P removal.
References
Ahn, Y.T., Kang, S.T., Chae, S.R., Lim, J.L., Lee, S.H., Shin, H.S., 2005. Effect of
internal recycle rate on the high-strength nitrogen wastewater
treatment in the combined UBF/MBR system. Water Sci. Technol. 51,
241–247
.
AWWA, WEF, APHA, 1998. Standard Methods for the Examination of Water and
Wastewater, 20th ed. American Public Health Association, Washington DC, USA.
Baeza, J.A., Gabriel, D., Lafuente, J., 2004. Effect of internal recycle on the nitrogen
removal efficiency of an anaerobic/anoxic/oxic (A2/O) wastewater treatment
plant (WWTP). Process Biochem. 39, 1615–1624
.
Bektasß, N., Akbulut, H., Inan, H., Dimoglo, A., 2004. Removal of phosphate
from aqueous solutions by electro-coagulation. J. Hazard. Mater. 106,
101–105
.
Chen, G., 2004. Electrochemical technologies in wastewater treatment. Sep. Purif.
Technol. 38, 11–41
.
Chen, Y., Peng, C., Wang, J., Ye, L., Zhang, L., Peng, Y., 2011. Effect of nitrate recycling
ratio on simultaneous biological nutrient removal in a novel anaerobic/anoxic/
oxic (A2/O)-biological aerated filter (BAF) system. Bioresour. Technol. 102,
5722–5727
.
Cresson, R., Carrère, H., Delgenès, J.P., Bernet, N., 2006. Biofilm formation during the
start-up period of an anaerobic biofilm reactor-impact of nutrient
complementation. Biochem. Eng. J. 30, 55–62
.
Defrance, L., Jaffrin, M.Y., Gupta, B., Paullier, P., Geaugey, V., 2000. Contribution of
various constituents of activated sludge to membrane bioreactor fouling.
Bioresour. Technol. 73, 105–112
.
Di Trapani, D., Christensso, M., Odegaard, H., 2011. Hybrid activated sludge/biofilm
process for the treatment of municipal wastewater in a cold climate region: a
case study. Water Sci. Technol. 63, 1121–1129
.
Fan, J., Tao, T., Zhang, J., You, G L., 2009. Performance evaluation of a modified
anaerobic/anoxic/oxic (A2/O) process treating low strength wastewater.
Desalination 249, 822–827
.
Guo, W., Ngo, H H., Palmer, C.G., Xing, W., Hu, A.Y J., Listowski, A., 2009. Roles of
sponge sizes and membrane types in a single stage sponge-submerged
membrane bioreactor for improving nutrient removal from wastewater for
reuse. Desalination 249, 672–676
.
Jou, C J.G., Huang, G C., 2003. A pilot study for oil refinery wastewater treatment
using a fixed-film bioreactor. Adv. Environ. Res. 7, 463–469
.
Judd Simon, Claire, J., 2010. The MBR Book: Principles and Applications of
Membrane Bioreactors for Water and Wastewater Treatment. Elsevier,
Oxford, UK
.
Khoshfetrat, A.B., Nikakhtari, H., Sadeghifar, M., Khatibi, M.S., 2011. Influence of
organic loading and aeration rates on performance of a lab-scale upflow aerated
submerged fixed-film bioreactor. Process Saf. Environ. Prot. 89,
193–197
.
Kim, H S., Gellner, J.W., Boltz, J.P., Freudenberg, R.G., Gunsch, C.K., Schuler, A.J.,
2010. Effects of integrated fixed film activated sludge media on activated sludge
settling in biological nutrient removal systems. Water Res. 44, 1553–1561
.
Le-Clech, P., Chen, V., Fane, T.A.G., 2006. Fouling in membrane bioreactors used in
wastewater treatment. J. Membr. Sci. 284, 17–53
.
Lee, W.S., Hong, S.H., Chung, J.S., Ryu, K., Yoo, I K., 2010. Comparison of the
operational characteristics between a nitrifying membrane bioreactor and a
pre-denitrification membrane bioreactor process. J. Ind. Eng. Chem. 16, 546–
550
.
Levstek, M., Plazl, I., 2009. Influence of carrier type on nitrification in the moving-
bed biofilm process. Water Sci. Technol. 59, 875–882
.
Markus, John.A., Santroch, James.A., Tumuluri, Sailaja., Xi, Yun., Arifin, Anderson.,
Portman, D., 2011. Technical and Economic Evaluation of Nitrogen and
Phosphorus Removal at Municipal Wastewater Treatment Facilities.
Engineering & Architecture Services. Tetra Tech Inc.
.
Martin, K.J., Nerenberg, R., 2012. The membrane biofilm reactor (MBfR) for water
and wastewater treatment: principles, applications, and recent developments.
Bioresour. Technol. 122, 83–94
.
Monclús, H., Sipma, J., Ferrero, G., Rodriguez-Roda, I., Comas, J., 2010. Biological
nutrient removal in an MBR treating municipal wastewater with special
focus on biological phosphorus removal. Bioresour. Technol. 101,
3984–3991
.
Nacheva, P.M., Chavez, G.M., 2010. Wastewater treatment using a novel bioreactor
with submerged packing bed of polyethylene tape. Water Sci. Technol. 61, 481–
489
.
Nguyen, D.D., Kim, S.D., Yoon, Y.S., 2013. Enhanced phosphorus and COD removals
for retrofit of existing sewage treatment by electro coagulation process with
cylindrical aluminum electrodes. Desalin. Water Treat />10.1080/19443994.2013.794707.
Nguyen, T.T., Ngo, H.H., Guo, W., Johnston, A., Listowski, A., 2010. Effects of sponge
size and type on the performance of an up-flow sponge bioreactor in
primary treated sewage effluent treatment. Bioresour. Technol. 101,
1416–1420
.
Oleszkiewicz, J.A., Barnard, J.L., 2006. Nutrient removal technology in North
America and the European Union: a review. Water Qual. Res. J. Canada 41,
449–462
.
Orantes, J.C., Gonzalez-Martinez, S., 2003. A new low-cost biofilm carrier for the
treatment of municipal wastewater in a moving bed reactor. Water Sci. Technol.
48, 243–250
.
Ozgur Yagci, N., Tasli, R., Artan, N., Orhon, D., 2003. The effect of nitrate and different
substrates on enhanced biological phosphorus removal in sequencing batch
reactors. J. Environ. Sci. Health A 38 (8), 1489–1497
.
Peng, Y Z., Wang, X L., Li, B K., 2006. Anoxic biological phosphorus uptake and the
effect of excessive aeration on biological phosphorus removal in the A2O
process. Desalination 189, 155–164
.
124 D.D. Nguyen et al. / Bioresource Technology 153 (2014) 116–125
Author's personal copy
Tan, T.W., Ng, H.Y., 2008. Influence of mixed liquor recycle ratio and dissolved
oxygen on performance of pre-denitrification submerged membrane
bioreactors. Water Res. 42, 1122–1132
.
Tandukar, M., Ohashi, A., Harada, H., 2007. Performance comparison of a pilot-scale
UASB and DHS system and activated sludge process for the treatment of
municipal wastewater. Water Res. 41, 2697–2705
.
Wahab, M.A., Hassine, R.B., Jellali, S., 2011. Removal of phosphorus from aqueous
solution by Posidonia oceanica fibers using continuous stirring tank reactor. J.
Hazard. Mater. 189, 577–585
.
Yang, S., Yang, F., Fu, Z., Lei, R., 2009. Comparison between a moving bed membrane
bioreactor and a conventional membrane bioreactor on organic carbon and
nitrogen removal. Bioresour. Technol. 100, 2369–2374
.
Yang, S., Yang, F., Fu, Z., Wang, T., Lei, R., 2010. Simultaneous nitrogen and
phosphorus removal by a novel sequencing batch moving bed membrane
bioreactor for wastewater treatment. J. Hazard. Mater. 175, 551–557
.
D.D. Nguyen et al. / Bioresource Technology 153 (2014) 116–125
125