Supported nanosized gold catalysi the influence of support morphology and reaction mechanism 3
Bạn đang xem bản rút gọn của tài liệu. Xem và tải ngay bản đầy đủ của tài liệu tại đây (2.74 MB, 47 trang )
50
Chapter 3
Oxidation of Carbon Monoxide over Nanogold Catalysts
supported on various iron Oxides Effect of Preparation Conditions
on Catalytic Performances
In this chapter, four kinds of gold/iron oxide catalysts, including AuCH, AuCM , AuCP,
AuDP were prepared and used for CO oxidation reactions in the absence/presence of H
2
respectively. It is found that the catalytic performance of the Au/iron oxide catalysts in
the CO oxidations was influenced by a number of factors such as the calcinations
temperature and the pre-reduction treatment, etc. For the AuDP and AuCP samples, CO
conversion decreases with increase of the calcination temperature, while for the AuCM
and AuCH catalysts, the influence of the calcination was less evident. Also, for all the
tested catalysts, a higher reduction temperature resulted in a lower CO conversion. The
effect of the reduction treatment on catalysts activity even exceeded that of the
calcination temperature. On all the catalysts, the selectivity towards CO oxidation in H
2
-
rich environment (PROX) decreased appreciably with increase of the reaction
temperature; however, the dependence of this selectivity on the pretreatment temperature
was negligible. On the Au/iron oxide system the PROX reaction occurs through a Mars-
van Krevelen type reaction mechanism, which involves lattice oxygen of the iron oxide
and CO and H
2
adsorbed on gold particles. The XRD, TPR, XPS and SIMS studies show
the presence of OH and COO groups on the AuCH samples. The performance of Au/iron
oxide catalysts towards PROX reaction was found to be strongly affected by catalyst
51
preparation and post-treatment. The colloid-based method can better control Au particle
size and distribution.
3.1 Introduction
The high activity of nanoparticulate gold (Au) catalysts supported on metal oxide (iron
oxide and titanium oxide in particular) at room temperature or even lower temperature
may lead to a revolution in our traditional understanding of heterogeneous catalysis,
because it is very rare for synthesized catalysts to work at ambient environment, which is
usually the case for enzymes. Despite that various reaction routes and mechanisms have
been proposed, it has been generally agreed that the size of the Au particles and the
interaction between gold nanoparticles and supports are very important factors that
contribute to the extraordinary catalytic performance of supported nano-gold catalysts.
Au particle exhibits good catalytic performances under mild conditions only when the
gold particle size is smaller than 5 nm.
1-6
It is also reported that the optimum Au particle
size for catalyzing CO oxidation reaction should be 2-4 nm.
7-8
Oxide supports may also
modify the Au electronic structure via metal-support interaction. Moreover they may
participate in activation of oxygen via adsorption at oxide vacancies. Therefore the
interaction between Au nanoparticles and metal oxide support is very complicated, and
has attracted a lot of attention. Different metal oxide supports seem to interact with Au
nanoparticles differently, and the mechanism of one system might not be the same as the
other system. Even for the same oxide support, preparation method may affect the Au
particle sizes, the oxide support morphology and structure, and the presence of impurities
in the system, all of which would possibly change the catalytic activity.
52
In this chapter iron oxide is selected as the support of the Au catalysts, and the effect of
preparation methods on the oxide crystalline structure and oxidation state is studied
carefully. Iron oxides are often classified as easily reducible oxides. Quite clear
correlation between the reducibility of the support and the activity was found. Au
supported on iron oxides is highly active in CO oxidation, better than ZrO
2
(less easily
reducible oxide) and Al
2
O
3
(non-reducible oxide). It is reported that the catalytic
performance of the Au/iron oxide system in the CO oxidation is related both to the gold
state and the iron oxide phase.
9-12
Among three different phases of iron oxides, i.e.
Fe
2
O
3
, γ-Fe
2
O
3
and Fe
3
O
4,
Haruta has shown that co-precipitated -Fe
2
O
3
is more active
than impregnated -Fe
2
O
3
and impregnated γ-Fe
2
O
3
due to the smaller size of gold
particles.
13-15
Šmit et al. indicated that the surface –OH group plays an important role in
the CO activity over gold/ iron oxide system.
16
CO may react with –OH groups forming
very reactive adsorbed formates, HCOO(
ad
), which can be oxidized to carbon dioxide and
water by lattice oxygen. Thus, the catalyst preparation and post-treatment conditions
may affect the catalytic activity of the gold/ iron oxide markedly due to the change in the
iron oxide crystalline structure, the amount of surface OH group and oxide ion vacancies.
Supported Au catalysts were generally prepared by standard methods, namely
coprecipitation (CP), deposition precipitation (DP), and colloid-based method (CB).
17
Coprecipitation method involves simultaneous precipitation of HAuCl
4
and metal nitrate
by Na
2
CO
3
(or NH
4
OH). Deposition-precipitation technique requires aging of an
aqueous solution of HAuCl
4
at temperature 50-90
o
C and a fixed pH value in the range of
6-10, which is selected based on the isoelectric point of metal oxide support, to enable
selective deposition of Au(OH)
3
only on the surface of the metal oxide, without
53
precipitation in the liquid phase. The third method, colloid-based method, is to
impregnate oxide support with mono dispersed Au colloids stabilized by organic ligands
or capping agents. The Au/oxides prepared by the above methods usually undergo
subsequent drying and calcinations in air to obtain gold particles dispersed on oxides.
The catalyst preparation as well as post-treatment conditions, e.g. precipitation
temperature/pH value/time, aging temperature/time, calcination temperature/time etc, are
important factors which may change Au particle size and the contact structure between
the Au particles and the support. Providing that gold particles are small enough in the
Au/iron-oxide prepared by various methods to be able to activate CO and O
2
, the CO
oxidation activity is found to remarkably depend on the iron oxide structures. The CO
oxidation activity of different iron oxide species was in the order: ferrihydrite > hematite >
magnetite.
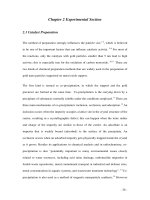
3.2 Experimental
3.2.1 Materials and catalysts preparation
Au/iron oxide catalysts were prepared by co-precipitation (CP) or deposition-
precipitation (DP), using HAuCl
4
(sigma-aldrich) and Fe(NO
3
)
3
·9H
2
O (sigma-aldrich) as
precursors. In the case of the co-precipitation (CP) method, an aqueous mixture of the
HAuCl
4
and Fe(NO
3
)
3
precursors was poured into an aqueous solution of Na
2
CO
3
(0.25M)
which was maintained at 70
o
C under vigorous stirring (500 rpm). The precipitate was
washed, dried, and calcined in air at 110
o
C for 12 hrs. This co-precipitation sample is
coded AuCP. In the deposition-precipitation method, Au nanoparticles were deposited
on iron oxide support by keeping the pH value of the aqueous solution of HAuCl
4
at pH =
54
8 using 0.1M NaOH. The Fe
2
O
3
support was generated, prior to the DP process, from 1.0
M Fe(NO
3
)
3
solution. Excessive amount of 1.0M NaOH solution was added to the
Fe(NO
3
)
3
solution drop-wisely till all the iron ions in the solution were deposited. Then
the mixed solution was thoroughly washed using DI water by centrifugation. The slurry
after centrifuge was dried in 110
o
C oven for 48 hours. The above prepared sample was
then calcined at 500
o
C for 5 hour. The as-prepared iron oxide was mainly presented in -
Fe
2
O
3
phase, with small amount of γ-Fe
2
O
3
phase detectable by XRD. This self-prepared
iron oxide sample was used as the support for the AuDP catalyst (The deposition-
precipitation sample is coded AuDP). Two other samples, AuCH and AuCM were
prepared using colloid-based method with assistance of the ultrasound irradiation
17
. The
support used for AuCH was commercial Fe
2
O
3
(hematite, Sigma-Aldrich), while that for
AuCM was commercial Fe
3
O
4
(Magnetite, Sigma-Aldrech). In colloid-based method L-
lysine was added as a capping agent, which has better control on gold particle size
compared to conventional DP method used in literature. HAuCl
4
(1mM) was reduced by
NaBH
4
(0.1M). During the reduction period, colloid-based method was applied. The
nano-Au particles were deposited on iron oxide supports. The slurry was dried at 70ºC
after centrifuge four times using DI water. As chloride ions is a poison to the catalytic
reaction and may affect the activity of catalyst, the addition of capping agent and
reduction agent and the followed washing procedure are able to remove almost of
chlorine in the solution.
3.2.2 Evaluation of catalysts
55
Catalytic runs were carried out at atmospheric pressure in a continuous-flow fixed-bed
quartz micro-reactor (I.D. 4 mm) packed with samples and quartz wool. Before testing,
the catalysts were pre-treated in situ with a flow of air (100 ml min
-1
) for 1 h at 200
o
C
and 300
o
C respectively. For CO oxidation reactions, the feed gas was a mixture of
90%He + 5%CO + 5%O
2
, which was introduced into the reactor at a gas hourly space
velocity (GHSV) of 60,000 cm
3
g
-1
h
-1
. For preferential oxidation of CO in the presence
of hydrogen, the feed gas was a 70%H
2
+ 1%CO + 2%O
2
mixture balanced with helium,
and was introduced into the reactor at a GHSV of 60,000 cm
3
g
-1
h
-1
. For both reactions,
the reaction products were analyzed on-line using Shimadzu GC-2010 gas
chromatography equipped with a thermal conductivity detector (TCD). The catalysts
were evaluated for activity (in terms of CO
2
conversion) and CO productivity in a
temperature range of 25-200
o
C. Measurement readings were taken after the system had
been stabilized for at least 15mins for every designated reaction temperature. The
Conversion and Selectivity are calculated in terms of concentration:
CO conversion (%) =
Inlet CO concentration – Outlet CO concentration
x 100%
Inlet CO concentration
CO
2
conversion (%) =
Inlet CO concentration – Outlet CO concentration
x 100%
2 x (Inlet O
2
concentration – Outlet O
2
concentration)
For kinetics study, the catalyst was diluted with SiC powder. Absolute mass-specific
reaction rates were calculated for the average concentration of each component ċ
i
, at the
in- and outlet of the reactor; m
Au
, mass of Au in the reactor bed; V, total molar flow rate;
X
CO
, conversion of CO on the basis of CO
2
formation; ċ
CO
, concentration of CO in gas
56
mixture, equal to p
i
/p
0
; p
i
, partial pressure of reactants; p
0,
total pressure in the system
(3.1). The mean particle size (D) gets from (3.2).
r
CO
=
ċ
CO,in
X
CO
V
gas
[moles·s
-1
g
Au
-1
] (3.1)
m
Au
D=∑ n
i
d
i
3
/∑ n
i
d
i
2
(3.2)
3.2.3 Characterization of catalysts
Powder X-ray diffraction (XRD) patterns were recorded at room temperature on a Bruker
D8 Advance Diffractometer using a Cu Kα radiation source. Diffraction angles were
measured in steps of 0.015
o
at 1 s/step in the range of 10-80
o
(2θ).
Transition electron microscope (TEM) measurements were performed on a Tecnai TF 20
S-twin instrument with a Lorentz lens. The samples were ultrasonically dispersed in
ethanol solvent and then were dried over a carbon grid for measurements. The average
size of Au particles and its distributions were estimated by counting about 300 Au
particles. The Au and Fe contents of prepared catalysts were determined by X-ray
fluorescence multi-elemental analyses (XRF) on a Bruker AXS S4 Explorer.
Temperature programmed reduction (TPR) studies were performed in a continuous-flow
fixed-bed quartz micro-reactor (I.D. 4 mm) with 50 mg of samples. The catalyst was first
heated in a flow air at 200, 300 or 400
o
C for 60 min. After cooling to room temperature,
the feed gas was switched to 5%H
2
/Ar. After the baseline had been stabilized, the
temperature was increased to 600
o
C at a heating rate of 10
o
C/minute. The amount of H
2
57
consumed was measured as a function of temperature by means of a thermal conductivity
detector (TCD).
Thermogravimetric Analysis was conducted using TA Instruments SDT 2960
Simultaneous (DTA-TGA), under nitrogen (flow rate= 70ml/min) at a heating rate of
20
o
C/min. X-ray photoelectron spectroscopy (XPS) was performed on a VG ESCALAB
XPS, ESCA MK II using Mg Kα (1254.6 eV) light source under UHV better than 3×10
-9
torr. The in-situ XPS experiments were performed in a UHV chamber at the SINS
beamline of the Singapore synchrotron light source (SSLS) at National University of
Singapore.
18
XPS spectra were measured using a hemispherical electron energy analyzer
(EA 125, Omicron NanoTechnology GmbH). The XPS experiments were done at normal
emission, and the photon energy resolution for the experiments was about 0.5 eV. XPS
measurements were done at constant pass energy mode with overall energy resolution.
Table 3.1 summarizes the experimental procedure for CO oxidation in-situ XPS study.
The same scan time on each sample was maintained.
Table 3.1 Experimental procedure for CO oxidation in-situ XPS study
CO oxidation
As-prepared catalyst in pretreatment chamber,
degas for 30 min then transfer to analysis chamber
Wide Scan
Scan for C1s, O1s, Fe 2p and Au4f
Transfer the samples back to pre-treatment chamber
58
and 2%CO + 2%O
2
in He doses was injected into pretreatment chamber
with the chamber pressure at 1*10
-4
Torr for 10min
CO + O
2
does was pumped out and sample was outgas for 1 hour then
transferred back to analysis chamber
Scan for C1s, O1s, Fe 2p and Au4f
Time-of-flight (TOF) secondary ion mass spectrometry (SIMS) analysis was performed
on VG SIMSLAB incorporating a duoplasmatron ion gun and a VG M12-12 quadrupole
mass spectrometer, in the mass range (m/z) from 1 to 800. The VGX 900 software was
used to control the experiments and analyze the data. During the analysis samples were
neutralized by an electron flood gun of 500 eV energy with a maximum current of 1 A.
A positive bias potential of around 10 V was applied to obtain a maximum secondary ion
count. Ar
+
ion was used for analysis with 10keV energy and 2 pA beam current to ensure
that the operation is in static SIMS mode. The scan size was 300m and scan time 800s.
3.3 Results and Discussions
3.3.1 Crystalline structure of various Au on iron oxide samples: XRD
Characterization
The effect of catalyst preparation and post-treatment on the crystalline structure of
Au/iron oxide samples has been studied by XRD. Figure 3.1 compares the XRD patterns
of the four kinds of the Au/iron-oxide (AuCH, AuCM, AuCP and AuDP) samples after
calcination at 300
◦
C. The AuDP, AuCH and AuCM samples show well crystallized iron
59
oxide structures after calcined at 300
o
C, while the co-precipitate AuCP sample remains
poorly crystallized. It is noticed that AuCP is the only sample that does not exhibit the Au
peak at c.a. 2=38
o
, and its α-Fe
2
O
3
peaks are weak in intensity even after a calcination at
300
o
C. Pattern a in Figure 3.1 shows five distinct peaks which are identified as magnetite,
Fe
3
O
4,
for AuCM catalyst. The AuCH (line b) and the AuDP (line d) samples contain
mainly -Fe
2
O
3
(hematite) and iron oxide hydrate (γ-FeO(OH), Lepidocrocite), The Au
signal is strong for AuCH and rather weak for AuDP. To investigate the effect of
calcinations to the crystalline structure of our samples, XRD patterns before and after
calcinations are presented in Figure 3.2 and Figure 3.3 for AuCP and AuDP samples
respectively. As can be seen from Figure 3.2, the “as-prepared” co-precipitate AuCP
catalyst is poorly crystallized, while after calcinations at 400
o
C for 1 hour, four peaks
with quite low signal to noise ratio are visible and identified as the presence of α-Fe
2
O
3
(hemitate). A peak that is attributed to metal gold at ca. 38
o
was observed at the AuCP
sample after 400
o
C calcinations. Note that the AuCP sample did not exhibit Au peaks
even after calcined one hour at 300
o
C, the Au reflection was identified only after 400
o
C
calcination. The FeO(OH) peak, Lepidocrocite, at ~64
o
is detectable after the calcinations,
though it is not very strong.
60
30 40 50 60 70
0
20
40
60
80
Lepidocrocite
Intensity
2
a
b
c
d
a: AuCM
b: AuCH
c: AuCP
d: AuDP
hematite
magnetite
gold
Figure 3.1 X-ray powder diffraction patterns of four kinds of gold supported iron oxide samples after
calcinations at 300
o
C
61
30 35 40 45 50 55 60 65 70
0
5
10
15
20
25
30
35
Intensity(a.u)
2
(a) : as-prepared
(b) : calcined at 400
o
C
Hem atite
goldgold
(b)
(a)
(b)
Figure 3.2 XRD patterns of AuCP sample (a) “as-prepared” and (b) after calcine at 400°C •
Figure 3.3 displays X-ray diffraction patterns of AuDP samples (as-prepared and after
400
o
C calcinations for 1 hour). The “as prepared” AuDP with three broad peaks reveals
the presence of α-Fe
2
O
3.
After calcination at 400°C for 1 hour, more distinct peaks are
observed in Figure 3.3 (b). There are also peaks suggesting the presence of γ-Fe
2
O
3
(magnetite) and FeO(OH), Lepidocrocite
.
Au peak becomes observable though it is very
weak.
62
20 40 60 80
Intensity (a.u.)
2
(b)
(a)
hem atite
Lepidocrocite
(a): as-prepared
(b): calcined at 400
o
C
m agnetite
gold
Figure 3.3 XRD patterns of AuDP catalyst. (a) “as-prepared” and (b) after calcine at 400°C
Figure 3.4 compares the patterns of the AuCH catalyst after calcination at three different
temperatures (200
o
C, 300
o
C and 400
o
C). In all three AuCH samples calinced at different
temperatures typical reflection of α-Fe
2
O
3
hematite phase can be observed. Calcination
at 300
o
C and 400
o
C increases its crystallinity. The 300
o
C and 400
o
C calcinations also
result in the appearance of γ-Fe
2
O
3
magnetite and FeO(OH) lepidocrocite phase. It is
noteworthy that all three samples of AuCH calcined at different temperature show peaks
attributed to metallic gold, which remain almost the same band width while the peak
intensity of iron oxide support increases as the pretreatment temperature increases. This
indicates that the size of the gold nano particles did not change with the increase of
calcinations temperature when the calcinations temperature are equal or lower than 400
o
C, which is also in good agreement with the results of transmission electron microscopy.
63
Similar results were also reported in a paper from our group,
19
using lysine as capping
agent. The AuCP and AuDP samples do not show this unique character.
3030 35 4040 45 5050 55 6060 65
a: calcined at 200
o
C
b: calcined at 300
o
C
c: calcined at 400
o
C
Au
Intensity (a.u.)
2
a
b
c
hematite
magnetite
Lepidocrocite
Figure 3.4 XRD patterns of the AuCH sample after calcined at different pretreatment
temperature
3.3.2 Size of Au particles on various iron oxide supports: TEM characterization
Figure 3.5 shows the TEM image of the four Au/iron oxide samples calcined in air for 1
hour at 300
o
C. The size distribution of Au nano particles for these four Au/iron samples
is summarized in Figure 3.6 in the form of bar graph. It is very clear that co-
64
precipitation method did not produce very small sized Au particles, and the particle size
distribution is also poorer than other samples, particularly worse than AuCM and AuCH.
Figure 3.5 TEM micrograph for gold supported samples on four kinds of iron oxide supports
(A) TEM for the AuCM sample pre-treated in air for 1 hour at 300
o
C
(B) TEM for the AuCH sample pre-treated in air for 1 hour at 300
o
C
(C) TEM for the AuCP sample pre-treated in air for 1 hour at 300
o
C
(D) TEM for the AuDP sample pre-treated in air for 1 hour at 300
o
C
A
C
A
C
B
D
65
2 3 4 5 6
0
10
20
30
Frequency (%)
Particle size (nm)
2 3 4 5 6
0
7
14
21
28
Frequency (%)
Particle size (nm)
2 3 4 5 6 7 8
0
5
10
15
20
25
Frequency (%)
Particle size (nm)
2 3 4 5
0
5
10
15
20
25
30
Frequency (%)
Particle size (nm)
Figure 3.6 Particle size distribution of four kinds of Au/iron oxide samples after calcinations at 300
o
C
(A): AuCM (D=3.4nm); (B): AuCH (D=3.6nm); (C): AuCP(D=5.3nm); (D): AuDP (D=3.7nm)
3.3.3 Specific surface area of Au/iron oxides: XRF and BET Characterizations
Detailed information obtained from XRF and BET results of these for gold/ iron oxide
samples are listed in Table 3.1 The gold wt% content of these Au/iron samples are all
around 3.0-3.9% according to the x-ray fluorescence (XRF) results. It is noted that the
surface area of the four as-prepared samples is very different, decreasing in the order:
AuCP > AuDP> AuCH > AuCM. Nevertheless after calcination in air at 300
o
C for 1
B
A
C
D
66
hour the specific surface area of the three samples AuCP, AuDP and AuCH are not
distinctly different, while BET of AuCM is ~4 times lower.
Table 3.2 Au wt% in three kinds of gold iron oxide samples from XRF, BET results of four kinds of
gold supported iron oxide samples
AuCM
AuCP
AuCH
AuDP
XRF
(Au wt%)
As-prepared
3.1%
3.9%
3.0%
3.4%
BET
(m
2
/g)
As-prepared
10.3
267.5
33.4
136.9
Pre-treated
at 473K
7.4
36.5
27.4
31.2
Pre-treated
at 573K
6.8
29.8
25.1
26.7
.
3.3.4 Reducibility of iron oxide supports: H
2
-TPR Characterization
The effect of catalyst heating treatment on the nature of Au/iron oxide samples was
studied by H
2
-TPR. As a reference, Figure 3.7 presents the H
2
-TPR results of pure
commercial iron oxides, FeO (curve a), Fe
2
O
3
(curve b) and Fe
3
O
4
(curve c). The peak
at 508
o
C for FeO is attributed to the reduction of FeO to Fe
0
.
20
The peak at 387 and 620
o
C can be assigned to the reduction of Fe
2
O
3
Fe
3
O
4
and Fe
3
O
4
FeOFe
respectively.
21,22
67
200 400 600
0
3000
6000
9000
H
2
consumpsion
Temp(
o
C)
a: FeO
b: Fe
2
O
3
c: Fe
3
O
4
a
b
c
387
508
620
Figure 3.7 TPR profiles of commercial FeO, Fe
2
O
3
and Fe
3
O
4
samples
Figure 3.8 displays TPR profiles of AuCP (left) and AuCH (right) samples calcined at
different temperatures. On the AuCP sample calcined at 200
o
C (Figure 3.8 line a) two
main reduction peaks are at about 200
◦
C and 650
◦
C. From the XRD study of the AuCP
sample (see Figure 3.2 line (a) ), it is known that the as-prepared sample is mainly
amorphous in structure. Since the sample was prepared from the co-precipitation of Au
-
100 200 300 400 500 600 700
H
2
consumption
Temp(
o
C)
a
b
c
a: AuCP calcine at 200
o
C
b: AuCP calcine at 300
o
C
c: AuCP calcine at 400
o
C
100 200 300 400 500 600 700
H
2
consumpsion
Temp(
o
C)
d
e
f
d: AuCH calcined at 200
o
C
e: AuCH calcined at 300
o
C
f: AuCH calcined at 400
o
C
68
Figure 3.8 TPR profiles of the AuCP (left) and AuCH (right) samples at three different calcinations
temperatures 200, 300 and 400
o
C.
and Fe-containing precursors in aqueous solution, the hypothesis could be made that the
amorphous iron species were present in FeO(OH). Therefore the TPR peaks at 220
o
C can
be attributed to the reduction of OH to H
2
O (this peak should be mainly due to the
transition from Fe
2
O
3
to Fe
3
O
4
. Au cationic ions are usually associated with OH groups.
23
Probably these TPR peaks in low temperature range are overlapped with that the
reduction peak of Au ion to metallic Au). For the sample calcined at 400
o
C, it should be
simply attributed to the transformation from Fe
2
O
3
to Fe
3
O
4
,
2Fe
3+
O - OH + 2H
2
Fe
3+
O + Fe
2+
+ 3H
2
O
This is consistent with literature
19
in which the TPR peak is located at 150-350
o
C. The
peak at 650
o
C in Figure 3.8 (left) is obviously due to the reduction of Fe
3
O
4
FeOFe
as that happens in pure Fe
2
O
3
sample. For the AuCP which was calcined at 300-400
o
C,
the 200
o
C peak shifts to 250-300
o
C. This is easy to understand by referring to the
TG/DTA profiles in Figure 3.9, in which three TG peaks correspond to the dehydration
of various OH groups at 173, 231, 285 and 330
o
C respectively.
69
100 200 300 400 500 600 700 800
80
85
90
95
100
100 200 300 400 500 600 700 800
-35
-30
-25
-20
-15
-10
-5
0
5
285
o
C
231
o
C
Heat Flow(mW/mg)
Weight loss(%)
Temperature(
o
C)
173
o
C
Figure 3.9 Thermogravimetry (TG) and differential thermal analysis (DTA) of the AuCP sample
The H
2
-TPR profiles of the AuCH catalysts calcined at different temperatures are
presented in Figure 3.8 (right). There is extra peak at ~150
o
C for AuCH calcined at
200
o
C. This may indicate that the AuCH sample contains loosely bonded OH groups
which can be removed by hydrogen reduction at 150
o
C. The strong low-temperature
peak shifts from 200
o
C for AuCP to 250
o
C for AuCH sample. This appears to mean the
stronger bonding of OH groups in AuCH samples. Actually XRD data also indicated the
presence of high concentration of OH groups in the AuCH samples even after 400
o
C,
forming -FeO(OH) Lepidocrocite crystals. The presence of OH groups on the AuCH
catalysts may play important role in CO oxidation on the catalysts.
3.3.5 Catalytic study for CO oxidation over gold supported on various Iron Oxide
catalysts
70
Figure 3.10 Conversion of CO as a function of reaction temperature over four kinds of gold/ iron
oxide samples as prepared (a), calcined in air at 200
o
C for 1hour (b), and calcined in air at 300
o
C
for 1hour (c). Reaction conditions: 5%CO+ 5%O
2
in He, GHSV: 60,000 cm
3
g
-1
h
-1
In Figure 3.10 the conversion of carbon monoxide to CO
2
by O
2
(without H
2
) over four
kinds of gold/ iron oxide samples is displayed as function of reaction temperature. The
AuCH sample shows 100% CO conversion in the entire range of reaction temperatures
from RT to 80
o
C. The AuDP sample is very active at RT, and its activity increased with
increasing temperature before it reaches 100% CO conversion, after that it experiences a
slight decrease in CO conversion with increasing reaction temperature. The AuCP and
AuCM samples are not so active at RT, and gradually increase their CO oxidation
activity with increasing temperature. Calcination can improve the activity of AuDP, but
does not help AuCM. These results show that AuCH is the best catalyst for low
temperature CO oxidation. AuDP is active but less stable.
20 30 40 50 60 70 80 90
20
40
60
80
100
a : AuCP 200
o
C calcine
b : AuDP 200
o
C calcine
c : AuCM 200
o
C calcine
d : AuCH 200
o
C calcine
Temp(
o
C)
20 30 40 50 60 70 80
40
60
80
100
a : AuCP 300
o
C calcine
b : AuDP 300
o
C calcine
c : AuCM 300
o
C calcine
d : AuCH 300
o
C calcine
Temp(
o
C)
20 30 40 50 60 70 80
20
40
60
80
100
a : AuCP as-prepared
b : AuDP as-prepared
c : AuCM as-prepared
d : AuCH as-prepared
CO conversion(%)
Temp(
o
C)
71
The reaction rate r
co
for the CO+O
2
CO
2
at 30
o
C is 3.36, 7. 10, 10.1 and 11.1 (in terms
of 10
-4
mol
co
* g
Au
-1
* S
-1
), respectively, on AuCM, AuCP, AuDP and AuCH catalysts
calcined at 200
o
C for 1 hour. These results are comparable with or better than that
reported in literature, i.e. 4.87 * 10
-4
mol
CO
g
-1
Au
S
-1
for 1 wt % Au/-Fe
2
O
3
provided by
the World Gold Council (WGC).
20
The AuCH sample is the best catalyst, while AuCM is
the worst. The preparation method and conditions for AuCM and AuCH are identical
except that -Fe
2
O
3
is used in the preparation of the AuCH sample, whereas smaller BET
surface area Fe
3
O
4
was used as the support for the AuCM sample. It can be concluded
that the preparation method, and hence the iron oxide support crystalline structure has
great influence on the CO oxidation activity of gold supported iron oxide samples.
3.3.6 Selective oxidation of CO in H
2
over gold catalysts on Iron Oxides
20 30 40 50 60 70 80 90 100 110 120
20
30
40
50
60
70
80
90
100
CO conversion%
Temp(
o
C)
a : AuCP
b : AuDP
c : AuCM
d : AuCH
a
b
c
d
Figure 3.11. CO conversion as a function of reaction temperature over four kinds of as-prepared Au/
iron oxide samples. Reaction conditions: 1%CO+2%O
2
+70%H
2
in He, GHSV: 60,000 cm
3
g
-1
h
-1
.
72
Figure 3.11 exhibits the CO conversion of selective oxidation of carbon monoxide in
hydrogen over the four kinds of the as-prepared gold/iron oxide samples. The trend in
Figure 3.11 is similar to that in Figure 3.10 for the CO oxidation without H
2
. The AuCH
sample exhibits the highest CO oxidation activity in the presence of H
2
in the
temperatures between RT and 100
o
C. The AuDP sample shows increasing activity with
increasing temperature from 25
o
C to 50°C. But the activity of the AuDP sample drops
with increasing temperature from 50
o
C to 100
o
C, being around 90% at 100
o
C. The
AuCM sample is the worst among these four catalysts. The CO conversion of the AuCP
sample increases with increasing temperature before the reaction temperature reached
50
o
C, then, the CO conversion begins to drop with increasing temperature. Figure 3.12
to Figure 3.16 report catalytic activity results of the AuCP , AuDP, AuCH and AuCM
samples calcined at different temperature for one hour, (i.e. 200
o
C , 300
o
C and 400
o
C) in
terms of conversion of CO (full lines) and selectivity of O
2
towards CO oxidation (dotted
lines). It is interesting to note that heating treatment normally reduces the activities of
these catalysts in selective CO oxidation. This may be related to the possible reduction of
cationic gold to metallic gold during the heating pretreatments as reported in literature.
24
73
20 30 40 50 60 70 80 90
20
40
60
80
pre-treat at 200
o
C Conversion
pre-treat at 300
o
C Conversion
pre-treat at 400
o
C Conversion
pre-treat at 200
o
C Selectivity
pre-treat at 200
o
C Selectivity
pre-treat at 200
o
C Selectivity
conversion or selectivity(%)
Temp(
o
C)
AuCP
Figure 3.12 CO conversion and selectivity as a function of reaction temperature over AuCP samples.
Reaction conditions: 1%CO+2%O
2
+70%H
2
in He, GHSV: 60,000 cm
3
g
-1
h
-1
.
20 40 60 80 100 120
40
60
80
100
Conversion or Selectivity %
Temp(
o
C)
pre-treat at 200
o
C Conversion
pre-treat at 300
o
C Conversion
pre-treat at 400
o
C Conversion
pre-treat at 200
o
C Selectivity
pre-treat at 200
o
C Selectivity
pre-treat at 200
o
C Selectivity
AuDP
Figure 3.13 CO conversion and selectivity as a function of reaction temperature over AuDP samples.
Reaction conditions: 1%CO+2%O
2
+70%H
2
in He, GHSV: 60,000 cm
3
g
-1
h
-1
.
74
20 40 60 80 100
20
40
60
80
pre-treat at 200
o
C Conversion
pre-treat at 300
o
C Conversion
pre-treat at 400
o
C Conversion
pre-treat at 200
o
C Selectivity
pre-treat at 200
o
C Selectivity
pre-treat at 200
o
C Selectivity
Conversion or Selectivity %
Temp(
o
C)
AuCM
Figure 3.14 CO conversion and selectivity as a function of reaction temperature over AuCM samples.
Reaction conditions: 1%CO+2%O
2
+70%H
2
in He, GHSV: 60,000 cm
3
g
-1
h
-1
.
20 40 60 80 100
20
40
60
80
100
pre-treat at 200
o
C Conversion
pre-treat at 300
o
C Conversion
pre-treat at 400
o
C Conversion
pre-treat at 200
o
C Selectivity
pre-treat at 200
o
C Selectivity
pre-treat at 200
o
C Selectivity
Conversion or Selectivity %
Temp(
o
C)
AuCH
Figure 3.15 CO conversion and selectivity as a function of reaction temperature over AuCH samples.
Reaction conditions: 1%CO+2%O
2
+70%H
2
in He, GHSV: 60,000 cm
3
g
-1
h
-1
.