Supported nanosized gold catalysi the influence of support morphology and reaction mechanism 5
Bạn đang xem bản rút gọn của tài liệu. Xem và tải ngay bản đầy đủ của tài liệu tại đây (4.87 MB, 42 trang )
139
Chapter 5
Oxidation of Carbon Monoxide over
Copper Oxide Supported Gold Catalysts - Catalytic
Performances and Reaction Mechanism-
In this chapter, CuO with different morphologies and structures were utilized to support
gold nanoparticles. Au/CuO(NP) showed better catalytic activity than the Au/CuO(CB)
and Au/CuO(NF) samples, whereby there is no significant differences in surface area of
these three kinds of supports. More Au
+
species were found on the Au/CuO(NP) sample,
indicating different interactions between the Au nanoparticles and the CuO supports.
Also great differences in catalytic activity for samples pre-treated at different temperature
were observed. Catalysts pre-treated at 300
o
C showed much better catalytic activities for
CO oxidation than catalysts pre-treated at 200
o
C. In preferential oxidation of carbon
monoxide over Au/CuO catalysts testing, Au/CuO (NP) still showed the best activity in
terms of CO conversion, while gold supported samples on three kinds of copper oxide
supports showed similar H
2
selectivity.
5.1 Introduction
Due to their unique catalytic activity in various reactions, metal oxide supported
nanosized gold has become one of the most popular research topics, and has attracted the
attentions of researchers all over the world. Extensive works have been conducted
concerning both application and fundamental academic research. Nevertheless, there are
140
still a lot of controversial and uncertain topics in this area of study. For example, the
reaction mechanism and factors that can affect the reaction remain debatable. It has been
generally agreed that particles size of gold and the nature of the metal oxide supports
have a great influence on catalyst’s activity. Other factors such as preparation method,
support surface area; pre-treatment conditions etc. can also affect their catalytic activity.
Many kinds of metal oxide have been used as supports, and the most widely used
supports are TiO
2
, Fe
2
O
3
, Al
2
O
3
, MgO, CeO
2
and Co
3
O
4
etc. Although gold supported
on reducible metal oxide supports showed promising results, and copper oxide can be
classified into easily reducible oxide support, not much research has been conducted
using copper oxide as support for nano gold catalysis. CuO itself can catalyze CO
oxidation,
1,2
and copper-based catalysts are known to be active in several industrial
chemical processes, such as the methanol synthesis, the water-gas shift reaction and the
catalytic oxidation of hydrocarbons. Many of these catalytic reactions involve
intermediate states showing that carbon monoxide directly interacts with the copper-
based catalyst. A recent study showed 100% CO conversion on Au/CuO at temperatures
between 95 and 125
o
C.
3
G. Hutchings compared nano-Au catalysts prepared by co-
precipitation on CuO, CuO/ZnO and ZnO supports. Au particles on CuO and CuO/ZnO
supports had large particles size and hence lower CO oxidation activity
4
. But in general
the study of CuO- supported Au catalysts for CO oxidations is very limited.
In this chapter three CuO samples with different morphologies and structures, including
bulk (commercial, denoted as CuO (CB)), nanoflake (self-made, denoted as CuO (NF))
and nanoparticles (commercial, denoted as CuO (NP)), were utilized to prepare CuO-
support gold catalysts. The catalytic activities and kinetics of carbon monoxide oxidation
141
were investigated using on-line GC. The mechanism of the low temperature CO
oxidation was carefully investigated using in-situ DRIFT and in-situ XPS.
5.2 Experimental
5.2.1 Materials and catalysts preparation
Commercial bulk CuO purchased from Merck (particle size~150 nm, surface area
7.9m
2
/g) and nanoparticle CuO from Sigma-Aldrich (particle size~80nm surface area
27.1m
2
/g) were used in the experiment without further treatment. CuO nano flakes used
in this work were prepared by precipitation: The precipitation was performed by adding
0.5 M NaOH dropwise to the prepared 0.5M Cu(NO
3
)
2
∙2H
2
O (Merck, >98.5%) solution
till pH 9.5. The resulting mixture was stirred at 80
o
C for 48 h. Then the precipitate
mixture was separated by centrifuge and washed by deionized water for four times. The
obtained powder was dried at room temperature for 24 h and calcined at 400
o
C for 6 h in
static air. The surface area (BET) of the as-prepared CuO nanoflakes is 17.8 m
2
/g.
These three kinds of copper oxide samples were used as support for depositing gold nano
particles. Colloid-based (CB) method as described in Chapter 3 was selected as the best
method for the preparation of Au/CuO catalysts. HAuCl
4
(1mM) was used as a precursor,
NaBH
4
(0.1M) as a reducing agent and lysine as a capping agent. During the reduction
period, sonication was applied. The slurry was dried at 70ºC after centrifuge four times
using DI water.
5-9
5.2.2 Evaluation of catalysts
Catalytic evaluations were carried out at atmospheric pressure in a continuous-flow
fixed-bed quartz micro-reactor (I.D. 4 mm) packed with samples and quartz wool. Before
142
testing, the catalysts were pre-treated in-situ with a flow of air (100 ml min
-1
) for 1 h at
200 and 300
o
C respectively. For CO oxidation reactions, the feed gas was a mixture of
90%He + 5%CO + 5%O
2
, which was introduced into the reactor at a gas hourly space
velocity (GHSV) of 60,000 cm
3
g
-1
h
-1
. For preferential oxidation of CO in the presence
of hydrogen, the feed gas was a 70%H
2
+ 1%CO + 2%O
2
mixture, introduced into the
reactor at a GHSV of 60,000 cm
3
g
-1
h
-1
. For both reactions, the reaction products were
analyzed on-line using Shimadzu GC-2010 gas chromatography equipped with a thermal
conductivity detector (TCD). The catalysts were evaluated for activity (in terms of CO
conversion) and CO
2
productivity in a temperature range of 25-300
o
C. We took
measurement readings after the system had stabilized for at least 15mins for every
designated reaction temperature. For kinetics study, details are given on Chapter 3 page
55-56.
5.2.3 Characterization of catalysts
Powder X-ray diffraction patterns were recorded at room temperature on a Bruker D8
Advance Diffractometer using a Cu Kα radiation source. Diffraction angles were
measured in steps of 0.015
o
at 1 s/step in the range of 10-80
o
(2θ).
Transition electron microscope measurements were performed on a Tecnai TF 20 S-twin
instrument. Before measurement, all samples were ultrasonically dispersed in ethanol
solvent and then were dried over a carbon grid. The average size of Au particles and its
distributions was estimated by counting about 300 Au particles. JEOL JSM-6700F Field
Emission Scanning Electron Microscope was used to observe the particle shape, size and
morphology. The Au and Cu contents of prepared catalysts were determined by X-ray
143
fluorescence multi-elemental analyses on a Bruker AXS S4 Explorer.
Temperature programmed reduction studies were performed in a continuous-flow fixed-
bed quartz micro-reactor (I.D. 4 mm) with 50 mg samples. The catalyst was first
outgassed by heating at 300
o
C under air flow for 60 min to make sure that the samples
were tested under the same condition as CO oxidation reaction. After cooling to room
temperature, the feed gas was switched to 5%H
2
/Ar. After the baseline had stabilized, the
temperature was increased to 600
o
C at a heating rate of 10
o
C /minute. The amount of H
2
consumed was measured as a function of temperature by means of a thermal conductivity
detector (TCD).
The in-situ Diffusion Reflectance Infrared Fourier Transform spectroscopy (DRIFTS) of
CO adsorption study was carried out on a Bio Rad FTIR 3000 MX spectrometer equipped
with a reaction cell (modified Harricks model HV-DR2). The CuO or CuO-supported Au
sample was loaded into the DRIFT cell with 1:1 weight ratio with KBr. The spectra were
acquired with a resolution of 4cm
-1
typically averaging 150 scans. The sample was
purged with Helium flow (20 ml min
-1
) for 2 hours before exposure to reaction gas. For
CO adsorption experiments, in the flow of various concentrations of CO (0.5%, 1% and
2.0% CO in He) DRIFT spectra were taken after. And as for DRIFT study on surface
species during CO oxidation reaction, the spectra were taken after the introduction of
5%CO with 5%O
2
in He balance. Table 5-1 summarizes the experimental procedure
implemented for CO adsorption and CO oxidation DRIFT study.
144
Table 5-1 Experimental procedure for CO adsorption and oxidation DRIFT study
CO adsorption
CO oxidation
Pre-treat catalyst in air (He) flow at 300
o
C
(573 K) for 1 hour and then cool down to
RT under He flow
Pre-treat catalyst in air (He) flow at 300
o
C
(573 K) for 1 hour and then cool down to
RT under He flow
Background spectra: Catalyst in He
Background spectra: Catalyst in He
0.1% CO (10 min)
0.1% CO+O
2
(10 min)
Purge in He flow for at least 30 mins
remove gas phase CO and physisorbed CO
Purge in He flow for at least 30 mins
remove gas phase CO and physisorbed CO
Take spectra of 0.1%CO adsorption
Take spectra of 0.1%CO oxidation
Purge in He flow for 1hour
Purge in He flow 1 hour
0.2% CO (10 min)
0.2% CO+O
2
(10 min)
Purge in He flow for at least 30 mins
remove gas phase CO and physisorbed CO
Purge in He flow for at least 30 mins
remove gas phase CO and physisorbed CO
Take spectra of 0.2%CO adsorption
Take spectra of 0.2%CO oxidation
Purge in He flow for 1hour
Purge in He flow for 1hour
1% CO (10 min)
1% CO+O
2
(10 min)
Purge in He flow for at least 30 mins
Purge in He flow for at least 30 mins
145
remove gas phase CO and physisorbed CO
remove gas phase CO and physisorbed CO
Take spectra of 1%CO adsorption
Take spectra of 1%CO oxidation
Purge in He flow for 1hour
Purge in He flow for 1hour
2% CO (10 min)
2% CO+O
2
(10 min)
Purge in He flow for at least 30 mins
remove gas phase CO and physisorbed CO
Purge in He flow for at least 30 mins
remove gas phase CO and physisorbed CO
Take spectra of 2%CO adsorption
Take spectra o 2% oxidation
X-ray photoelectron spectroscopy was performed on a VG ESCALAB XPS, ESCA MK
II using Mg Kα (1254.6 eV) source under UHV better than 3 × 10
-9
torr. XPS spectra
were recorded at
= 90° for the X-ray sources. The in-situ XPS experiments were
performed in a UHV chamber at the SINS beamline in the Singapore synchrotron light
source (SSLS) at National University of Singapore.
10
XPS spectra were measured using a
hemispherical electron energy analyzer (EA 125, Omicron NanoTechnology GmbH). The
XPS experiments were done at normal photoelectron emission conFigureuration, with the
photon energy resolution of 0.5 eV. XPS measurements were done at constant pass
energy mode. Table 5.2 summarizes the experimental procedure for CO oxidation in-situ
XPS study. The same scan time on each sample were maintained, because in a Au/CuO
system, not only might the gold species be reduced under x-ray, but the CuO support
might also be reduced under x-ray scan.
146
Table 5.2 Experimental procedure for CO oxidation in-situ XPS study
CO oxidation
As-prepared catalyst in pretreatment chamber,
degas for 30 min then transfer to analysis chamber
Wide Scan
Scan for C1s, O1s, Cu 3p and Au4f
Transfer the samples back to pre-treatment chamber
and 2%CO + 2%O
2
in He doses was injected into pretreatment chamber
with the chamber pressure at 1*10
-4
Torr for 10min
CO + O
2
does was pumped out and sample was outgas for 1 hour then
transferred back to analysis chamber
Scan for C1s, O1s, Cu 3p and Au4f
5.3 Results and discussions
5.3.1 Characterization of the Au/CuO catalysts
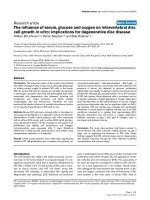
Figure 5.1 shows the SEM micrograph of three kinds of CuO and three kinds of Au/CuO
samples after pre-treatment at 300
o
C in air for 1 hour. No obvious change in sample’s
morphology was observed for these three kinds of CuO samples after gold deposition.
147
Figure 5.1 SEM micrograph for six samples.
5.1(A) CuO(CB) pre-treated in air for 1 hour at 300
o
C
5.1(B) CuO(NP) pre-treated in air for 1 hour at 300
o
C
5.1(C) CuO(NF) pre-treated in air for 1 hour at 300
o
C
5.1(D) Au/CuO (CB) pre-treated in air for 1 hour at 300
o
C
5.1(E) Au/CuO(NP) pre-treated in air for 1 hour at 300
o
C
5.1(F) Au/CuO(NF) pre-treated in air for 1 hour at 300
o
C
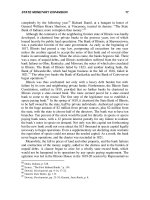
Figure 5.2 displays XRD patterns of three kinds of Au/CuO samples after heating in air
at 300
o
C for 1 hour. All three CuO supports show crystalline structure of monoclinic
Tenorite CuO. The Au <111> diffraction at 38.2º is not detected because of its
overlapping with strong (111) (200) reflections of CuO. Gold signals may be too weak
due to the small crystallite size of gold and the low concentration of gold.
A
E
C
B
D
F
148
10 20 30 40 50 60 70 80
3000
3500
4000
4500
5000
5500
Counts
a:Au/CuO (CB)
b:Au/CuO (NF)
c:Au/CuO (NP)
a
b
c
Au (111)
Figure 5.2 XRD data for three kinds of Au/CuO catalysts.
Figure 5.3 shows the TEM images of the three kinds of Au/CuO samples heated in air
for 1 hour at 300
o
C. Clearly Au particles are well dispersed in a few nanometer ranges.
A
B
C
F
E
D
149
Figure 5.3 TEM micrograph for gold supported on three kinds of CuO supports
5.3 (A) (D) TEM for Au/CuO (CB) sample pre-treated in air for 1 hour at 300
o
C
5.3 (B) (E) TEM for Au/CuO (NP) sample pre-treated in air for 1 hour at 300
o
C
5.3 (C) (F) TEM for AuCuO (NF) sample pre-treated in air for 1 hour at 300
o
C
The size distribution of Au nanoparticles is shown in Figure 5.4 for the three kinds of
Au/CuO samples after pre-treated at 300
o
C in air for 1 hour. Detailed information for
XRF and BET results of gold supported CuO samples are listed in Table 5.3. The gold wt%
content of these Au/CuO samples were all around 2.2-2.0 % according to the x-ray
fluorescence (XRF) results. It is noticed that the surface area of samples before and after
pre-treatement in air at 200
o
C (or 300
o
C) for 1 hour are not distinct.
Figure 5.4 Bar graph of three kinds of Au/CuO samples
(a) Au/CuO (CB) (b) Au/CuO (NP) (c) Au/CuO (NF)
Table 5.3 Au atom% in three kinds of Au/CuO samples from XRF,
BET results of three kinds of CuO, and three kinds of Au/CuO samples.
CuO
(CB)
Au/CuO
(CB)
CuO
(NP)
Au/CuO
(NP)
CuO
(NF)
Au/CuO
(NF)
XRF
(Au wt%)
As-prepared
NA
2.2%
NA
2.1%
NA
2.0%
BET
(m
2
/g)
As-prepared
7.9
7.7
27.6
28.3
17.8
17.8
200
o
C Pretreat
NA
7.4
NA
27.4
NA
16.8
Pretreat 300
o
C
NA
6.8
NA
25.1
NA
15.9
1 2 3 4 5 6 7
0
5
10
15
20
25
30
Au particle size(nm)
AuCuO (CB)
Size distribution(%)
1 2 3 4 5 6 7
0
5
10
15
20
25
30
35
40
Size distribution(%)
Au particle size(nm)
AuCuO (NF)
1 2 3 4 5 6 7
0
5
10
15
20
25
30
35
Size distribution(%)
Au particle size(nm)
AuCuO(NP)
150
H
2
temperature programmed reduction (TPR) was conducted to investigate the effect of
surface lattice oxygen and adsorbed oxygen species on the CO oxidation reaction. TPR
profiles of CuO (CB), CuO (NP), Au/CuO (CB) and Au/CuO (NP) are shown in Figure
5.5. All the four samples are basically stable between 25-200
o
C which is our reaction
temperature range. CuO(NP) (curve b) is very difficult to reduce while Au/CuO (NP)
sample is the most active among these four samples. The area of the TPR peak of CuO
(CB) is much smaller than that of other three samples, suggesting smaller amount of
movable oxide ions. The presence of Au greatly enhances the reducibility of CuO(CB).
Under similar experimental conditions (amount of the sample etc) the peak area of the
Au/CuO (CB) catalyst is several times that of CuO(CB). Nevertheless the oxide ions in
Au/CuO(CB) is less movable than Au/CuO(NP).
100 200 300 400 500 600
0
50000
100000
150000
a: CuO (CB)
b: CuO (NP)
c: Au/CuO(CB)
d: Au/CuO(NP)
Intensity(a.u.)
Temp(
o
C)
a
b
c
d
Figure 5.5 TPR profiles of CuO (CB), CuO (NP), Au/CuO (CB) and Au/CuO (NP)
(a) CuO (CB); (b) CuO (NP); (c) Au/CuO (B); (d) Au/CuO (NP)
5.3.2 Catalytic study of CO oxidation reaction over Au/CuO catalyst
151
A few groups have studied the carbon monoxide oxidation behavior over powdered
copper oxide.
11-14
It is generally agreed that CO oxidation over copper oxide catalysts
obeys a Mars-van-Krenvelen redox mechanism. Carbon monoxide reacts with surface
lattice oxygen to release carbon dioxide and leaves a surface oxygen vacancy on the
metal oxide surface. This is the step that determines reaction rate. Molecular oxygen then
reacts with surface oxygen vacancy to form surface lattice oxygen.
12
Before the reaction,
all our three samples were black/dark brown in color. During the reaction, the
temperature was increased from room temperature to 350
o
C at steps of 50
o
C per testing,
and held at every testing for at least half an hour, in the end held at 350
o
C for 2 hours.
After the reaction, the sample became red color copper metal. This may imply that under
the oxygen-lean conditions CuO can be reduced to lower oxidation states from II to 0.
Cu
0
species was not able to activate CO oxidation at reaction temperatures 25-350
o
C. In
order to keep the catalyst active for CO oxidation, the CO : O
2
ratio in feed gas, the
reaction temperature and the space velocity of the feed gas were optimized to increase the
life span of gold on copper oxide catalysts and at the same time, increase their catalytic
activities. In this chapter, our interests are gold catalyst supported on CuO. CO
oxidation reactions over CuO without the presence of Au were studied as reference for
comparing the differences between activities of CuO and Au/CuO samples. Therefore,
the oxidation reaction conditions were optimized for the CO oxidation over Au/CuO,
rather than over Copper oxide without Au.
Figure 5.6 shows the conversion of CO over CuO (CB), CuO (NF), CuO (NP), Au/CuO
(CB), Au/CuO (NF) and Au/CuO (NP), as a function of reaction temperature after
pretreatment in air for 1 hour at 200
o
C. Without the presence of Au, CuO can still
152
catalyze the CO oxidation. Among the three kinds of copper oxide, CuO (NP) is the best
catalyst, reaching 100% CO conversion at 140
o
C (d curve). CuO (CB) is the poorest
achieving 100% CO oxidation at 220
o
C (f curve). Nano-gold on copper oxide samples
show much better CO oxidation activities than the copper oxide samples. Au/CuO (NP) is
the best CO oxidation catalyst among all these samples. It reaches 50% CO conversion at
75
o
C, and 100% at 100
o
C. Au/CuO(CB) sample achieved 100% CO conversion at c.a.
130
o
C. Note that the catalytic activity of both Au/CuO and CuO is related to the specific
surface area, higher surface area corresponding to higher activity [a(28.3
m
2
/g)>b(17.8m
2
/g)>c(7.7m
2
/g); d(27.6)>e(17.8)>F(7.9)]. All these samples are poor in
catalytic activities at temperature below 50
o
C.
0 30 60 90 120 150 180 210 240
0
20
40
60
80
100
120
CO conversion(%)
Temp(
o
C)
a: Au/CuO(NP)
b: Au/CuO(NF)
c: Au/CuO(CB)
d: CuO(NP)
e: CuO(NF)
f: CuO(CB)
a
b
f
e
c
d
Figure 5.6 Conversion of CO as a function of reaction temperature over the three kinds of CuO
samples and the three kinds Au/CuO samples. Reaction conditions: 5%CO+5%O
2
in He, GHSV:
60,000 cm
3
g
-1
h
-1
. Sample pre-treated at 200
o
C in air for 1 hour.
(a) Au/CuO (NP) (b) Au/CuO (NF) (c) Au/CuO (CB)
(d) CuO (NF) (e) CuO(NP) (f) CuO (CB)
153
In order to study the effect of pre-treatment temperature on the catalytic activity Au/CuO
samples, the above three Au/CuO samples were pre-treated in air for 1 hour at 200, 300
and 400
o
C individually. Their CO oxidation activities are displayed in Figure 5.7.
20 40 60 80 100 120 140 160
0
20
40
60
80
100
Temperature(
o
C)
CO conversion(%)
a:Au/CuO(NP) pre-treat at 200
o
C
b:Au/CuO(NF) pre-treat at 200
o
C
c:Au/CuO(CB) pre-treat at 200
o
C
d:Au/CuO(NP) pre-treat at 300
o
C
e:Au/CuO(NF) pre-treat at 300
o
C
f:Au/CuO(CB) pre-treat at 300
o
C
g:Au/CuO(NP) pre-treat at 400
o
C
h:Au/CuO(NF)pre-treat at 400
o
C
i:Au/CuO(CB) pre-treat at 400
o
C
a
b c
d
e
f g
h
i
Figure 5.7 Conversion of CO as a function of reaction temperature over three kinds Au/CuO
samples at different temperature.
a, d, g: Au/CuO (NP) pre-treated at 200
o
C 300
o
C and 400
o
C;
b, e, h: Au/CuO (NF) pre-treated at 200
o
C 300
o
C and 400
o
C;
c, f, i: Au/CuO (CB) pre-treated at 200
o
C 300
o
C and 400
o
C;
Reaction conditions: 5%CO+5%O
2
in He, GHSV: 60,000 cm
3
g
-1
h
-1
.
For each Au/CuO sample, the trend of increasing pre-treating temperature is the same, i.e.
A
300
o
C
> A
200
o
C
> A
400
o
C.
(A=activity and d>a>g ; e>b>h ; f>c>i). The samples that were
pre-treated at 300
o
C in air show much better catalytic activities for CO oxidation than
154
those that were pre-treated in air at 200
o
C and 400
o
C. The Au/CuO (NP) sample
pretreated at 300
o
C reaches 100% CO conversion at 50
o
C (curve d in Figure 5.7).
20 30 40 50 60 70 80 90
0
20
40
60
80
100
a
b
CO conversion(%)
Temp(
o
C)
a:Au/CuO (NP)
b:Au/CuO (NF)
c:Au/CuO (CB
c
Figure 5.8 Conversion of CO as a function of reaction temperature over three kinds Au/CuO samples.
Reaction conditions: 5%CO+5%O
2
in He, GHSV: 60,000 cm
3
g
-1
h
-1
. Sample pre-treated at 300
o
C in
air for 1 hour. (a) Au/CuO (NP) (b) Au/CuO (NF) (c) Au/CuO (CB)
The Au/CuO(NF) and Au/CuO (CB) samples show 100% CO conversion at 75 and 90
o
C
respectively (Figure 5.8). There are two possible explanations for the strong effect of
pre-treatment temperature on the activity of nano-gold supported on copper oxide. The
first one is related to the use of capping agent in colloid-based preparation of the Au/CuO
catalysts. The capping agent, lysine decomposes at ca. 250
o
C. Au/CuO samples
pretreated at 300
o
C can completely decompose lysine molecules bonded to Au cluster so
that the reactants CO or O
2
have higher access to the active sites. Hence pretreatment at
300
o
C can enhance the activity. Further increase of the pretreating temperature to 400
o
C
may result in Au particle sintering or agglomeration. The Tammann temperature for bulk
gold is around 422
o
C, which is derived based on the equation: Tammann temperature
155
(T
Tammann
) equals to 0.52 T
F
, where T
F
is metal’s absolute melting temperature. The
melting point of bulk Au is 1064
o
C,
15
while the Tammann temperature of as-prepared
gold nano particles can fall between 200-300
o
C. The melting point of small gold particles
is known to decrease with their particle size. According to Cortie, measured melting
point for gold nano particles with particle size around 5nm is about 250
o
C.
16
Hence gold
particle sizes would increase with increasing pre-treatment temperature. The catalytic
activity of nano-Au is extremely sensitive to the Au particle size. At 400
o
C, although
gold particles were dispersed quite evenly on the copper oxide surface, gold particles
aggregated to become larger particles, thus samples pre-treated at this temperature
showed the worst CO oxidation activity among these three sets of catalysts. Also, the
surface area of Au/CuO samples calcined at 400
o
C is lower than those calcined at 200
o
C
and 300
o
C。
The results might indicate that the size of the gold particle has greater influence over CO
oxidation activity than the dispersion of the gold particles. Long-term CO oxidation
activity tests for three kinds of Au/CuO samples pre-treated at 300
o
C in air for 1 hour
were also conducted. All samples were able to maintain their CO oxidation activities at
the temperature where they hit 100% conversion of CO for 72 hours.
Kinetics of CO Oxidation.
Figure 5.8 shows that the catalytic activity of the Au/CuO (NP) is much higher than that
of the Au/CuO (CB) in the temperature range of 25-100
o
C. For Au/CuO (NP), the
conversion of CO was ca. 50% at 37
o
C (T
50
) and reached 100% at 50
o
C. In contrast, in
the Au/CuO (CB) sample, T
50
was detected at 70
o
C, and 100% conversion was obtained
156
at 80
o
C. The Arrhenius plot of CO oxidation rate (Figure 5.9) yields apparent activation
energy (Ea) of 3.8 kJ/mol for Au/CuO (NP), which is relatively low compared to 5.8
kJ/mol for Au/CuO (CB). The published kinetic data for CO oxidation on various Au
supported catalysts together with our results are summarized in Table 5.4, including the
intrinsic reactivity around room temperature in terms of the mass-specific reaction rates
[mmol/g
Au
·s], the turnover frequencies (TOFs) and apparent activation energies. The
apparent activation energy is as seen in Figure 5.9.
2.8 3.0 3.2 3.4
-3
-2
-1
0
1
Ln(rate)(mmol/g
Au
s)
1000/T(K)
A: Au/CuO(CB)
B: Au/CuO(NP)
A
B
Ea~3.8KJ/mol
Ea~5.8KJ/mol
Figure 5.9 Arrhenius plots from 25 to 100
o
C for CO oxidation (5%CO+5%O
2
in He) over Au/CuO (B)
catalyst (A) and Au/CuO (NP) catalyst (B). Both samples were pre-treated in air for 1 hour at 300
o
C
Table 5.4 Comparison of published literature data for CO oxidation rates on metal oxide
supported Au catalysts.
catalyst
particle
size (nm)
preparation
a
temp.
(K)
Ea
(kJ/ mol)
r
CO
b
ref
[mmol/g
Au
·s]
[TOF s
-1
]
Au (2.2wt %)-CuO (CB)
Au (2.1wt %)-CuO(NP)
Au (2.8wt %)-CeO
2
Au (3wt %)-CeO
2
Au (0.77wt %)-ZrO
2
Au (0.74wt %)-ZrO
2
Au (6.6wt %)-SiO
2
Au (0.9 wt %)/ç-Al
2
O
3
Au (1.9 wt %)/ç-Al
2
O
3
4.6
4.4
4.2
5.4
4
6.6
4.6
4.0
CB
CB
DP
DP
DP
DP
CVD
CVD
PD
298
298
263
263
343
343
273
273
295
5.8
3.8
17
32
0.07
0.22
2.2 x 10
-3
6.0 x 10
-3
9.4 x 10
-2
-
6
0.04
0.12
-
-
-
-
2 10
-2
0.02
0.12
this study
this study
17,18
19
20
20
21
9
9
157
a
Preparation methods: CB, colloid - based method; DP, deposition participation; CVD, chemical vapor deposition; PD,
photodepostion, IMP: impregnation with HAuCl
4
.
The reaction rate for Au/CuO (NP) equals to 0.22 mmol/g
Au
·s, and 0.07 mmol/g
Au
·s for
Au/CuO (CB). The 0.12 s
-1
of TOF at 25
o
C (298 K) for Au/CuO (NP) is about three
times that of Au/CuO (CB). The activation energies of Au/CuO (CB) and Au/CuO (NP)
samples are also lower than the values obtained from the Al
2
O
3
results, and the reaction
rate is faster than CeO
2
, Al
2
O
3
and ZrO
2
supported Au catalysts prepared by other
groups.
17-22
Selective oxidation of carbon monoxide in hydrogen
Figure 5.10 -5.13 show the CO conversion and O
2
selectivity for selective oxidation of
carbon monoxide in hydrogen over the three kinds of Au/CuO samples. These sets of
Au/CuO samples were pre-treated at 300
o
C in air for 1 hour, and the reaction gas mixture
had 1%CO, 2% O
2
and 70%H
2
in He, with a GHSV of 60,000 cm
-3
g
-1
h
-1
. Au/CuO (NP)
still exhibited the best CO conversion and selectivity to CO
2
among the three samples. At
80
o
C, this sample attained 86% CO conversion and 39% selectivity to CO
2
. As for
Au/CuO (NF) sample, the conversion of carbon monoxide was 71% at 95
o
C and the
selectivity to CO
2
at this temperature was 18.1%. The Au/CuO (CB) sample reached 18%
selectivity to CO
2
at 125
o
C when the CO conversion was 91%. The CO conversions of
these three kinds of Au/CuO samples with H
2
presence were worse than those without H
2
presence, which may be related to the high reducibility of CuO. CuO(CB) has less
movable oxide ions, and hence Au/CuO(CB) can achieve 91% conversion though higher
temperature (130
o
C) is required.
158
20 40 60 80 100 120
0
20
40
60
80
100
a:Au/CuO(NP)
b:Au/CuO(NF)
c:Au/CuO (CB)
CO conversion(%)
Temp(
o
C)
a
b
c
Figure 5.10 Conversion of CO as a function of reaction temperature over three kinds Au/CuO
samples. Reaction conditions: 1%CO+2%O
2
+70%H
2
in He, GHSV: 60,000 cm
3
g
-1
h
-1
. Sample pre-
treated at 300
o
C in air for 1 hour. (a) Au/CuO (NP) (b) Au/CuO (NF) (c) Au/CuO (CB)
20 30 40 50 60 70 80 90
0
20
40
60
80
O
2
selectivity
(
%
)
CO conversion
(
%
)
Temperature(
o
C)
CO conversion(%)
Selectivity of O
2
(%)
Au/CuO(NP)
28
32
36
40
44
48
52
56
60
64
68
72
76
Figure 5.11 CO conversion and O
2
selectivity as a function of reaction temperature over Au/CuO (NP)
samples. Reaction conditions: 1%CO+2%O
2
+70%H
2
in He, GHSV: 60,000 cm
3
g
-1
h
-1
. Sample pre-
treated at 300
o
C in air for 1 hour.
159
20 40 60 80 100 120
0
20
40
60
80
CO conversion(%)
Selectivity of O
2
(%)
CO conversion
(
%
)
Temperature (
o
C)
Au/CuO(NF)
0
20
40
60
80
Selectivity of O
2
(%)
Figure 5.12 CO conversion and O
2
selectivity as a function of reaction temperature over Au/CuO (NF)
samples. Reaction conditions: 1%CO+2%O
2
+70%H
2
in He, GHSV: 60,000 cm
3
g
-1
h
-1
. Sample pre-
treated at 300
o
C in air for 1 hour.
20 40 60 80 100 120 140
0
20
40
60
80
Au/CuO(CB)
Temperature(
o
C)
Selectivity of O
2
(%)
CO conversion(%)
20
30
40
50
60
70
CO conversion
(
%
)
Selectivity of O
2
(%)
Figure 5.13 CO conversion and O
2
selectivity as a function of reaction temperature over Au/CuO
(CB) samples. Reaction conditions: 1%CO+2%O
2
+70%H
2
in He, GHSV: 60,000 cm
3
g
-1
h
-1
. Sample
pre-treated at 300
o
C in air for 1 hour.
160
5.3.3 DRIFTs study on CO adsorption and CO oxidation over CuO and CuO
supported gold catalysts
5.3.3.1 DRIFT study of CuO samples
FTIR spectrum (taken in transmission mode) of CuO (CB) sample (pretreated at 300
o
C in
20 ml min
-1
air flow for 1 h) is shown in Figure 5.14(a). The Cu—O stretching is located
at 532 and 588 cm
-1
(Figure 5.14a), indicating that Cu ions in bulk exist in 2+ oxidation
state.
3500 3000 2500 2000 1500 1000 500
50
60
70
80
90
100
536.20959
588.2875
1633.70331
650 600 550 500 450 400
50
60
70
80
90
100
Wavenumber(cm
-1
)
588
532
3449.4
%Transmittance
Wavenumber(cm
-1
)
CuO (CB)
(a)
161
4000 3500 3000 2500 2000 1500 1000 500
Absorpsions(a.u.)
wavenumber(cm
-1
)
(i) Cu
2
O
(ii) CuO(CB)
(iii) CuO(NP)
Figure 5.14 FTIR spectra of the CuO (CB) sample (a) transition mode; (b) DRIFT mode: (i) Cu
2
O
(black curve); (ii) CuO(CB) (red); and (iii) CuO(NP) (green).
The DRIFT spectra in Figure 5.14(b) were obtained from the CuO (CB) sample after in-
situ pre-treatment in air at 300
o
C for one hour, then cooling down to room temperature.
It is interesting to note that for the same CuO(CB) sample the principal peak, Cu-O
stretching, is shifted from 588 cm
-1
in Figure 5.14(a) (transmission mode) to 630 cm
-1
in
Figure 5.14(b) (DRIFT mode), similar to that of Cu
2
O. Obviously this peak is attributed
to Cu
+
O.
22
This may indicate that the Cu ion on CuO(CB) and CuO(NP) are mainly at
+1 oxidation state, since DRIFT may contain information from surface. This is
understandable since both CuO(CB) and CuO(NP) samples consists of particles of <100
nm so that large portion of Cu ions on surface are bonding-unsaturated, and Cu(I) sites
are largely present on the surface.
(b)
162
For Cu
2
O, CuO(CB) and CuO(NP) samples after 300
o
C heating in air, there is a shoulder
peaked at ~821cm
-1
, which is of the highest intensity for CuO(NP) and weakest for Cu
2
O.
This band may be ascribed to di- bonded surface oxide species: CuO + O
-
(OCu=O)
-
.
23-24
Peroxide species Cu
+
(O
2
2-
) might also have its peak between 800 and 900 cm
-1
.
Thus, it can be inferred that there are more oxygen vacancy on CuO (NP) surface than
CuO(CB) and Cu
2
O samples. During the air pre-treatment process, OCu=O or/and
Cu
+
(O
2
2-
) may form the reaction O
2
+ Cu□
s
. The peaks at 1285 and 1518 cm
-1
are very
obvious on the CuO (NP) sample (Figure 5.14 (b)). These peaks can be assigned as
carbonates vibrations ν(OCO)
25-27
.
The peak due to hydrogen-bonded OH groups at
3450cm
-1
is also relatively stronger on the CuO (NP) sample than on CuO(CB). These
results indicate that CuO (NP) absorb more carbonates and OH on its surface than CuO
(CB).
5.3.3.2 CO adsorption over CuO samples
Upon the introduction of CO, two CO peaks are observed at 2100 and 2120 cm
-1
on
CuO(CB) sample.(Figure 5.15(a)) Their intensities are weak and increase with
increasing CO concentration. When the reaction cell was purged with a He stream, the
intensity of band at 2100 cm
-1
decreased after purging in He. The band at 2100cm
-1
is due
to Cu
0
-CO and the one at 2120 cm
-1
to Cu
+
-CO. Cu cations were partially reduced to Cu
0
by the introduced CO or due to the low coordination number on surface. Gas phase CO
2
can be observed at 2330 and 2360 cm
-1
. Figure 5.15(b) shows CO adsorption of CuO
(NP). There is only one CO vibration at 2120 cm
-1
, and could be assigned to Cu
+
-CO. It
is noted that some OH groups can be observed on CuO(NP) but little on CuO(CB).
4000 3500 3000 2500 2000 1500 1000 500
2200 2150 2100 2050 2000
Intensity(a.u.)
wavenumber(cm
-1
)
2100
2120
a
b
c
d
0.04
a:He
b:0.5% CO
c:1.0% CO
d: 2.0% CO
Absorbance (a.u.)
wavenumber(cm-
1
)
a
b
c
d
(A)
163
These OH groups are bonded to Cu ions which may explain why no Cu
0
CO are detected
on CuO(NP).
Figure 5.15 DRIFT spectra in the region between 2000 and 2200 cm
-1
for CO adsorption on (A) CuO
(CB) and (B) CuO(NP) at room temperature taken after exposure to increasing CO concentration
flow gas for 10 min, followed by He purge for 15 min. Before the measurements, the catalyst was
pretreated in air flow (20 ml min
-1
) for 1 hour at 300
o
C.
5.3.3.3 CO adsorption over Au/CuO samples
The DRIFT spectra of Au/CuO (CB) sample after CO adsorption (Figure 5.16) shows
lots of noises at range 400-600 cm
-1
, but one can tell that there seems still a strong band
at ca. 648 cm
-1
. This might mean that the Au atoms have already influenced the vibration
between the surfaces Cu and O atoms, or this is evidence for Cu-Au interaction. A similar
phenomenon was also observed for Au/CuO (NP) sample (Figure 5.17).
4000 3500 3000 2500 2000 1500 1000 500
0
4
8
2200 2150 2100 2050 2000
Intensity(a.u.)
wavenumber(cm
-1
)
2100
2120
a
b
c
d
0.04
a:He
b:0.5% CO
c:1.0% CO
d: 2.0% CO
Absorbance (a.u.)
wavenumber(cm-
1
)
a
b
c
d
(A)