Analysis and design of flexible systems to manage demand uncertainty and supply disruptions
Bạn đang xem bản rút gọn của tài liệu. Xem và tải ngay bản đầy đủ của tài liệu tại đây (680.03 KB, 165 trang )
ANALYSIS AND DESIGN OF FLEXIBLE SYSTEMS
TO MANAGE DEMAND UNCERTAINTY AND
SUPPLY DISRUPTIONS
GEOFFREY BRYAN ANG CHUA
NATIONAL UNIVERSITY OF SINGAPORE
2009
ANALYSIS AND DESIGN OF FLEXIBLE SYSTEMS
TO MANAGE DEMAND UNCERTAINTY AND
SUPPLY DISRUPTIONS
GEOFFREY BRYAN ANG CHUA
(M.Sci., University of the Philippines)
A THESIS SUBMITTED
FOR THE DEGREE OF DOCTOR OF PHILOSOPHY
DEPARTMENT OF DECISION SCIENCES
NATIONAL UNIVERSITY OF SINGAPORE
2009
ACKNOWLEDGMENT
First of all, I would like to express my sincerest gratitude to my advisor
Prof. Mabel Chou. This thesis would not have been possible without her
continuous support and guidance. I am fortunate to know Prof. Chung-Piaw
Teo as my mentor, and I thank him for sharing with me his knowledge and
passion for research. It is a great honor for me to have spent the past five
years learning from them.
I am thankful to my thesis committee members, Prof. Melvyn Sim
and Prof. Sun Jie, for their valuable suggestions and guidance throughout
my Ph.D. study. Profs. James Ang, Rick So, Chou Fee Seng, Yaozhong
Wu, Jihong Ou, and Hengqing Ye at the Decision Sciences department, and
Profs. Andrew Lim, George Shanthikumar, and Max Shen at Berkeley have
also taught me many things ab out research and academic life in general.
I am specially grateful to Marilyn Uy and Victor Jose, two long-time
friends with whom I shared the same academic path for the past five years.
It was our friendship and mutual encouragement that got me through some
tough times. Our friendship is truly a blessing. I also want to thank my
friends at NUS, Huan Zheng, Wenqing Chen, Hua Tao, Shirish Srivastava,
Annapoornima Subramaniam, Marcus Ang, Su Zhang, Qingxia Kong, Vinit
Kumar, and Zaheed Halim, for the exciting times and wonderful memories.
iv
I will forever be indebted to my parents for their nurture and uncondi-
tional love. Likewise, I am thankful to my siblings Irene, Stanley, Catherine
and Frederick for their support and encouragement.
Finally, I express my heartfelt gratitude, love and admiration to my
fianc´ee Gem, whose love and support have been a source of joy and a pillar
of strength for me.
G. A. Chua
Singapore, April 2009
CONTENTS
1. Introduction . . . . . . . . . . . . . . . . . . . . . . . . . . . . . . . 1
1.1 Process Flexibility . . . . . . . . . . . . . . . . . . . . . . . . 3
1.1.1 Literature Review . . . . . . . . . . . . . . . . . . . . . 6
1.2 Research Objectives and Results . . . . . . . . . . . . . . . . . 12
1.3 Preliminaries: Models and Measures . . . . . . . . . . . . . . . 16
1.3.1 Optimization Models . . . . . . . . . . . . . . . . . . . 18
1.3.2 Performance Measures . . . . . . . . . . . . . . . . . . 21
1.4 Structure of Thesis . . . . . . . . . . . . . . . . . . . . . . . . 25
2. Asymptotic Chaining Efficiency . . . . . . . . . . . . . . . . . . . . 27
2.1 The Basic Model . . . . . . . . . . . . . . . . . . . . . . . . . 29
2.2 The Random Walk Approach . . . . . . . . . . . . . . . . . . 33
2.3 Applications . . . . . . . . . . . . . . . . . . . . . . . . . . . . 42
2.3.1 Two-Point Distribution . . . . . . . . . . . . . . . . . . 42
2.3.2 Uniform Distribution . . . . . . . . . . . . . . . . . . . 43
2.3.3 Normal Distribution . . . . . . . . . . . . . . . . . . . 44
2.4 Extensions . . . . . . . . . . . . . . . . . . . . . . . . . . . . . 45
2.4.1 New Random Walk: Alternating Renewal Process . . . 46
2.4.2 Example: Non-symmetrical Demand . . . . . . . . . . 48
Contents vi
2.4.3 Example: Unbalanced System . . . . . . . . . . . . . . 50
2.4.4 Higher-degree Chains . . . . . . . . . . . . . . . . . . . 51
3. Range and Response: Dimensions of Flexibility . . . . . . . . . . . 54
3.1 The General Model . . . . . . . . . . . . . . . . . . . . . . . . 56
3.2 Valuing the Chaining Strategy . . . . . . . . . . . . . . . . . . 63
3.2.1 System Response is Low . . . . . . . . . . . . . . . . . 65
3.2.2 System Response is Perfect . . . . . . . . . . . . . . . 69
3.2.3 System Response is High . . . . . . . . . . . . . . . . . 75
3.2.4 Computational Examples . . . . . . . . . . . . . . . . . 79
3.3 Trade-offs and Complements . . . . . . . . . . . . . . . . . . . 82
3.3.1 Range versus Response . . . . . . . . . . . . . . . . . . 82
3.3.2 System Response and Demand Variability . . . . . . . 91
4. Value of the Third Chain . . . . . . . . . . . . . . . . . . . . . . . . 93
4.1 Process Flexibility and Production Postponement . . . . . . . 94
4.1.1 Model Description . . . . . . . . . . . . . . . . . . . . 96
4.1.2 Insufficiency of the 2-Chain . . . . . . . . . . . . . . . 100
4.1.3 Sufficiency of the 3-Chain . . . . . . . . . . . . . . . . 108
4.1.4 The Flexibility-Postponement Trade-off . . . . . . . . . 112
4.1.5 The Asymmetric Case . . . . . . . . . . . . . . . . . . 121
4.2 Process Flexibility and Supply Disruptions . . . . . . . . . . . 128
4.2.1 Fragility and Flexibility . . . . . . . . . . . . . . . . . 131
4.2.2 Fragility, Flexibility and Capacity . . . . . . . . . . . . 135
4.2.3 The Asymmetric Case . . . . . . . . . . . . . . . . . . 138
Contents vii
5. Conclusions . . . . . . . . . . . . . . . . . . . . . . . . . . . . . . . 140
ABSTRACT
Facing intense market competition and high demand variability, firms are
beginning to use flexible process structures to improve their ability to match
supply with uncertain demand. The concept of chaining has been extremely
influential in this area, with many large automakers already making this the
cornerstone of their business strategies to remain competitive in the industry.
In this thesis, we aim to provide a theoretical justification for why partial
flexibility works nearly as well as full flexibility. We also seek to extend
the theory of partial flexibility to environments that take into account new
factors relevant to the practice of process flexibility.
We first study the asymptotic performance of the chaining strategy in
the symmetric system where supply and (mean) demand are balanced and
identical. We utilize the concept of a generalized random walk to show that
an exact analytical method exists that obtains the chaining efficiency for gen-
eral demand distributions. For uniform and normal demand distributions,
the results show that the 2-chain already accrues at least 58% and 70%,
respectively, of the benefits of full flexibility. Our method can also be ex-
tended to more general cases such as non-symmetrical demands, unbalanced
systems, and higher-degree chains.
We then extend our analysis to take into account the response dimension,
Abstract ix
the ease with which a flexible system can switch from producing one product
to another. Our results show that the performance of any flexible system may
be seriously compromised when response is low. Nevertheless, our analytical
lower bounds show that under all response scenarios, the 2-chain still manages
to accrue non-negligible benefits (at least 29.29%) vis-`a-vis full flexibility.
Furthermore, we find that given limited resources, upgrading system response
outperforms upgrading system range in most cases, suggesting a proper way
to allocate resources. We also observe that improving system response can
provide even more b enefits when coupled with initiatives to reduce demand
variability.
Next, we consider the impact of partial production postponement on the
performance of flexible systems. Under partial postponement, we find that
results on chaining under full postponement may not hold. In the example
of small systems, when postponement level is lower than 80%, the celebrated
2-chain may perform quite badly, with a performance loss of more than 12%.
By adding another layer of flexibility, i.e. a third chain, the optimality loss
is restored to 5% even when postponement drops to 65%. We also study
the flexibility-postponement tradeoff and find that a firm operating with
a 3-chain at 70% postponement can perform extremely well with minimal
optimality loss.
Finally, we look into the fragility of flexible systems under the threat
of supply disruptions. Under both link and node disruptions, we find that
having a third chain, or a third layer of flexibility in the asymmetric setting,
can greatly reduce system fragility. Furthermore, when additional capacity is
made available, the performance of the third chain appears to be insensitive
Abstract x
to how this extra capacity is allocated, which differs from the case of the
2-chain. These observations, in conjunction with the recommendations for
partial production postponement, suggest that there is substantial value in
employing the third chain.
LIST OF FIGURES
1.1 The Benefits of Process Flexibility . . . . . . . . . . . . . . . . 4
1.2 Chaining is Almost as Good as Full Flexibility . . . . . . . . . 8
1.3 Bipartite Graph Representation of 3 ×3 Flexibility Structures 17
2.1 Sample Path for Original Random Walk . . . . . . . . . . . . 37
2.2 Sample Path for Toggling Random Walk . . . . . . . . . . . . 37
3.1 Chaining Efficiency vs. Secondary Production Cost (3 × 3
System with Uniform Demand) . . . . . . . . . . . . . . . . . 63
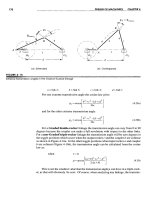
3.2 Long Chain vs. Short Chains: The Effect of System Response 68
3.3 Sample Cut for Network with Perfect System Response: C
1
=
{s, 1, 2, . . . , M −1, M + N} . . . . . . . . . . . . . . . . . . . 72
3.4 Bounds for Asymptotic Chaining Efficiency vs. Secondary
Production Cost (Uniform and Normal Demands) . . . . . . . 81
3.5 Full Flexibility’s Least Secondary Production Cost vs. System
Size (Discrete Uniform Demand) . . . . . . . . . . . . . . . . . 86
3.6 Full Flexibility’s Least Secondary Production Cost vs. System
Size (Normal Demand) . . . . . . . . . . . . . . . . . . . . . . 86
List of Figures xii
3.7 Full Flexibility’s Least Secondary Production Cost vs. Par-
tial Flexibility’s Secondary Production Cost (Discrete Uniform
Demand) . . . . . . . . . . . . . . . . . . . . . . . . . . . . . . 88
3.8 Full Flexibility’s Least Secondary Production Cost vs. Partial
Flexibility’s Secondary Production Cost (Normal Demand) . . 88
3.9 Example of Asymmetric and Correlated System . . . . . . . . 90
4.1 Asymptotic Chaining Efficiency vs Level of Production Post-
ponement . . . . . . . . . . . . . . . . . . . . . . . . . . . . . 111
4.2 Expected Mismatch Cost vs. Level of Production Postponement114
4.3 Expected Mismatch Cost vs. Level of Process Flexibility . . . 115
4.4 Indifference Curves for Flexibility and Postponement . . . . . 117
4.5 Box and Whisker Plots for Fragility Values of 2-Sparse and
3-Sparse Structures of Asymmetric Systems Under Link and
Node Disruptions . . . . . . . . . . . . . . . . . . . . . . . . . 139
LIST OF TABLES
1.1 Partial Listing of Top 100 Brands by Country . . . . . . . . . 2
2.1 Expected Sales Ratio and Chaining Efficiency as System Size
Increases . . . . . . . . . . . . . . . . . . . . . . . . . . . . . . 28
2.2 Asymptotic Chaining Efficiency for Various Levels of Discretiza-
tion and Demand Uncertainty . . . . . . . . . . . . . . . . . . 44
2.3 Asymptotic Sales Ratio for Various Levels of Demand Uncer-
tainty . . . . . . . . . . . . . . . . . . . . . . . . . . . . . . . 45
2.4 Asymptotic Chaining Efficiency for Various Levels of Safety
Capacity and Demand Uncertainty . . . . . . . . . . . . . . . 51
2.5 Asymptotic Sale Ratio for Various Levels of Safety Capacity
and Demand Uncertainty . . . . . . . . . . . . . . . . . . . . . 52
2.6 Asymptotic Chaining Efficiency for Various Levels of Partial
Flexibility and Demand Uncertainty . . . . . . . . . . . . . . . 52
2.7 Asymptotic Sales Ratio for Various Levels of Partial Flexibility
and Demand Uncertainty . . . . . . . . . . . . . . . . . . . . . 53
3.1 Summary of System Response Levels . . . . . . . . . . . . . . 57
3.2 Asymptotic Chaining Efficiency for all Relevant System Re-
sponse Levels (Uniform and Normal Demands) . . . . . . . . . 80
List of Tables xiv
3.3 System Choice without Perfect Response . . . . . . . . . . . . 87
3.4 Sparse System vs. Full Flexibility: Comparison of Secondary
Production Costs (Asymmetric and Correlated System) . . . . 90
3.5 ACE Improvement for Upgrading System Response (Discrete
Uniform Demand) . . . . . . . . . . . . . . . . . . . . . . . . . 92
3.6 ACE Improvement for Upgrading System Response (Normal
Demand) . . . . . . . . . . . . . . . . . . . . . . . . . . . . . . 92
4.1 Asymptotic Chaining Efficiency for Various Levels of Produc-
tion Postponement and Partial Flexibility . . . . . . . . . . . 111
4.2 Mismatch Cost Values and Optimality Gaps for Flexibility-
Postponement Indifference Curves . . . . . . . . . . . . . . . . 116
4.3 Optimality Gap as Size Increases for 65% Postponement . . . 119
4.4 Optimality Gap as Size Increases for 70% Postponement . . . 120
4.5 Optimality Gap as Size Increases for 75% Postponement . . . 120
4.6 Demand Forecasts for Diving Products at O’neill Inc. . . . . . 122
4.7 Expected Mismatch Cost and Flexibility Efficiency for O’neill
Inc. . . . . . . . . . . . . . . . . . . . . . . . . . . . . . . . . . 126
4.8 Demand Forecasts for Women’s Parkas at Sport Obermeyer . 128
4.9 Expected Mismatch Cost and Flexibility Efficiency for Sport
Obermeyer . . . . . . . . . . . . . . . . . . . . . . . . . . . . . 129
4.10 Fragility for 2-Chain and 3-Chain under Single Link and Single
Node Disruptions for Various Levels of Demand Uncertainty . 134
List of Tables xv
4.11 Fragility for Long 3-Chain versus Short 3-Chain under Sin-
gle Link and Single Node Disruptions for Various Levels of
Demand Uncertainty . . . . . . . . . . . . . . . . . . . . . . . 135
4.12 Flexibility Efficiency for Two Ways to Add Capacity to Sym-
metric Systems Exposed to Supply Disruptions . . . . . . . . . 137
4.13 Flexibility Efficiency for Two Ways to Add Capacity to Asym-
metric Systems Exposed to Supply Disruptions . . . . . . . . . 139
1. INTRODUCTION
Since the 1980s, we have witnessed the advent of globalization and the
tremendous effects it has on world consumption and production. A quick
look at a BusinessWeek report [2] on the top 100 brands in 2007 reveals that
these brands already hail from twelve different countries around the world.
(See Table 1.1 for a partial listing.) According to the report, each of these
brands derives at least a third of its earnings outside its home country. This
tells us that increasingly, the world is moving towards a phenomenon of bor-
derless consumption. That is, for consumers, the world is becoming their
shopping mall. On the other hand, for manufacturers, the whole world is
becoming their customer.
With the said internationalization of market competition, firms nowa-
days need to build up the capacity for becoming competitive as a world-class
company. The most common solution has been to turn to outsourcing and
offshoring, essentially tapping into the production capabilities of factories, big
and small, all over the world. For example, many American and European
brands outsource their sourcing function to Hong Kong-based Li & Fung,
the world’s leading supply chain company who controls a network of over
10,000 production facilities scattered everywhere in places like China, Brazil,
the Czech Republic, Honduras, Mauritius, Mexico, Poland, South Africa,
1. Introduction 2
Country Brand(s)
United States Coca-Cola, Microsoft, Nike, Disney, Apple, Starbucks
Japan Toyota, Canon, Nintendo, Sony
Finland Nokia
Germany BMW, Siemens, SAP, Adidas, Nivea
France Louis Vuitton, AXA, L’Oreal, Hennessy, Chanel
South Korea Samsung, Hyundai, LG
Britain HSBC, Reuters, BP, Smirnoff, Burberry
Switzerland Nescafe, UBS, Nestle, Rolex
Sweden IKEA
Netherlands Philips, ING
Italy Gucci, Prada
Spain Zara
Tab. 1.1: Partial Listing of Top 100 Brands by Country
Zimbabwe, and countries in Southeast Asia [21]. On this phenomenon of
borderless manufacturing, Fung et al [24], [25] believe the trend is “to rip
the roof off the factory. In contrast to Henry Ford’s assembly line, where
all the manufacturing processes were under one roof, the entire world is our
factory.” Other than granting firms the ability to increase capacity through
global aggregation, this strategy also allows the firms to control and reduce
operating expenses as well as focus on improving their core businesses, such
as product design and marketing.
Another important trend is the fragmentation of consumer demand. In-
stead of catering to one big market with more or less homogeneous demand,
companies are beginning to see more niche markets with diverse tastes as
well as the emergence of variety-seeking consumer behavior. As this trend
becomes more prevalent, we see an increasing proliferation of product lines
as companies struggle to stay competitive. In the automobile industry, the
number of car models offered in the United States market has increased from
1. Introduction 3
195 (in 1984), to 238 (in 1994), to 282 (in 2004), and was projected to reach
330 by 2008 (cf. [54]). The same phenomenon can be observed in other
industries such as electronics, clothing, food products, and even services like
entertainment/media and education. As a result, demand uncertainty on a
per product basis increases and forecasting becomes more difficult.
Facing such an increased demand uncertainty as well as heightened mar-
ket competition, businesses can no longer rely on capacity, pricing, quality,
and timeliness alone as competitive strategies. One approach in recent years
that has proven effective is the use of flexible production facilities. In the
automobile industry, for example, companies are increasingly moving from
focused factories to flexible factories. According to a survey conducted in
2004, the plants of major automobile manufacturers in North America, such
as Ford and General Motors, are more flexible than their counterparts 20
years ago (cf. [53]). The survey shows that these flexible plants can produce
many more types of cars to cater to rapidly changing consumer demands
while the plant capacities have not changed very much. The kind of flexibil-
ity adopted in these plants is known as “process flexibility” in the operations
management literature.
1.1 Process Flexibility
“Process flexibility” can be defined as a firm’s ability to provide varying goods
or services, using different facilities or resources (cf. [32], [47]). Nowadays,
it has become a common strategy among players in the automobile industry
to employ pro cess flexibility in their production facilities [53]. This focus on
1. Introduction 4
process flexibility as a competitive strategy can likewise be observed in other
manufacturing industries, such as the textile/apparel industry [19] and the
semiconductor/electronics industry [43]. The value of flexibility also extends
to service industries, where firms have increasingly employed cross-trained
workers to provide more flexible services [30].
1 1
2 2
50
150
100
100
FacilitiesProducts
Dedicated System
1 1
2 2
50
150
100
100
FacilitiesProducts
Flexible System
Fig. 1.1: The Benefits of Process Flexibility
To illustrate the benefits gained from employing process flexibility, we
must first understand how a flexible production system works. Consider the
two systems in Figure 1.1. Both systems have two products and two facilities.
The demands of the products are random while the capacities of the facilities
are fixed at 100 units each. The system on the left is a dedicated production
system (also known as a focused factory) while the one on the right is a
flexible system. When demand for product 1 is low while demand for product
2 is high, the extra demand for product 2 is lost to the dedicated system and
the extra capacity of facility 1 is wasted. On the other hand, a flexible system
is able to recover an additional sales of 50 units due to its ability to produce
more products in each facility. This is the fundamental reason why process
flexibility has been an effective strategy in many industries. In an interview
with the Wall Street Journal [11], Chrysler Group CEO Thomas LaSorda
1. Introduction 5
disclosed that flexible production “gives us a wider margin of error.” With
regard to the value of process flexibility, he said, “if the Caliber doesn’t sell
well, the Jeep Compass and Patriot could take up capacity, and eventually
a fourth model will be built, too.”
The theoretical justification for the effectiveness of process flexibility
can be traced back to the early work of Eppen [20]. For a multi-location
newsvendor problem, he showed that the mismatch cost for a decentralized
system exceed those in a centralized system, and that the gap between these
two systems depends on the demand correlation. Indeed, a decentralized
system is analogous to a dedicated pro duction system, while the centralized
system corresponds to flexible production. Likewise, it makes sense that
process flexibility is most effective when product demands are negatively
correlated and least effective when demand correlation is positive.
It should be noted, however, that Eppen’s result on the benefits of con-
solidation or risk pooling is predicated on the assumption of full consolidation
or complete p ooling. In the context of process flexibility, we must have a fully
flexible production system where all facilities can produce all products for
the said theory to hold. In addition, most of the early works on process flex-
ibility examine the appropriate mix of dedicated versus flexible resources,
thus focusing only on fully flexible resources. Unfortunately, many compa-
nies realize that full flexibility typically comes at great expense, thus they
can only make limited use of these theories on full flexibility. This calls for
a new or extended theory of partial flexibility.
With most facilities capable of producing most products, one may over-
invest in process flexibility. On the other hand, when one has too little or
1. Introduction 6
no flexibility at all, this may result in a high level of lost sales. This be-
comes a question of striking a balance between flexibility and cost, which
can be restated as whether one can achieve the benefits of full flexibility at
an acceptable cost level. Jordan and Graves [32] show via simulation studies
that this is possible using the concept of a simple “chaining” strategy. Here,
a plant capable of producing a small number of products, but with proper
choice of the process structure (i.e., plant-product linkages), can achieve
nearly as much benefit as the full flexibility system. This concept is widely
believed to be true, and has been applied successfully in many industries. For
example, Chrysler CEO LaSorda has repeatedly mentioned the importance
of chaining in his interviews and speeches [35], while VP Frank Ewasyshyn
was recently inducted into the Shingo Prize Academy for his contributions to
flexibility and efficiency [1]. Jordan and Graves [32] also applied the chaining
strategy to General Motors’ production network.
To enhance our understanding of the progress in this research and to put
in perspective the contributions of this thesis, a thorough literature review
on process flexibility is provided in Section 1.1.1.
1.1.1 Literature Review
In the op erations management literature, there are two main streams of re-
search related to process flexibility. The first stream examines the trade-off
between flexible and dedicated resources. Fine and Freund [22] characterize
the optimal investment in flexibility (i.e. the optimal amounts of dedicated
and flexible resources) for a price-setting firm, where demand is modeled by
1. Introduction 7
a discrete probability distribution of k possible states that affect demand.
Van Mieghem [55] takes a critical-fractile approach to solving the optimal
flexibility investment for a price-taking firm, but for any arbitrary multivari-
ate demand distribution. Bish and Wang [10] extend van Mieghem’s work to
a price-setting firm facing different typ es of correlated demands.
The above studies, though, focus only on full flexibility; that is, all fa-
cilities can produce all types of products. Unfortunately, in practice, the
acquisition cost of full flexibility is usually too enormous to permit the re-
covery of adequate benefits. In response, a second stream of research lo oks
at different degrees of flexibility, and examines the value of these types of
process flexibility. The landmark study was by Jordan and Graves [32], who
introduced the concepts of “smart limited flexibility” and “chaining”. They
observe, through extensive simulation, that limited flexibility, configured the
right way, yields most of the benefits of full flexibility. Furthermore, they
claim that limited flexibility has the greatest benefits when a “chaining”
strategy is used. In the symmetric case where the (mean) demand and fa-
cility capacity are balanced and identical, a chaining configuration is formed
by enabling every facility to produce two products and every product to be
produced by two facilities, in a way that “chains” up all the facilities and
products. For a 10-facility, 10-product example, the expected sales gener-
ated from chaining is compared to that of full flexibility using numerical
simulation. The results show that chaining already achieves about 95% of
the benefits of full flexibility while incurring only a small fraction of the cost.
Figure 1.2 provides an illustration.
The theory developed and the insights gained from studying the sym-
1. Introduction 8
Facilities
Products
2 2
1 1
3 3
10 10
9 9
8 8
7 7
6 6
5 5
4 4
Facilities
Products
2 2
1 1
3 3
10 10
9 9
8 8
7 7
6 6
5 5
4 4
Fig. 1.2: Chaining is Almost as Good as Full Flexibility
metric case are then used to formulate principles and guidelines to address
the more sophisticated asymmetric case where facilities can have varying
capacities while product demands may follow arbitrary probability distribu-
tions. Here, Jordan and Graves follow similar ideas of adding more linkages
to the system such that the resulting structure forms a cycle (albeit not nec-
essarily a regular chain). In addition, they propose a probabilistic measure
(later called the JG index) that can be used for evaluating different flexibility
structures. Applying these concepts to General Motors’ production network,
they find that indeed a partially flexible system, if well designed, already
captures almost all the benefits of full flexibility.
Because the twin ideas of smart limited flexibility and chaining have
been well received, many researchers subsequently applied and examined
these strategies in various other contexts such as supply chains ([27], [10]),
1. Introduction 9
queuing ([7], [28]), revenue management ([26]), transshipment distribution
network design ([39], [58]), manufacturing planning ([34]) and flexible work
force scheduling ([18], [30], [57], [13]). For example, Graves and Tomlin [27]
extended the study to multi-stage supply chains and found that “chaining”
also works very well. Hopp et al. [30] observed similar results in their study
of a work force scheduling problem in a ConWIP (constant work-in-process)
queuing system. They compared “cherry picking”, where capacity is “picked”
from all other stations versus “skill-chaining” where workforce in each station
is cross-trained to perform work in the next adjacent station. They observed
that “skill-chaining” outperforms “cherry picking” and also that a chain with
a low degree (the number of tasks a worker can handle) is able to capture
the bulk of the benefits of a chain with high degree.
Another issue addressed in the literature is the search for effective in-
dices to measure the performance of flexibility structures (cf. [32], [27], [31],
and [17]). For example, Jordan and Graves [32] proposed a probabilistic in-
dex, which roughly measures the probability that unsatisfied demand from a
subset of products in a given flexible system would exceed that of a fully flex-
ible system. However, this index is usually very hard to compute if demands
are not normally distributed or they are correlated due to the complexity
of the joint probability distribution. This renders the index of limited use
especially in the case of correlated demands when such p erformance indices
are most needed. To overcome this problem, Iravani et al. [31] proposed a
new perspective on flexibility using the concept of “structural flexibility” and
introduced new flexibility indices. The indices are obtained by first defining
the “structural flexibility matrix” and then taking the largest eigenvalue as
1. Introduction 10
well as the mean of this matrix as flexibility indices. These indices are easy
to compute and are applicable to serial, parallel, open, and closed networks.
More recently, Chou et al. [17] introduced the Expansion Index, based on
the concept of graph expander. They define this index as the second smallest
eigenvalue of an associated Laplacian matrix. Numerical experiments show
that this index performs as well, if not better than the previous indices in
most of the problem instances considered.
Another group of studies tries to warn the community about some unac-
counted issues when employing process flexibility. Bish et al. [9] go beyond
just matching supply and demand as they study the impact of flexibility on
the supply chain. They show that in a 2 × 2 system, certain practices that
may seem reasonable in a flexible system can result in greater production
swings and higher component inventory levels, which will then increase op-
erational costs and reduce profits. To account for partial flexibility, Muriel
et al. [45] extend Bish et al.’s work to larger systems and obtain similar find-
ings. Brusco and Johns [13] present an integer linear programming model to
evaluate different cross-training configurations in a workforce staffing prob-
lem. In their model, they consider a case wherein a worker is 100% efficient
in his primary skill but only 50% efficient in his secondary skill. Under this
scenario, the value of skill-chaining may be significantly reduced due to the
efficiency lost in using secondary capacity. In this thesis, we also examine
issues and concerns not previously considered in the literature. At the same
time, we propose measures on how to mitigate the effects of these additional
factors. We defer this discussion to Section 1.2.
The previous works cited above present limited concrete analytical re-