High resolution x ray diffraction study of phase and domain structures and thermally induced phase transformations in PZN (4 5 9)%PT 6
Bạn đang xem bản rút gọn của tài liệu. Xem và tải ngay bản đầy đủ của tài liệu tại đây (2.92 MB, 21 trang )
104
Chapter 7
Rhombohedral Micro/Nanotwins and Thermally-induced Phase
Transformations in Unpoled PZN-4.5%PT
7.1 Introduction
The existence of the M phases remains a subject of much debate when the
adaptive phase model proposed by Viehland and coworkers [43-45] has pointed out
that the reported M reflections could indeed be those of micro- and nanoscale twinned
R and T domains instead. While direct evidence of nanotwin domains has only been
reported by TEM [49, 51, 52], support for the M phases (i.e., M
A
, M
B
, and M
C
) has
been elicited by high-resolution x-ray diffraction study [30-32, 34-36, 38-40, 66, 93].
The concept of nanotwin diffraction theory has been employed by Wang
[46-48] to explain the diffraction pattern produced by nanotwins in perovskite
ferroelectrics. The diffraction peaks of the nano-scale twin domains exhibit streaked
behavior and their interference cannot be fully explained by the conventional
diffraction theory, which perceived the diffraction pattern as that arising from the M
phases instead. The nanotwin diffraction theory has yet to be utilized to interpret the
complicated diffraction patterns of relaxor ferroelectric single crystals.
In this chapter, diffraction profiles of the R phase were projected onto the
105
RSM using micro/nanotwin diffraction theory. The projections can compared with the
experimental diffraction patterns obtained from the HR-XRD study of
[100]
L
×[010]
W
×[001]
T
PZN-4.5%PT single crystals.
7.2 Theoretical considerations of rhombohedral micro/nanotwin diffractions
Figure 7.1(a) illustrates a schematic domain configuration of an unpoled R
crystal structure with spontaneous polarization directed along eight <111>
pc
directions.
The four-fold degenerated R domains is shown in Figure 7.2(a). To understand how the
(002) diffraction pattern is affected by: (a) the four structural variants of the R structure,
i.e., r
1
, r
2
, r
3
, and r
4
, and (b) its domain size, the diffraction produced by the eight
<111>
pc
domain variants of the R phase are represented by means of the stereographic
projection technique shown in Figure 7.1(b).
When projected to the (002) plane, only four of the eight <111>
pc
domain
variants are relevant, as shown in Figure 7.2(a). This is because stereographic
projection does not distinguish domain variants of opposite polarization. In Figure
7.2(b), each variant diffraction is represented by circles of half-intensity contours.
Since the R phase of PZN-PT is elastically soft, individual variant diffractions broaden
as a result of residual stresses arising from the crystal growth process and accompanied
phase transformations during cooling of the crystal to room conditions. As shown in
106
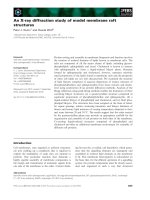
Figure 7.1 (a) Schematic domain configuration of an unpoled R crystal
structure with spontaneous polarization directed along eight
<111>
pc
direction. (b) Three dimensional illustration of a
stereographic projection of the unpoled R structure. In the two
dimensional plane, only the four <111>
pc
variants are projected.
[111]
[
1
1
1
] [
1
1
1
]
[
1
1
1
]
(b)
107
this figure, peak convolution would occur as a result of the small twin (or tilt) angle in
both the
ω
and 2
θ
planes among the four domain variants, giving rise to an extremely
broad diffraction as shown in Figures 7.2(c) and (d).
In addition to peak convolution, it should also be noted that the four-fold
degenerated R domains not only has a ∆
ω
component but also the 2
θ
tilt of (002)
component, a result of the polarization vectors along the eight <111>
pc
directions.
Since the high precision diffractometer used in the HR-XRD study only allows direct
(nearly untilted) diffracted beam in the 2
θ
plane to be detected, what actually detected
by the diffractometer are not the direct diffractions of the R variants but their
convoluted peak(s). In the actual mapping, the detected diffractions are restricted to
within the region of dotted lines. The resultant RSM pattern is given in Figures
7.2(b)-(d). As shown, only two convoluted diffractions could be detected by the
high-precision diffractometer used in the HR-XRD study. This is especially true for
small R tilt angle (i.e., 90º -
α
R
) and when the residual stress in the crystal is
sufficiently high. The projection of the convoluted peak(s) on (002) RSM is illustrated
in Figure 7.2(d).
Note that in the four-fold degenerated R domains may form twins of either a
{100}-type or {110}-type R twin plane. For R microtwins, the streaking effect is
minimum. The actual type of twins in this case could not be that easily identified. The
108
Figure 7.2 (a) Four of the eight <111>
pc
domain variants with tilt angle in both the
ω
and 2
θ
planes. (b) Each variant diffraction is represented by circles of
half-intensity contours. Individual variant diffractions broaden as a result
of residual stresses arising from the crystal growth process and
accompanied phase transformations during cooling of the crystal to room
conditions. The resultant RSM pattern is given in (b)-(d). In the actual
mapping, the detected diffractions are restricted to within the region of
dotted lines in (b). (d) The projection of the convoluted peak(s) on (002)
RSM.
(d) Convoluted peak
(c)
Diffracted signal
detected by HR-XRD
(b)
(a)
r
1
r
2
r
3
r
4
109
two different types of R microtwin domains thus give rise to identical diffraction
behavior on (002) RSM, as projected in Figure 7.2(d).
For R nanotwins, the 2θ diffraction position and the R tilt angle of the
four-fold remain unchanged. However, the diffractions become streaked in the
direction of the thinnest dimensions of the diffracting structure, i.e., normal to the twin
plane. The streak direction can thus be used conveniently to identify the type of the R
nanotwin domains. For instance, diffractions streaking along <100>
pc
crystal direction
indicate the presence of {100}-type R nanotwins (Figure 7.3); while those streaking
along the <110>
pc
indicate the {110}-type R nanotwins (Figure 7.4).
An extra peak joining the two parent nanotwin diffractions may occur as a
result of the constructive interference effect of the streaked behavior as discussed
earlier in Section 6.2.2. The resultant nanotwin diffractions for {100}-type and
{110}-type R nanotwins are illustrated in Figures 7.3(b) and 7.4(b), respectively. As
discussed above, only detected diffraction laid within the region of dotted lines could
be detected when the R nanotwins were performed with high-resolution diffractometer.
Figures 7.3(c) and 7.4(c) show the corresponding diffraction pattern on the (002) RSM
for the respective {100}-type and {110}-type R nanotwins, respectively. Figure 7.5(a)
shows the coexistence of both the {100}-type and {110}-type R nanotwins coexist and
their various diffractions are resolvable, while Figure 7.5(b) shows the case of the
110
Figure 7.3 (a) The constructive interference effect of the two parent streaked of
{100}-type R nanotwin diffractions. (b) The resultant nanotwin
diffractions for {100}-type R nanotwins. (c) The projection of such
extra peak joining the two parent nanotwins diffractions on (002)
RSM for the {100}-type R nanotwins. Traces of the twin type are
laid along the <100>
pc
direction.
(a)
(b)
∆
ω
(c)
111
Figure 7.4 (a) The constructive interference effect of the two parent streaked of
{110}-type R nanotwin diffractions. (b) The resultant nanotwin
diffractions for {110}-type R nanotwins. (c) The projection of such
extra peak joining the two parent nanotwins diffractions on (002)
RSM for the {110}-type R nanotwins. Traces of the respective twin
type are laid along the <110>
pc
direction.
(a)
(b)
(c)
112
Figure 7.5 (a) The projection of coexistence of the {100}-type and {110}-type
R nanotwins onto the (002) RSM. (b) The projection of the
coexistence of R micro- and nanotwins onto (002) RSM.
+
++
+
{100}-type R
nanotwins
{110}-type R
nanotwins
(a)
∆
ω
=
==
=
∆
ω
+
++
+
=
==
=
(b) Convoluted
peak
+
++
+
{110}-type R
nanotwins
{100}-type R
nanotwins
113
coexistence of R micro- and nanotwin domains on (002) RSM.
7.3 Evidence of rhombohedral micro/nanotwins in PZN-4.5%PT at room
temperature
Figure 7.6 show the HR-XRD (002) RSMs of unpoled (annealed)
(001)-oriented PZN-4.5%PT single crystals taken at room temperature (i.e., 25 °C).
Figure 7.6(a) shows a single extremely broad peak at 2
θ
≈ 44.58°. This peak is in
good agreement with the projection on (002) RSM as discussed in Figure 7.2(d). This
broad peak is thus the convoluted peak of the {100}-type and/or {110}-type R
microtwin domains, a result of the large diffraction width associated with the fine
domain structure and the extreme compliant nature of the R phase.
The diffraction pattern indicating possible coexistence of {100}-type and
{110}-type R* domains is shown in Figure 7.6(b), which was obtained from another
unpoled (annealed) PZN-4.5%PT single crystal. This figure shows three
distinguishable diffraction peaks, marked d
1
to d
3
, lying along the same Bragg’s
position (2θ ≈ 44.63º). This diffraction pattern agrees with the predicted projections of
R micro- and nanotwin mixture illustrated in Figure 7.5. The main R peak (d
2
) may be
assigned to that arising from {110}-type R nanotwin, while the remaining two off
ω
=
0º plane peaks (d
1
and d
3
) are those arising from the {100}-type R*.
114
Figure 7.6 Room temperature HR-XRD (002) RSM of unpoled
(annealed) PZN-4.5%PT single crystals. (a) shows a broad
convoluted R peak while (b) shows evidence of R micro- and
nanotwins. These diffraction patterns indicate the possible
coexistence of {100}-type and {110}-type R* (see text for
details).
(b)
(a)
115
7.4 Thermally-induced phase transformations in unpoled PZN-4.5%PT
7.4.1 Temperature dependent polarization characteristics
Figures 7.7(a) and (b) show the ZFH ε’ at various frequencies (0.5 – 500 kHz)
and the thermal current, respectively, during ZHH of unpoled (annealed) PZN-4.5%PT
single crystals. As seen in Figure 7.7(a), the ε’ increases fairly smoothly over the entire
temperature range from room temperature to T
max
≅ 157 °C, at which the ε’ is
maximum. The dielectric anomaly at T
max
shows a broad frequency dependence, which
has been attributed to the dynamic relaxation processes of polar nanoclusters [95, 96].
In contrast, the thermal current (Figure 7.7b), which are mainly associated with
temporal dynamics of spontaneous polarization, shows two anomalous responses over
the above temperature range, one over the temperature of 125-135 °C and the other of
140-150 °C.
7.4.2 Structural studies
The HR-XRD (002) RSMs as a function of temperature are given in Figure
7.8, in which the intensity contours are on log scale. At 25 ºC, the mapping of the
sample revealed a rather broad single peak with 2θ ≈ 44.58º (Figure 7.8a), being the
convoluted peaks of the four degenerated R domains (see Section 7.2 for details).
The R phase remained as the stable phase at 125 ºC (Figure 7.8b). At about
116
Figure 7.7 (a) ZFH ε’ and (b) ZFH J of unpoled (annealed) PZN-4.5%PT
crystal. The sample thickness is 1.0 mm. A broad-diffuse and
dispersive phase transition in ε’ not only gives rise to a range of
T
max
, but may mask the weak anomalies in the ε’ curves.
ε
'
(x10
4
)
0
1
2
3
4
5
6
7
(a)
R
C
T
max
T
R-T
(R*
+
T)
(T*
+
C)
T
C
Temperature(
o
C)
40 60 80 100 120 140 160 180 200 220
J (mA/m
2
)
-0.002
-0.001
0.000
0.001
(i)
126 128 130 132
140 145 150
(ii)
0.5 kHz
10
50
100
500
(b)
*
117
129 ºC, a splitting of the reflection at 2θ ≈ 44.68º with ∆ω ≈ 0.30° became evident in
the (002) RSM (Figure 7.8c), suggesting that some structural changes must have
occurred.
The observed pattern of peak splitting may arise from either of the two
following causes. Firstly, the diffraction may indicate the occurrence of a new M phase.
Table 6.1 gives the relationships between the m axes and the pc axes of the various M
phases and the O phase. Judging from the nature of splitting, these diffraction peaks
may be assigned to the M
B
-type phase. When referred to the pc coordinates, we have
for the M
B
system, c
pc
(≈ c
m
) < a
pc
= b
pc
(≈ (a
m
/2)
2
+ (b
m
/2)
2
) and that c
pc
, a
pc
, and b
pc
are all two-fold degenerated. This diffraction pattern is consistent with the diffraction
patterns shown in Figure 7.8(c), which shows clearly degenerated diffraction peaks of
c
pc
at 2θ ≈ 44.66º (∆ω ≈ 0.40º), while the b
pc
and a
pc
diffractions may be responsible
for the relatively broad convoluted peak at 2θ ≈ 44.46º. Alternatively, the diffractions
may arise from T*, as explained in Chapter 6. The two likely assignments of the
diffractions at 129 °C are hereafter referred to as (T+T*) or M
B
diffractions.
At 135 °C, in addition to the (T+T*)
or M
B
diffractions, a new diffraction
peak was detected. This new peak, at 2θ ≈ 44.66º and lying in the ω = 0° plane (Figure
7.8d), can be assigned to that of the (100)
T
diffraction. Our results thus suggest that the
(T+T*) or M
B
phases coexisted over the temperature range of 135-144 ºC. At 145 ºC
118
(Figure 7.8e), only two peaks at 2θ ≈ 44.66º and 2θ ≈ 44.50º were detected, both lying
in the ω = 0º plane. This indicates that the T phase is the dominant phase at this
temperature.
At 146 ºC (Figure 7.9f), several new diffraction peaks appeared. Figure 7.9(g)
is the mapping taken at 148 ºC at which the main T diffractions faded away. It is
evident that the new phase shows clear splitting of the peaks at 2θ ≈ 44.60° (with ∆ω ≈
0.30°) and 2θ ≈ 44.50° (with ∆ω ≈ 0.10°) but no observable splitting for the peak at 2θ
≈ 44.58°. Again there are two possible assignments for the new diffractions. The first is
that it may be a new M phase, which is likely a M
C
phase in this case. The M
C
phase
has <001>
pc
–type mirror planes and the various diffractions, when referred to the pc
system are characterized by c
pc
(≈ c
m
) >b
pc
(≈ b
m
) >a
pc
(≈ a
m
) with degeneracy in both c
pc
and a
pc
but not b
pc
[31, 32, 98, 99,
see also Table 6.1]. The various diffraction peaks in
Figure 6.3(g) may thus be assigned to that of a
pc
(≈ a
m
) at 2θ ≈ 44.66° with ∆ω ≈ 0.30°,
b
pc
(≈ b
m
) at 2θ ≈ 44.58° with ∆ω ≈ 0° (i.e., no degeneracy), and c
pc
(≈ c
m
) at 2θ ≈
44.50° with ∆ω ≈ 0.10°. The second assignment is that the ∆ω ≠ 0° diffractions are
those of the T* domains (see Chapter 6). The diffraction at 2θ ≈ 44.58°, in turn, can be
assigned to that of the C phase. On further heating to 155 ºC (Figure 7.8h), the various
diffraction peaks gradually coalesced into a single C peak located at 2θ ≈ 44.58°. At
160 ºC, only the C phase diffraction was detected (Figure 7.8i).
119
Figure 7.8 Temperature dependent (002) RSMs taken from fractured surface of
annealed PZN-4.5%PT crystal obtained at (a) 25 ºC, (b) 125 ºC, (c)
129 ºC, (d) 135 ºC, (e) 145 ºC, (f) 146 ºC, (g) 148 ºC, (h) 155 ºC,
and (i) 160ºC. The intensity contours are on log scale. The
PZN-4.5%PT undergoes a transformation sequence of
R*–(R*+T+T*)–T–(T+T*+C)–C upon heating.
(a) 25ºC: R* (b) 125ºC: R* (c) 129ºC: (T+T*)
(h) 155ºC: (T*+C) (i) 160ºC: C (g) 148ºC: (T*+C)
(d) 135ºC: (T+T*) (e) 145ºC: (T+T*)
(f) 146ºC: (T+T*+C)
120
To ascertain if the out-of-plane diffractions with ∆ω ≠ 0° in Figures 7.8(d)
and (f) are M diffractions or diffractions arising from T*, the observed phase
transformation sequence was compared with the thermal current signals. Note that the
R-M
A
and R-M
B
transformations, being of first-order [25, 42], would give rise to
anomalous responses in dielectric behaviors and thermal current signals should M
A
and
M
B
phases act as the intermediate phase between R-T transformation. Note also that
when the diffractions are those of the M phases, the deduced transformation path
should be R-M
B
-T-M
C
-C. In this case, four clear thermal current signals are expected
despite their relative strengths. Examination of Figure 7.7(b), however, revealed that
only two thermal current signals were detected. More interestingly, there was no
obvious thermal current signal over the temperature range from 150-170 °C, over
which the T-M
C
-C transformation occurred. This rules out T-M
C
-C being the
transformation path and renders strong support for (T+T*)-(T+T*+C)-C, or T-C being
the actual transformation path at higher temperatures.
Now, assuming the diffractions in Figure 7.9(d) pertain to that of M
B
-type
monoclinic phase. The expected transformation path is thus: R-M
B
-T-C, suggesting that
three thermal current signals are to be expected. As mentioned above, only two
thermal current signals were detected, ruling out this possibility.
The only option left is that the new diffractions in Figure 7.8(d) in fact
121
pertain to that of (T+T*), while that in Figure 7.8(g) pertain to those of (T*+C).
Should this be so, the expected transformation path is R*–(R*+T+T*)–T–(T+T*+C)–C,
or R-T-C for short. These deductions are consistent with the crystal group theory. As
shown in Figure 6.3, the M-C and M
B
-T phase transformations in piezoelectric are
forbidden [42, 94].The two thermal current signals thus correspond to the
R*–(R*+T+T*) and T–(T+T*+C), or R-T and T-C for short, transformations,
respectively.
Figure 7.9 shows the domain structures obtained by the PLM as a function of
temperature. At 25 ºC, the crystal exhibited complete optical extinction at only P/A =
45º (Figure 7.9a), indicating that the room temperature phase is the R phase. The R
phase remained as the stable phase upon being heated to 125 ºC. Above 127 ºC, a
gradual change in the extinction angle was observed (Figure 7.9b), suggesting that
some structural changes must have occurred. Above 135 ºC, scattered areas started to
exhibit extinction at P/A = 0
o
,
which may arise from the T phase (Figure 7.9c).
Above 145 ºC, scattered areas started to exhibit extinction at most P/A
angles, suggesting the occurrence of the C phase (Figure 7.9d). Above T
max
, the sample
exhibited a total extinction indicating the presence of the C phase only (Figure 7.9e).
It has been reported that R-T and T-C phase transformations are of first order
[25, 42] with accompanied dielectric anomalies notably for poled crystals [28, 100-
122
Figure 7.9 ZFH domain structures of annealed PZN-4.5%PT crystal observed
by the PLM at (a) 25 ºC, (b) 126 ºC, (c) 136 ºC, (d) 146 ºC, and (e)
154 ºC. The sample thickness is about 50
µ
m. The PLM
observation is consistent with the HR-XRD results.
(e) 154 °C P/A = 45°
P/A = 0°
P/A = 0°
(d) 146 °C
P/A = 45°
[010]
[100]
150 µm
(b) 126 °C P/A = 0°
P/A = 0° (c) 136 °C
P/A = 45°
P/A = 0° (a) 25 °C
P/A = 45°
123
102]. Despite so, the present work and other reported works in the literature [102] have
repeatedly shown that during ZFH, the ε’ of unpoled (annealed) bulk PZN-4.5%PT
crystal increases smoothly with temperature until T
max
with no obvious anomaly. This
observation suggests that for PZN-xPT crystals with low PT contents (say, x < 5%PT),
the strong dynamic relaxation processes associated with the polar nanoclusters can
easily mask the weak anomalies in the ε’ of the unpoled (annealed) material, giving
rise to the smoothly increasing ε’ curve observed. The slight difference in the
transformation temperature can be attributed to the different experimental set-up and
temperature controlling and monitoring devices used.
7.5 Summary of main observations
(a) The present work showed that the observed HR-XRD (002) RSMs of
PZN-4.5%PT single crystals can be understood from the micro- and nanotwin
diffraction theory of R phase in the material.
(b) For PZN-4.5%PT at room temperature, the {100}
R
diffractions manifest as an
extremely broad peak at 2
θ
= 44.58°-44.63° Bragg’s position, being the
convoluted peak of the 4 degenerated R microtwins. In addition to the extremely
broad convoluted R peak, streak representative of nanotwin diffractions have
also been detected. They arise from {100}-type and {110}-type R nanotwins in
124
the material.
(c) Experimental analysis involving polarization and structural characteristics
combined with the crystal group theory suggest that the PZN-4.5%PT undergoes
a phase transformation sequence of R*-(R*+T+T*)-T-(T+T*+C)-C, or R-T-C for
short upon heating.
(d) Both the R-T and T-C transformations occur over a range of temperature bounded
by a two-phase field involving T* domains, which are formed possibly as a
means to relax the associated transformation stresses in the crystal.