High resolution x ray diffraction study of phase and domain structures and thermally induced phase transformations in PZN (4 5 9)%PT 7
Bạn đang xem bản rút gọn của tài liệu. Xem và tải ngay bản đầy đủ của tài liệu tại đây (3.92 MB, 16 trang )
Chapter 8
Rhombohedral and Tetragonal Micro/Nanotwins Mixture and
Thermally-induced Phase Transformations in Unpoled
PZN-(6-8)%PT
8.1
Introduction
As mentioned in Chapter 7, while direct evidence of nanotwin domains has
only been reported by TEM [49, 51, 52], support for the M phases (i.e., MA, MB, and
MC) has been elicited by high-resolution x-ray diffraction study [30-32, 34-36, 38-40,
66, 93]. However, the reported evidence of M or O phase is still in dispute. Firstly, the
soft elastic constants of R phase which inherently infer a large piezoelectric distortion
would result in a strained or distorted R phase instead of the M phases [41]. Secondly,
Wang [47, 48] have pointed out that the reported M phases could indeed be a result of
volume average of the R and T micro- and nanotwin structures.
As described in Chapters 6 and 7, neither M nor O phase was detected in
upoled PZN-9%PT and PZN-4.5%PT single crystal. A purely R phase was evident at
room temperature in PZN-4.5%PT, while, a mixture phase of (R+T) is reported in
PZN-9%PT.
In this chapter, the phases and domain structures of unpoled PZN-PT single
125
crystals of compositions closer to the MPB, i.e., PZN-(6-8)%PT, are investigated by
means of HR-XRD and dielectric and thermal current measurements, to ascertain
whether or not M and/or O phases are present in these crystal compositions.
8.2
Room temperature phases of PZN-(7-8)%PT
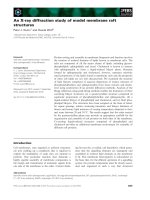
The room-temperature HR-XRD (002) RSMs of unpoled (annealed) (001)-
oriented PZN-7%PT and PZN-8%PT single crystals are shown in Figures 8.1(a) to (d).
Figures 8.1(a) and (c), taken at room temperature from PZN-7%PT and PZN8%PT respectively, show a single extremely broad peak at 2θ ≈ 44.64° Bragg’s
position. This single extremely broad R peak is in good agreement with the projection
on (002) RSM as discussed in Section 7.2. It is the convoluted peak of the {100}-type
and/or {110}-type R micro- and/or nanotwin domains, a result of the large diffraction
half-width associated with the fine domain structure and the extreme compliant nature
of the R phase. In addition to the broad R convoluted peak, a weak peak at 2θ ≈ 44.90°
could be detected in Figure 8.1(a). This peak is likely to arise from phases other than
the R. We shall discuss the origin of this weak peak later.
In contrast, four distinguishable diffraction peaks, marked d1 to d4, were
detected in the RSMs shown in Figures 8.1(b) and (d), which were taken from another
126
(a)
(b)
d2
d1
d3
(c)
Figure 8.1
d4
(d)
Room temperature HR-XRD (002) RSMs of unpoled (annealed)
(a) and (b) PZN-7%PT, and (c) and (d) PZN-8%PT single crystals.
127
sample of PZN-7%PT and PZN-8%PT, respectively, but of the same wafers as in
Figures 8.1(a) and (c). These 4 peaks lie in two different Bragg’s positions, with d1 and
d2 at 2θ ≈ 44.95º and d3 and d4 at 2θ ≈ 44.60º, all outside the ω = 0º plane. As
discussed in the previous chapter, peaks d3 and d4 can be assigned to the degenerated
{100}-type R* domains with ∆ω ≈ 0.1º, which agrees with the projection shown in
Figure 7.3(c). However, the sources for peaks d1 and d2 remain to be ascertained. The
Bragg’s position of the latter two peaks, being at 2θ ≈ 44.90-44.95º, strongly indicates
that they may be the (100)T diffractions. One plausible room temperature structure of
PZN-(7-8)%PT single crystal is thus a (R+T) phase mixture.
Alternatively, in the context of the more recent works in which M phases in
PZN-PT have been reported, one may also assigned the various diffractions in Figures
8.1(b) and (d) to that of a suitable M phase. Table 6.1 gives the relationships between
the m axes and the pc axes of the various M phases and the O phase. Judging from the
nature of splitting, these diffraction peaks in Figure 8.1(d), say, may be assigned to the
either the MB or MC phase. When referred to the pc coordinates, we have for the MB
system, cpc < apc ≈ bpc (≈ (am/2)2 + (bm/2)2) and that cpc, apc, and bpc are possibly
degenerated. As for MC phase, cm((≈ cpc) > bm (≈ bpc) > am (≈ apc) and while cm and apc
may be degenerated, bm does not. These predicted diffraction patterns are consistent
with the diffraction patterns shown in Figure 8.1(d). Three plausible assignments of the
128
diffractions shown in Figure 8.1(d) are thus: (i) (R+T) phase mixture, (ii) MB phase, or
(iii) MC phase. For the time being, we may assign the room temperature phase of the
unpoled PZN-8%PT as the “low-temperature” phase(s), or “LT” phase(s) for short.
To ascertain whether the room temperature phase in PZN-(7-8)%PT single
crystals is a (R+T) mixture or a true M phase, the following investigations were carried
out. The PZN-8%PT sample was heated up to higher temperatures and the RSMs were
taken to follow the changes induced by the thermal effect.
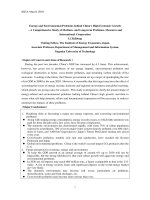
The results of the heating experiment are given in Figure 8.2. It shows that
there are no significant changes as the temperature was increased from 25 °C to about
80 °C. At 80 °C (Figure 8.2b), two new peaks superimposing onto the existing
diffraction peaks were noted on the (002) mapping, indicating the emergence of a new
phase.
With increasing temperature, the peaks gradually shifted towards the ω = 0°
plane. At 95 °C (Figure 8.2c), only two peaks at 2θ ≈ 44.37° and 2θ ≈ 44.86° remained.
The two peaks are identified as the T phase since both peaks lie in the ω = 0° plane.
The heating experiment showed that both the “LT” and T phases coexisted over the
temperature range of 80-95 °C (Figures 8.2b-c), while only T phase persisted above 95
°C (which remained the only phase detected up to 160 °C). The above result shows
that the “LT” phase transformed to the T phase upon heating. It thus cannot be the MB
129
phase as MB-T transformation is forbidden by the crystal group theory.
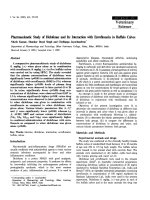
Figure 8.3 shows the result of another heating experiment with a PZN-8%PT
sample of predominantly R domains to begin with (Figure 8.3a). On heating to 90°C,
the characteristic M peaks at 2θ ≈ 44-90-45.0° appeared. As described earlier, since the
presence of MB has been ruled out, the peak must be diffractions from the MC phase if
the emerging new phase is indeed a true M phase. However, this again violates the
crystal group theory as the R-MC transformation is forbidden.
Ruling out both MB and MC phases being the viable phase, the peak(s) at 2θ ≈
44-90-45.0° must arise from the (100)T domains. We may thus conclude that “LT”
phase in PZN-8%PT (and hence PZN-7%PT as well) is a (R+T) phase mixture.
8.3
Nature of rhomboedral and tetragonal micro-/nanotwin mixture in PZN(7-8)%PT at room temperature
In the previous section, it has been shown that the (R+T) mixture exist in
PZN-(7-8)%PT at room temperature. However, careful examination of the roomtemperature RSMs revealed that only (100)T diffractions were detected but not the
(001)T diffractions. In this section, we shall examine the nature of the T phase in PZN(7-8)%PT and provide an explanation for the absence of the (001)T diffractions in these
crystal.
130
(a) 25ºC
(b) 80ºC
∆ω
Figure 8.2
(c) 95ºC
∆ω
∆ω
Temperature dependent (002) RSMs taken from fractured surface
of annealed PZN-8%PT crystal obtained at (a) 25 ºC, (b) 80 ºC,
and (c) 95 ºC. The intensity contours are on log scale.
131
(a) 25 ºC
(b) 90 ºC
(a)
(b)
Figure 8.3
Temperature dependent (002) RSMs taken from fractured surface of
another annealed PZN-8%PT crystal of predominantly R phase to
begin with at room temperature: (a) 25 ºC, and (b) 90 ºC. The
intensity contours are on log scale.
132
In the crystal growth process, the C-T-R phase transformations occur during
cooling of the crystal to room condition involving structural changes in the crystal.
Accompanying the phase transformations are volume and shape changes and
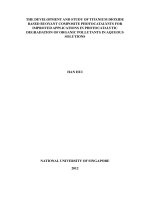
associated transformation stresses. The % of volume increase accompanying the T-R
phase transformation for PZN-PT single crystals has been estimated from the crystal
data obtained in the present work. The results are shown in Figure 8.4 as a function of
PT content. It is evident that at high PT contents (i.e., >7%PT), the % volume
expansion is quite significant, being ~1.0% at 8%PT; so must be the magnitude of
residual stresses produced by the transformation. Since the resultant overall volume
change increases with the amount of transformed R phase, with more and more
transformation events, the residual stress in the crystal builds up accordingly. This, in
turn, would retard further T-R transformation. Despite the R phase being elastically
soft, it is also possible for the cooling and transformation stresses to be relaxed via
twinning of both the untransformed T and the transformed R phases. Thus, at room
condition, the mixture of R and T micro- and/or nanotwins may coexist in PZN-PT
single crystals of PT contents closer to the MPB. It should be noted that the room
temperature Tσ manifested by the phase in this case is metastable which is stabilized by
the stresses present in the crystal.
Let us examine the likely R and T micro- and nanotwin domain configurations
133
1.1
1.0
0.9
∆V/V(%)
0.8
0.7
0.6
0.5
0.4
0.3
4
5
6
7
8
9
%PT
Figure 8.4
Volume expansion associated with T-R transformation in PZNPT single crystals. Note that the abrupt increase in volume
associated with the transformation when x > 0.07.
134
2
2
in perovskite structure. Since geometrically d R(110) = 2a R(100) ≈ a T(100) + c T(001) , the
interfaces between the R and T phases are likely to be the {110}R//{110}T type. The
likely domain configuration of R* and T* mixture with {110}R//{110}T interface is
depicted schematically in Figure 8.5, in which twinning serves to relax the residual
stresses in the perovskite structure. Note that micro- and/or nanotwin domains exist in
both the R and T phases although only those in the T phase (distinguished by the
direction of the arrows which are meant to denote the c-axis and hence polarization
direction of respective T domains) are depicted in this figure for purposes which will
clear later.
For diffractions from the {100}pc family planes, two different R/T domain
configurations are possible on the diffracting surface depending on the orientation of
the {110}R//{110}T interface. One such orientation is when the {110}R//{110}T
interface is lying at 45° to the (100)pc diffracting planes and the other when such an
interface is lying perpendicular to the (100)pc diffracting planes, as shown in Figures
8.6(a) and (b) respectively. Both figures show that under normal conditions, both
(100)T and (001)T diffractions should be present and that their intensity ratio should be
about 2 to 1 assuming equal probability of occurrence. So, why should only (100)T
diffractions be detected but not (001)T diffractions? To answer this observation, we
shall study below what fracturing may do to the population ratio of (100)T to (001)T
135
domains in the exposed surface layer.
It should be noted that upon fracturing, the constraints on T-R transformation
imposed by the transformed R phase are relaxed to various degrees depending on the
orientation of the {110}R//{110}T interface relative to the fracture (hence diffracting)
surface. This may be more vividly seen from Figure 8.7.
Figure 8.7(a) shows the case of perpendicular {110}R//{110}T interface
relative to the (100)pc diffracting plane. As evident from this figure, such a R/T domain
configuration will produce only R and (100)T diffractions. Note that on fracturing,
although the stress normal to the fracture surface is relaxed (for the surface layer), the
lateral constraint from the neighbouring R phases remains. In other words, most of the
residual stresses remain and so does the metastable T phase.
Figure 8.7(b) shows the case of slant {110}R//{110}T interface relative to the
(100)pc diffracting plane. Under unrelaxed conditions, diffractions from such a domain
structure will produce {100}R, (100)T and (001)T peaks. However, upon fracturing
along the (001) plane, the constraints for the T domains in the surface layer is
effectively relaxed, as shown in schematically in Figure 8.7(b). As discussed, the Tσ
phase is metastable stabilized by the residual stress in the material. Upon effective
relaxation of the residual stress by fracturing, the T phase in the surface layer is no
longer stable and would transform to the more stable R phase, as depicted
136
schematically in the figure. Thus, only R diffractions can be detected from the fracture
surface. This is especially true when only T microtwin domains are present in the
material. Due to the lack of penetration of the x-ray radiation used (of 8.048 keV in
energy and with an estimated penetration depth of only a few µm thick), the
underlying (001)T domains could not be detected by the x-ray. This would explain the
observation made in the present work.
One deduction from the above is that under the condition when T nanotwin
domains exist in the crystal and/or when the x-ray radiation used is of high energy, and
hence of larger penetration depth, it is likely that the (001)T could be revealed. In this
connection, it should be mentioned that in addition to the {100}R and the (001)T
diffractions, (100)T diffraction was detected in an “as-grown (unpoled)” PZN-6%PT
single crystal sample at 25 ºC. As shown in Figure 8.8, in addition to the {100}R peaks
at 2θ ≈ 44.60º (peaks d3 and d5 which are likely to arise from the {100}-type and
{110}-type R nanotwins as discussed in the previous section) and the (100) T
diffractions at 2θ ≈ 44.80º (peak d1), there is an extra diffraction at 2θ ≈ 44.47º (peak
d2). This new diffraction can be assigned to that of the (100)T domains. Note that both
the (100)T and (001)T diffractions lie out of the ω = 0º plane, suggesting that they are
both twinned diffractions. Note also that the intensity ratio of (100)T and (001)T
diffractions is about 2 to 1, which agrees with our previous discussion. The detection
137
Tσ
R
Tσ
[001]
R
R
[100]
Figure 8.5
[010]
Domain configurations of coexistence R* and T* domain structures.
The arrows represent the directions of the polar axis in T phase. The
two polar directions are joined by the {110}-type T* as indicated by
the red solid lines. The {110}R//{110}T interface are indicated the by
blue solid lines. Note that the Tσ phase is metastable in this case,
stabilized by the residual stress in the crystal
138
Figure 8.6
Geometry of the {110}R//{110}T interface (in blue) and domain
arrangement in the mixture of R and Tσ
phases. The
{110}R//{110}T interface is either (a) perpendicular to or (b) lying
at 45° to the (001) diffracting plane.
139
Figure 8.7
Schematic illustrations of the two-phase coexistence, R and Tσ
after fracturing. (a) For {110}R//{110}T interface perpendicular to
the (001) diffracting plane, the effect of stress relaxation produced
by fracture is not as significant. Thus, the Tσ phase remains
metastable and both R and (100)T can be detected from the
fractured surface. (b) For slant {110}R//{110}T interface, the
constraints produced by the neighbouring R phase in the crystal is
removed by fracturing, causing the Tσ phase to transformed to the
R phase in the surface layer. Thus, only R diffraction can be
detected from the fractured surface. For x-ray of low energy as in
the present work, the diffraction profile thus depends on the
penetration depth in the (see text for details).
140