High resolution x ray diffraction study of phase and domain structures and thermally induced phase transformations in PZN (4 5 9)%PT 9
Bạn đang xem bản rút gọn của tài liệu. Xem và tải ngay bản đầy đủ của tài liệu tại đây (4.31 MB, 11 trang )
157
Chapter 9
Revised Phase Diagram for PZN-PT and Other Observations
9.1 Revised phase diagram of PZN-PT system
The phase diagrams of PZN-PT system has been studied by earlier researchers.
The most remarkable feature of relaxor ferroelectric PZN-PT and PMN-PT single
crystals is that near the MPBs, the poled crystals exhibit excellent dielectric and
piezoelectric properties [1, 12, 89-91, 103, 104]. Despite decades of studies, there have
been debates about the nature of MPBs in relaxor single crystals. For instance, while
the MPB appeared in the first phase diagram of PZN-PT single crystal [10] has been
represented by a steep near-vertical boundary separating the R and T phases, more
recent PZN-xPT phase diagrams portray the MPB as a narrow region with 8% ≤ x ≤
11%, which is occupied by either the M or O phase [27, 59]. It is also interesting to
note that neither M nor O phases were observed in the present work in unpoled PZN-
(4.5-9)%PT single crystals (see Chapters 6 to 8 for details).
Based on the new results obtained in the present work, the phase diagram of
PZN-xPT system has been amended as shown in Figure 9.1. In the revised phase
diagram, the MPB consists of a (R+T) two-phase mixture spanning from x ≈ 0.09 to x
≈ 0.10 at room temperature. In this MPB region, both the R and the T phases are
158
thermodynamically stable phases of comparable Gibb’s free energies.
More interestingly, the present work has shown that due to the presence of
residual stresses in the crystal, the MPB, in effect, has been extended to much lower
PT level. For instance, a mixture of (R+T
σ
) phases are detected in PZN-(6-8)%PT at
room temperature, where T
σ
denotes metastable T micro- and nanotwin domains
stabilized by the residual stress in the crystal. This lower PT boundary of the extended
MPB is shaded in red in Figure 9.1 for easy reference.
It should be noted since the T
σ
phase is stabilized by the residual stress in the
crystal, on pulverizing the crystal into powders of sufficiently smaller particle sizes,
the residual stress is removed and the T
σ
phase may no longer be present. This may
explain why the extended MPB region is missing in the phase diagrams constructed by
earlier researchers who used the powder samples in their investigations.
In the present work, neither M nor O phase has been detected in unpoled PZN-
(4.5-10.5)%PT single crystals. Although out-of plane diffractions at ∆ω ≠ 0º were
detected, they have been found to arise from either R* or T* domains in the crystal.
The formation of micro- and nanotwin domains in perovskite structure may serve as a
means to relax the transformation stress in the crystal.
Another interesting finding of the present work is the (T+C) two phase
coexistence region at high temperatures, shaded in blue in Figure 9.1. This high
159
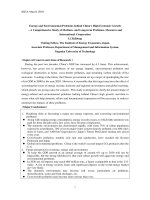
Figure 9.1 The revised phase diagram of PZN-PT system with extended
(R+T) MPB region. The extended (R+T) MPB region can be
divided into two regions. In the lower PT region, 6% ≤ x ≤ 8%,
the T phase is metastable, denoted by T
σ
.
The T
σ
is stabilized by
the residual stresses in the crystal. In the high PT region, 9% ≤ x
≤ 10.5%, both the R and T are thermodynamically stable at room
temperature. A two-phase (T+C) coexistence region was
detected at high temperature before the crystal transforms to a
single C phase.
- present work
- Ref. [10]
%PT
0 1 2 3 4 5 6 7 8 9 10
Temperature (
o
C)
40
60
80
100
120
140
160
180
200
R
C
T
R+T
σ
T+C
R+T
160
temperature (T+C) two-phase region has not been reported thus far.
It should be noted that over the entire MPB (standard + extended) region where
(R+T) coexist, the crystal exhibits extremely high piezoelectric properties. This
suggests that the presence of (R+T) phase mixture in the form of micro/nanotwin
domain structure play an important role to the superior electromechanical properties of
PZN-PT and other relaxor crystals.
9.2 Room temperature phase of PZN-PT single crystals of different PT contents
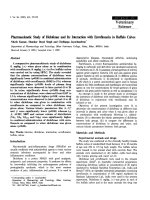
Figure 9.2 shows the (002) RSMs of PZN-(4.5-8)%PT single crystals at room
temperature (i.e., 25 °C) as a function of PT content. The mappings exhibit a broad
single diffraction peak lying in the
ω
= 0 º plane at 2θ ≈ 44.58º, ≈44.64º, and ≈44.65º
for PZN-4.5%PT, PZN-7%PT and PZN-8%PT, respectively. The dominant phase at
room temperature in these crystals is thus the R phase of micro/nanotwin structure.
Samples showing similar RSMs were ground into powder of <38 µm in
particle size and standard x-ray diffraction was performed on it. The result confirmed
that the room temperature phase for PZN-(4.5-8)%PT is indeed the R phase. The lattice
constants of the R phase was deduced from the peak positions of the powdered samples
as a function of PT content. The results are given in Table 9.1.
161
Table 9.1 Deduced lattice constants for the R phase at room conditions.
PT Content Lattice constant,
a
R
(Å)
Rhombohedral angle,
α
R
(degree)
0.045 4.061 89.94
0.07 4.051 89.97
0.08 4.058 89.88
Figure 9.2 HR-XRD diffraction patterns of unpoled (a) PZN-4.5%PT, (b)
PZN-7%PT, and (c) PZN-8%PT at room temperature. The a
R
and
α
R
of the respected crystals are given in Table 9.1
(a) PZN-4.5%PT (b) PZN-7%PT (c) PZN-8%PT
162
It is interesting to note from Figure 9.2 that the FWHM of the R for PZN-
8%PT is a lot smaller than the corresponding peak for PZN-(4.5-7)%PT crystals. As
discussed in Section 7.2, due to the tilting of the four degenerate R domain variants
both in the 2
θ
and
ω
planes, the actual diffractions of the domain variants are outside
the detection range of the high-resolution diffractometer used. In fact, the diffractions
detected in the HR-XRD are either: (a) the convoluted peaks of the {100}-type R
micro- and nanotwin if they lie out of the
ω
= 0° plane, (b) the convoluted peaks as
well as nanotwin diffractions (i.e., the constructive interference peak of the streaked
nanotwin peaks) of the {110}-type R nanotwins if the diffraction is of considerably
smaller FWHM and lies in the
ω
= 0°, or (c) the convoluted peak of both {100}-type
and {110}-type R micro- and nanotwin mixture if the diffraction is a very broad single
peak lying in the
ω
= 0° plane. The RSMs shown in Figure 9.2 strongly indicates that
with lower PT contents (i.e., 0.045 ≤ x ≤ 0.07), the R phase has a mixed micro- and
nanotwin structure of both {100}-type and {110}-type. In contrast, at high PT content
(i.e., x ≈ 0.08), the R phase is made up predominantly of {110}-type micro/nanotwin,
as manifested by the single R peak of much smaller FWHM.
9.3 Effect of poling on rhombohedral and tetragonal domains in PZN-PT
Figure 9.3(a) shows the (002) room temperature HR-XRD RSM of
163
PZN-4.5%PT and PZN-7%PT single crystals after optimal poling (at 0.5 and
0.7 kV/mm at room temperature, respectively). Both figures reveal a broad peak at 2θ
≈ 44.57-44.65° lying in the ω = 0º plane. This broad diffraction pertains to that of the R
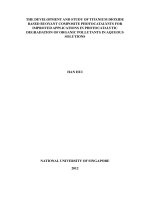
phase. On comparing to the unpoled samples (Figures 9.3c and d), the R (002)
diffraction of the poled samples appeared slightly elongated in certain crystal
directions. This, with the slight tilting of the R diffraction out of the ω = 0° plane
indicates that both crystals existed in a strained state as the result of poling induced
stresses. This finding is supported by the work Liu and Lynch [105], who noted that
the crystal is in a strained state after poling. This result shows that, on being optimally
poled, PZN-(4.5-8)%PT single crystals remain in the R state but possess a higher
residual strain. The effect of poling on the domain switching in PZN-9%PT is shown
in Figure 9.4. It shows that both the (R+T) phases coexisted prior to the E-field
application. Upon increasing the E-field along the (001)
pc
crystal direction, the
intensity of (001)
T
domains increased accordingly (Figure 9.4b). Meanwhile, the (100)
T
domains faded away and disappeared at E = 0.8 kV/mm (Figure 9.4c). The above
phenomenon can be understood readily. Since the poling field direction is normal to
(001)
pc
plane, switching of the (100)
T
domains to the (001)
T
domains is promoted by
the applied E-field, causing the crystal to become poled (i.e., with all the domains
aligned in the [001]
pc
E-field direction) eventually.
164
Figure 9.3 Room temperature (002) RSMs of annealed-and-optimally-poled
(a) PZN-4.5%PT and (b) PZN-7%PT single crystals. The poling
field is normal to the (001)
pc
diffraction plane. The intensity
contours are on log scale. (c) and (d) show the RSMs of their
unpoled counterparts for comparison purposes.
(a) PZN-4.5%PT (poled)
(c) PZN-4.5%PT (unpoled)
(b) PZN-7%PT (poled)
(b) PZN-7%PT (unpoled)
∆ω
∆ω
∆ω
∆ω
165
Figure 9.4 E-field dependent (002) RSMs taken at (a) 0 kV/mm, (b) 0.5
kV/mm, and (c) 0.8 kV/mm from the fractured surface of [001]-
poled PZN-9%PT. The E-field dependent RSM reveals an (R+T)–
T transformation under an E-field application along [001]
pc
direction. The intensity contours are on log scale.
(a) E = 0 kV/mm
(b) E = 0.5 kV/mm
(c) E = 0.8 kV/mm
166
9.4 Depolarization phenomenon in poled PZN-PT single crystals
In this work, dynamic depolarization behaviors and structural evolution as a
function of temperature below 140 °C were studied to provide a better understanding
of the depolarization and R-T phase transformation events in poled PZN-PT single
crystals. PZN-4.5%PT and PZN-7%PT single crystals, of [100]
L
×[010]
W
×[001]
T
in
orientation and 6
L
×2
W
×0.35
T
mm
3
in dimensions, were investigated. They were first
annealed at 257 °C for 1 h and then poled at room temperature to optimum properties
(i.e., at 0.5-0.7 kV/mm). Prior-poling-zero-field-heating (PP-ZFH) thermal current
measurements were carried out. The results are given in Figure 9.5. No apparent
current signals were detected until about 105 ºC for PZN-4.5%PT and until 92 ºC for
PZN-7%PT, above which a strong current signal was detected in both crystals. This is
followed by a string of much weaker current signals over the next 10 ºC to 15 ºC.
The above-described current activities indicate changes in the state of bound
surface and volume charges arising from changes in local domain polarizations [13-16,
71, 75, 79, 106, 107]. Three phenomena that could lead to the changes in local domain
configurations and the observed thermal current activities are: (a) depolarization
without R-T phase phenomenon, i.e., from poled R domains to depolarized R domains,
(b) merely R-T transformation, i.e., from poled R to poled T state followed by
depolarization in the T state on further heating, and (c) R-T phase transformation
167
accompanied by simultaneous depolarization, i.e., from poled R domains to
depolarized T domains. The “T
R-T
” of [001]-annealed-and-poled PZN-4.5%PT and
PZN-7%PT single crystals were determined conventionally from the ε’-temperature
plot shown in Figure 9.6, giving “T
R-T
” ≅ 105°C for PZN-4.5%PT and ≅95°C for PZN-
7%PT. A question arises as whether the “T
R-T
” determined by the above simple
technique corresponds to either depolarization or R-T transformation phenomenon, or
to both phenomena occurring simultaneously. (As it will be shown later, the “T
R-T
”
determined using the technique described above is in fact the lower bound value of the
rhombohedral-to-tetragonal temperature, hereafter referred to as T
R-T
(L)).
The poled samples were further fractured to expose the relatively strain-free
(001) surfaces for HR-XRD measurements. Figure 9.7 gives the (002) RSMs of [001]-
annealed-and- poled PZN-4.5%PT in the region of 100-135 ºC, while Figure 9.8 shows
the same but for poled PZN-7%PT in the region of 105-115 ºC. The diffractions at 2θ ≈
44.50-44.60° are the the main R peak in both crystals. In addition to this main peak,
indications of possible T diffractions (at 2θ ≈ 44.45° and 2θ ≈ 44.60° for PZN-4.5%PT
and at 2θ ≈ 44.83° for PZN-7%PT) could be vaguely detected when the samples were
heated to about 100-105 ºC. The R-T transformation process continued over the next
10 to 35 ºC. Only the T phase was detected at 135 ºC for PZN-4.5%PT (Figure 9.7c)
and at 115 ºC for PZN-7%PT (Figure 9.8c). The present work indicates that the R-T