High resolution x ray diffraction study of phase and domain structures and thermally induced phase transformations in PZN (4 5 9)%PT 10
Bạn đang xem bản rút gọn của tài liệu. Xem và tải ngay bản đầy đủ của tài liệu tại đây (1.45 MB, 11 trang )
168
transformation occurs over a range of temperature involving concurrent formation of
R* and T* domains.
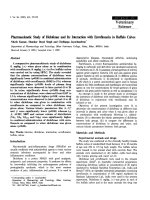
The effect of heating to higher temperature on the dielectric behaviour and
the room temperature piezoelectric properties after each heating-cooling cycle were
then investigated. The results showed that, for PZN-4.5%PT, perceptible sign of
dielectric hysteresis loop could be noted (Figure 9.9) and that the resultant room
temperature piezoelectric properties (i.e., dielectric constant (K
T
)
and
electromechanical constant (k
31
)) started to degrade after the sample was heated above
105°C (Figure 9.10). From this figure, the T
DP
of PZN-4.5%PT is estimated at about
105°C above which perceptible property degradation begins. The T
DP
of PZN-7%PT
was determined similarly, giving T
DP
≅ 95 °C.
The T
DP
values for PZN-4.5%PT and PZN-7%PT determined as described
above agree with the T
R-T
(L) obtained from the first anomaly in ε’ given in Figure 9.6.
It also corroborates with our HD-XRD results to within 10 °C. As shown in Figure
9.7(b), emergence of (100)
T
domains were noted at about 105 °C. The emergence of
(100)
T
domains not only indicates R-T transformation but also concurrent thermal
depolarization of the crystal. Should R-T transformation occur without thermal
depoling, as stated in case (b) above, then only (001)
T
domains would be detected in
the (002) mappings instead. This is because in the poled condition, c-axis hence (001)
T
169
J (mA/m
2
)
-2
-1
0
1
2
3
4
a)
100 110 120
Temperature (
o
C)
40 60 80 100 120 140 160 180 200 220
J (mA/m
2
)
-1
0
1
2
80 90 100 110 120
b)
Figure 9.5 PP-ZFH J of the [001]-annealed-and-poled (a) PZN-4.5%PT
and (b) PZN-7%PT single crystals.
170
Figure 9.6 PP-ZFH ε’ curves of the [001]-annealed-and-poled PZN-4.5%PT
and PZN-7%PT single crystals from which the “T
R-T
” was
determined from the first anomaly.
Temperature (
o
C)
50 100 150 200
ε
' (x10
4
)
0
1
2
3
4
5
T
R-T
(L)
T
R-T
(L)
PZN-7% PT
PZN-4.5%PT
171
Figure 9.7 Temperature dependent (002) RSMs taken from fractured surfaces
of the [001]-annealed-and-poled PZN-4.5%PT single crystal: (a)
100 ºC, (b) 125 ºC, and (c) 135 ºC. The intensity contours are in
log scale. T
#
indicates the vague T diffractions. T
NT
denotes the T
at ∆ω ≠ 0º.
(a) 100ºC: R*+T
#
(c) 135ºC: T+T*
(b) 125ºC: R*+T+T*
172
Figure 9.8 Temperature dependent (002) RSMs taken from fractured surfaces
of the [001]-annealed-and-poled PZN-7%PT single crystal: (a)
105 ºC, (b) 110 ºC, and (c) 115 ºC. The intensity contours are in
log scale. T
#
indicates the vague T diffractions. T
NT
denotes the T
at ∆ω ≠ 0º.
(a) 105ºC: R+T
#
(b) 110ºC: R+T
#
(c) 115ºC: T+T*
173
Figure 9.9 Dielectric hysteresis behaviors of [001]-poled PZN-4.5%PT
recorded during the heating-cooling cycles to (a) 100 ºC, (b) 105 ºC,
(c) 115 ºC, and (d) 125 ºC, respectively. After heating to 105 ºC,
PZN-4.5%PT showed clear signs of hysteresis on cooling to room
temperature. Above this temperature, the area of the dielectric
hysteresis increases with increasing heating temperature. The
heating and cooling rate is 1.5 ºC/min.
ε
' (x10
4
)
ε
' (x10
4
)
0
1
2
(a) 100
o
C
Temperature (
o
C)
20 40 60 80 100 120 140
ε' (x10
4
)
0
1
2
3
(d) 125
o
C
(b) 105
o
C
ε
' (x10
4
)
0
1
2
0
1
2
3
(c) 115
o
C
174
Figure 9.10 (a) K
T
and (b) k
31
of four plate samples of [001]-poled PZN-
4.5%PT taken at room temperature after cooling from the
temperatures indicated on the x-axis. Both the K
T
and k
31
of
PZN-4.5%PT started to degrade after it was heated to 105 ºC.
K
T
(x10
3
)
2
4
6
(a)
Temperature (
o
C)
20 40 60 80 100 120 140
k
31
0.2
0.4
0.6
(b)
175
domains are parallel to the E-field direction which is normal to the fractured surface
being x-rayed.
Our results thus indicate that thermal depolarization occurs with the
emergence of R-T phase transformation in PZN-PT single crystals, giving T
R-T
(L) ≅
T
DP
≅105-110 °C for PZN-4.5%PT and ≅90-100 °C for PZN-7%PT. These results,
including the upper bound values of T
R-T
, i.e., T
R-T
(U) or the temperature at which
complete R-T transformation was detected from our HR-XRD studies, are summarized
in Table 9.2. The slight difference in the various temperature values can be attributed
to the different temperature measurement instruments used in the tests.
In summary, the R-T transformation in relaxor single crystals occurs over a
temperature range, manifested by the coexistence of R* and T* domains, a string of
thermal current signals, and continued degradation of K
T
and k
31
. The T
R-T
determined
from the conventional ε’-temperature curve corresponds to T
R-T
(L), which marks the
beginning of R-T phase transformation with concurrent thermal depolarization. The T
R-
T
(L) can thus be taken as the T
DP
of the crystal above which perceptible property
degradation begins. Thermal current and HR-XRD results suggest T
R-T
≅ 100-135 °C
for [001]-annealed-and-poled PZN-4.5%PT and 95-115 °C for [001]-annealed-and-
poled PZN-7%PT single crystals.
176
Table 9.2 T
DP
, T
R-T
(L),
and T
R-T
(U) of [001]-poled PZN-PT single crystals
PT (%) T
max
(
o
C) T
DP
(
o
C) T
RT
(L) (
o
C) T
RT
(U)(
o
C)
[a] [b] [a] [c] [d] [c] [d]
4.5 ≅155 ≅105 ≅105 ≅107 ≅100 ≅120 ≅135
7 ≅165 ≅95 ≅90 ≅92 ≅105 ≅115 ≅115
[a]
Determined from the ε’-temperature plot of [001]-poled crystals. T
R-T
(L) is the
temperature corresponding to the first dielectric anomaly of the plot; T
max
is the
temperature at which the ε’ is at its maximum.
[b]
Determined by means of the temperature cycling tests of Honoso et al. [77, 78] and
Rajan et al. [104] T
DP
is defined as the temperature above which perceptible
degradation of dielectric and electromechanical properties begins.
[c]
Determined from the thermal current density data of [001]-poled crystals.
[d]
Determined by means of HR- XRD results.
177
9.5 Summary of main observations
(a) A revised phase diagram for the PZN-PT system has been constructed. Two new
evident features of this revised phase diagram are: (a) the expanded (R+T) two-
phase MPB region, and (b) a (T+C) two-phase region at high temperature before
the crystal transforms completely into the single C phase.
(c) The expanded (R+T) MPB region can be further divided into two regions. In the
lower PT region, 0.06 ≤ x ≤ 0.08, the T phase is metastable stabilized by the
residual stress in the crystal. In the high PT region, 0.09 ≤ x ≤ 0.10, both the
(R+T) phase are thermodynamically stable phases at room temperature.
(d) The FWHM suggests that with lower PT contents (i.e., 0.045 ≤ x ≤ 0.07), the R
phase has a mixed micro- and nanotwin structure of both {100}-type and {110}-
type. At high PT content (i.e., x ≈ 0.08), the R phase is made up predominantly of
{110}-type micro/nanotwin, as manifested by the single R peak of much smaller
FWHM.
(e) In lower PT contents (i.e., 0.045 ≤ x ≤ 0.07), the room temperature R phase of
poled crystals is under strained in which the structure appeared to elongate along
a certain crystal direction on comparing to the unpoled samples of broad R phase.
The strained state of the poled crystals is the result of poling induced stresses in
the crystals.
178
(f) In the event of PP-ZFH in PZN-(4.5-7)%PT, the T
R-T
occurs in a temperature
range of 10-35 ºC. The beginning of R-T transformation with concurrent thermal
depolarization shows perceptible property degradation. This suggests that the T
R-
T
(L) corresponds to the T
DP
. Thermal current and HR-XRD results suggest T
RT
≅
100–135 °C for [001]-poled PZN-4.5%PT and ≅90–115 °C for [001]-poled PZN-
7%PT.