Applications of electrospinning and supercritical carbon dioxide foaming techniques in controlled release and bone regeneration 2
Bạn đang xem bản rút gọn của tài liệu. Xem và tải ngay bản đầy đủ của tài liệu tại đây (1.72 MB, 28 trang )
Chapter 3 32
CHAPTER 3
Three-Dimensional Fibrous PLGA/HAp Composite Scaffolds
for Bone Morphogenetic Protein-2 (BMP-2) Delivery
†
3.1 Introduction
Bone fracture is a common form of injuries that bring great inconvenience to victims.
Bone grafting, as a common form of bone treatment, is done by transferring bone tissue
from the donor site to the fractured site before adequate physiological treatment
facilitates bone healing. For autologous bone treatment, the bone tissues are usually
transferred from the iliac crest of the patient’s pelvis (Swan and Goodarce, 2006). While
the advantages of autologous bone treatment may include easy access of donor site
without requiring the reposition of the patient as well as very low risks of infectious
diseases, post-operation complications have been reported to be as high as 15% (Swan
and Goodarce, 2006; Mischkowski et al., 2006). Furthermore, the donor site may not be
able to provide sufficient bone tissue to the injury site (Huang et al., 2005). Other
implications of grafting including severe pain, persistent aching, scarring and infection
have also been reported (Swan and Goodarce, 2006; Huang et al., 2005).
Fortunately, there are less painful and risky alternatives to bone treatment. A group of
proteins, known as bone morphogenetic proteins (BMPs), are known to facilitate bone
†
This chapter highlights the work published in H. Nie, B.W. Soh, Y.C. Fu and C.H. Wang. Three-
Dimensional Fibrous PLGA/HAp Composite Scaffold for Bone Morphogenetic Protein-2 Delivery.
Biotechnol. Bioeng. 99 (1), 223-234. 2008b.
Chapter 3 33
healing without transferring bone tissues. By inducing marrow derived messenchymal
stem cells (MSCs) to undergo chondroblastic and osteoblastic differentiation, BMPs can
induce bone regeneration in vivo (Saito et al., 2005). Among this group of proteins, BMP-
2 has been shown to induce healing in segmental bone defects. Aebli et al. (Aebli et al.,
2005) and Saito et al. (Saito et al., 2005) reported that BMPs improve bone regeneration
in vivo.
Over past years, many release dosage forms have been developed for drug or protein
delivery, like nanoparticle and microsphere. However, one common problem is that the
existence of a large burst over a narrow time period during the early stage of release. In
view of this problem, a new type of scaffold is needed urgently, especially for bone
regeneration to overcome this challenge, because nanoparticles and microspheres are not
suitable due to the non-ideal release profile and their fluidity as well which hinders them
from localizing themselves and giving new bone tissues enough support. Fiber is chosen
in the present study as the release dosage form because of its more favourable release
properties and morphology. Normally, a microsphere’s effectual release course can only
sustain less than 30 days, which is far from enough for bone regeneration. Fiber has much
lower release rate of drug or protein than microsphere because of its smaller
surface/volume ratio (Wei et al., 2006). Moreover, compared with microsphere,
compacted fibrous scaffold can give cell stable three-dimensional growth environment
and provide newly generated bone good support. In this project, electrospinning (Kenawy
et al., 2003) is employed to fabricate fibers due to its flexibility of operations and the
Chapter 3 34
fiber diameter can be easily controlled by changing operation parameters such as voltages,
polymer concentrations and organic/aqueous mixture composition.
Hydroxylapatite (HAp), which is a major component of the bone, can be used as a
subsidiary in the bone generation. HAp implants exhibit high mechanical strength and
good biocompatibility. In addition, HAp has the added advantage of being able to bond
directly to the bone since both of them have similar chemical structures. Despite the
above qualities, HAp is usually not used alone as its brittle nature creates difficulties in
fabricating the transplant block to the exact shape of the bone defect configuration
(Rebecca and Wozney, 2001). A study by Takaoka et al. demonstrated that there is a lack
of bone healing when HAp is used alone as a carrier for BMP-2 (Takaoka et al., 1988).
The objective of the research project is to conduct an in vitro study of recombinant BMP-
2 encapsulated in fibrous scaffolds by investigating the effects of HAp content and the
different methods of protein loading on the biological and physical characteristics of the
micro-fibers fabricated using the electrospinning method. The physical characteristics
investigated are the surface morphology, thickness, crystallinity of HAp and residual
DCM content. The biological characteristics investigated are the cell attachment and
cytotoxicity of the fibrous scaffolds. Towards the end of this study, the protein
encapsulation efficiency, the in vitro release profile of the protein, the probability of
protein denaturation were also investigated.
Chapter 3 35
3.2 Materials and methods
3.2.1 Materials
Recombinant human bone morphogenetic protein-2 (rhBMP-2) (E. coli expressed, Cat.
No. 355-BEC/CF) and its enzyme-linked immunosorbent assay (ELISA) kit were
purchased from R&D Systems, Inc. (Minneapolis, US). Poly (
D,L
-lactide-co-glycolide)
(PLGA) (Lot Number W3066-603 with L/G ratio 50:50, IV 0.57 and MW 51000) used in
the experiment was manufactured by Alkermes Controlled Therapeutics II, (OH, US) and
purchased from Lakeshore Biomaterials (AL, US). Dichloromethane (DCM) was
manufactured in Tedia Company Inc. (Fairfield, Ohio, US). Hydroxylapatite (HAp)
nanoparticles of 100nm were purchased from Berkeley Advanced Biomaterials Inc.
(Berkeley, CA, US). Phosphate Buffer Saline (PBS) buffer used for in vitro release study
was bought from Sigma Aldrich containing 0.1M sodium phosphate, 0.15M sodium
chloride, pH 7.4. Dulbecco’s Modified Eagle Medium (DMEM), the cell culture medium
in the experiment, was supplemented with 4mM-glutamine, 4.5g/L glucose, 25mM
HEPES buffer, 10% fetal bovine serum (Gibco), 10U/mL penicillin G sodium, 10 mg/mL
streptomycin, 25 mg/mL amphotericin B as Fungizone (Gibco) and 100mg/mL L-
ascorbic acid from Sigma-Aldrich, Oakville (Ontario, Canada) and the cells were
extracted using trypsin-EDTA. Human marrow derived messenchymal stem cells
(hMSCs) were purchased from Cambrex Bio Science Walkersville, Inc. (Newington, NH,
US) and the PreMix WST-1 Cell Proliferatiom Assay System was purchased from Takara
Bio Inc. (Otsu, Shiga, Japan).
Chapter 3 36
3.2.2 Preparation of fibrous scaffolds
In all the experiments of the present work, the fibers were essentially fabricated from
homogeneous emulsions formed from the sonication of organic and aqueous mixture.
Table 3.1 summarises the composition of the emulsion of the four different experimental
cases 1-4 and the fibrous scaffolds fabricated are named F1-F4 respectively.
Table 3.1 Compositions of emulsions for preparing different scaffolds F1-F4
Organic Phase Aqueous Phase Experimental
Case
Scaffold
DCM PLGA HAp BMP-2
1 F1 10mL 3g 0mg
5μg
2 F2 10mL 3g 150mg
5μg
3 F3 10mL 3g 300mg
5μg
4 F4 10mL 3g 150mg 0
*
*
For F1-F3, the BMP-2 solution was added directly into the aqueous fabrication solution for
electrospinning. For F4, the BMP-2 solution was not added directly into the aqueous fabrication
solution. Instead, the protein was added to each fibrous scaffold sample of F4 after scaffold was
fabricated and dried for 3 days using freeze dryer.
Preparation of organic phase
In each experimental case, a 30% wt/vol PLGA polymer solution using DCM as the
solvent was prepared by dissolving 3g PLGA into 10 mL of DCM. The resultant mixture
was agitated by applying vortex until a clear, homogeneous organic phase was formed. In
order to compare the effect of polymer concentration on fiber morphology, fibers using
10% and 20% PLGA/DCM solutions were also prepared.
Chapter 3 37
Preparation of aqueous phase
In the experimental cases F1-F4, 2 vials of BMP-2 of 10μg were dissolved in 90μL of
4mM hydrochloric acid (HCl) each and mixed well to produce a homogeneous BMP-2
solution. In each of the experiments for case 1- case 3, 50μL BMP-2 solution containing
5μg of the protein was dissolved in deionised water and mixed well with specified weight
of HAp nanoparticles to give 800μL of homogeneous aqueous suspension.
For experimental case 4, BMP-2 solution was not added directly into the aqueous
solution. Instead, the protein was loaded from a diluted BMP-2 solution (by 20 folds)
using 50μL of the original BMP-2 solution with 750μL of deionised water. All the
solution would then be evenly added to the blank (meaning no encapsulation of BMP-2)
F4 scaffold prepared beforehand. To ensure that the viscosity of the emulsion is not
affected by the organic-aqueous ratio, the volume of deionised water (HAp suspended
without BMP-2) mixed with organic solution in experimental case 4 is 800μL to keep the
same ratio 10:0.8 as in case 1-3.
Fabrication of fibrous scaffolds
After adding the aqueous and organic phases together, the mixture was sonicated for 30-
40 seconds and the resultant emulsion was transferred to a 10 mL glass syringe (MICRO-
MATE interchangeable 10cc hypodermic syringe, Popper & Sons, Inc., New Hyde Park,
NY. US) fitted with a 29-g needle and set up in the elecontrospinning apparatus. The
flow of polymer solution from the syringe into the spinneret (diameter 340 mm) was
Chapter 3 38
controlled by a programmable syringe pump (KD Scientific, Holliston, MA, US).
Scaffolds were electrospun at about a voltage difference 10 kV with a solution flow rate
of 5mL /h. The spinneret (anode) was fixed at about 15 cm above the aluminium-covered
rotating collection drum (cathode). The syringe was loaded into the syringe pump and
aluminium foil was wrapped around the spinning motor to collect the fiber samples.
3.3 Characterization of scaffolds
3.3.1 Physical characterization
Morphology of fibrous scaffolds
Field emission scanning electron microscopy (FESEM, JSM-6700F, JEOL Technics Co.
Ltd, Tokyo, Japan) was employed to study the surface morphology of the fibers produced
in each experiment.
Differential scanning calorimetry (DSC)
Differential scanning calorimetry (DSC) can be employed to determine the amount of
crystalline structure within the microfibers as well as the effects of HAp concentration on
the glass transition temperature and the decomposition temperature of PLGA. The sample
was heated from 30
°
C to 400
°
C at a constant temperature increment of 10
°
C/minute and
purged with nitrogen gas at 30 mL/min.
X-ray diffractrometry (XRD)
The HAp nanoparticles or fiber sample were placed in a sample holder and the surface of
the sample was flattened. Next, the sample was placed in the XRD equipment
Chapter 3 39
(SHIMADZU, Tokyo, Japan). A diffraction range of 10-35
°
(2θ) was selected and the
XRD analysis was carried out at 2
°
/min.
3.3.2 Encapsulation efficiency (EE) determination
The encapsulation efficiency (EE) of the BMP-2 in the scaffolds is defined as the
percentage of the actual BMP-2 loading to the total (theoretical) amount of BMP-2
loading. In the EE analysis, about 5mg of each scaffold was dissolved in 1 mL of DCM
and 5 mL of PBS (pH 7.4) was added subsequently. The mixture was vortexed for 5 min
to extract BMP-2. Subsequently the system underwent centrifugation using a Hettich
Zentrifugen system (Universal 32R, Andreas Hettich GmbH & Co KG,
Tuttlingen, Germany) at 9000 rpm for 20 min to separate the oil and water phases. At the
same time, HAp nanoparticles settled to the bottom of tubes. The water phase was then
carefully collected and kept frozen at -20
°
C until it was analyzed for BMP-2
concentration using the ELISA BMP-2 Immunoassay kit mentioned above. The
encapsulation efficiency of the BMP-2 in the fibers is the ratio of the actual amount of
BMP-2 loaded into the fibers to the theoretical amount of BMP-2 loaded (Xie and Wang,
2005) by the following equation:
%100
W
WWW
W
V C
EE
2-BMP
HApPLGA2-BMP
sample
water2-BMP
×
+
+
×
×
=
(3.1)
where C
BMP-2
is the BMP-2 concentration in the water phase of extraction; V
water
is the
volume of water phase of extraction; W
sample
is the weight of each scaffold sample used
for EE analysis; W
BMP-2
, W
PLGA
and W
HAp
are the weights of BMP-2, PLGA and HAp
used in the scaffolds fabrication process respectively.
Chapter 3 40
3.3.3 In vitro release studies
The in vitro release of BMP-2 was carried out over a period of 60 days and the
cumulative release curve can be plotted. Approximately 25mg of microfiber samples
made from each experiment were prepared and each of them was added to a tube with
5mL PBS, the release medium in the experiment. The resultant mixture was placed in an
orbital shaker bath (GFL® 1092) at 37
°
C, 120rpm. 1 mL of sample mixture was
extracted at specific intervals (16h, days 1, 2, 3, 5, 7, 10, 12, 14, 16, 19, 23, 27, 30, 33, 36,
39, 42, 45, 48, 51, 54, 57 and 60) from each test tube. 1 mL of PBS solution was then
added to each mixture to make up 5 mL again and all the mixtures were incubated in the
orbital shaker bath again before the next set of sample mixtures were extracted. The
ELISA kit was used to test the concentrations of BMP-2 inside the PBS solutions The
optical density of each well was determined using the micro plate reader (Tecan Trading
AG, Switzerland), while setting the wavelength to 450nm with correction wavelength of
570nm.
3.3.4 Protein integrity and secondary structure check
Continuous Native-polyacrylamide gel electrophoresis (continuous Native-PAGE)
To evaluate the effects of fabrication process on the molecular integrity and biological
activity of BMP-2, in vitro release sample was centrifuged and the supernatant was
analyzed by Native-PAGE to determine the integrity and conformation of BMP-2. In
order to avoid stacking-induced aggregation, a continuous buffer system was used. The
electrophoresis buffer with pH 7.4 was prepared according to the MaLellan method (43
mM Histidine + 35mM HEPES). Each sample or native BMP-2 was diluted in sample
Chapter 3 41
buffer [1.0 mL electrophoresis buffer, 3.0 mL glycerol, 0.2 mL 0.5% bromophenol blue,
and 5.8 mL deionised water in each 10 mL sample buffer] before 10μl sample or native
BMP-2 was loaded into each well of a 6% polyacrylamide gel and electrophoresis was
conducted using a Bio-Rad Mini-PROTEAN 3 electrophoresis system (Cat No: 165-3301
and 165-3302) at a constant voltage difference (100V). Protein bands were detected by
Coomassie G-250 staining using GelCode Blue Stain Reagent (24590, Pierce
Biotechnology Inc., Rockford, IL, US). A Bioimaging system, Gene Genius (Syngene,
Synoptics Ltd, Cambridge, United Kingdom) was used to image the gels.
Fourier transform infrared Spectroscopy (FTIR)
FTIR spectroscopy, conducted using a Bio- Rad FTS3500 (Bio-Rad Laboratories,
Cambridge, MA) was employed to explore the secondary structure of proteins in PBS
solution. A total of 32 scans at a resolution of 2 cm
-1
were averaged for each sample. To
determine the secondary structure of protein, all spectra were analyzed by second
derivatization in the amide I region (1700-1600cm
-1
) for their component composition
and BMP-2 secondary structure quantified by Gaussian curve fitting after Fourier self-
deconvolution of the corrected spectra by Peakfit 4.0 (SPSS Science). The area of each
peak in the amide І region was calculated and used to determine the secondary structure
of the protein using procedures reported by Nahar and Tajmir-Riahi (Nahar and Tajmir-
Riahi, 1996).
Chapter 3 42
3.3.5 Cell culture, cell attachment and cytotoxicity studies
Cell culture
hMSCs were purchased from Cambrex Bio Science Walkersville, Inc. (East Rutherford,
NJ), cultured in DMEM supplemented with 4mM-glutamine, 4.5g/L glucose, 25mM
HEPES buffer, 10% fetal bovine serum (Gibco), 10U/mL penicillin G sodium, 10 mg/mL
streptomycin, and 25 mg/mL amphotericin B as Fungizone (Gibco), 100mg/mL L-
ascorbic acid (Sigma-Aldrich, Oakville, Ontario, Canada) and incubated at 37
°
C and 5%
CO
2
humid atmosphere in 75cm
2
cell culture flasks. The cells were extracted with PBS
solution containing 0.25wt% trypsin and 0.02wt% ethylenediaminetetraacetic (EDTA)
acid. The cells were normally sub-cultured at a density of 2 x 10
4
cells/cm
2
.
Cell attachment and cytotoxicity test of scaffolds
Before cell testing, all scaffolds were punched into round sections with diameter of 6mm,
sterilized using gamma radiation and placed in the wells of 96-well plates. About 200μL
of hMSC suspension (2.5 x 10
5
cells/mL) were added into each well and the well plates
were incubated in a humid atmosphere at 37
°
C and 5% CO
2
. For cell attachment test,
after incubation for 4 hours, all scaffolds were rinsed and removed from wells and the
cell number inside wells was assessed and compared with control to get the number of
cell attached to each scaffold within the first 4 hours. The cell number can be counted by
using a cell proliferation assay (PreMix WST-1 Cell Proliferation Assay System, Takara
Bio Inc, Shiga, Japan). For cytotoxicity testing, viable cell densities (after stained by
MTT) in all wells were counted through microscope and compared after day 1, 2, 3, 4, 5,
6, 7 and 8, respectively.
Chapter 3 43
3.3.6 Statistical analysis
All the data were statistically analyzed to express the mean ± standard deviation (S.D.)
and p<0.05 was accepted to be significant.
3.4 Results and discussion
3.4.1 Physical characterization of fibrous scaffolds
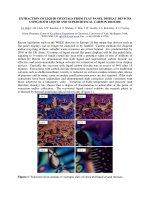
Polymer concentration has crucial effect on fiber morphology, which can be proved by
Figure 3.1. An overview of the SEM images shows relatively denser packed fibers of
nano-sized range when increasing PLGA concentration. In fact, the yield of fibers made
from an emulsion with 10% PLGA is so low that SEM images could not be taken due to
insufficiency of fibers formed. Figure 3.1 shows a comparison between fibers made from
emulsions with 10% PLGA (1A, 1B), 20% (2A, 2B) PLGA and 30% PLGA (3A, 3B). In
terms of variations in polymer concentration, and hence the viscosity of resultant
emulsion, the results obtained in this experiment is consistent with the results obtained by
Berkland et al. (Berkland et al., 2004).
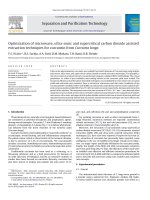
Figure 3.2 shows the SEM images (magnified by 1000x) of the fibers produced in
experimental cases 1-4, which are named as fiber samples F1, F2, F3 and F4 respectively.
All the fibers were produced from emulsion containing 30wt% PLGA and their thickness
generally range from a few hundred nanometres to a few micrometers. Furthermore, the
fibers F1-F4 are densely packed in a three-dimensional manner. Fabrication of such
densely packed of thin micro- and nano-structured fibers creates potentially scaffold with
Chapter 3 44
a large surface area for the release of BMP-2 as well as promoting cell interaction and
growth (Lazzeri et al., 2005).
Figure 3.1 Comparison of the fibers formed from emulsions with different PLGA
concentrations. 1A-1B: 10% PLGA, 2A-2B: 20% PLGA, 3A-3B: 30% PLGA, where A
and B have different amplifications.
Chapter 3 45
Figure 3.2 SEM micrographs of fibrous scaffolds F1-F4 fabricated in experimental cases
1-4, respectively.
Differential scanning calorimetry was performed to determine the physical state of HAp
nanoparticles within the overall structure of the fabricated scaffolds. In the DSC
thermogram, as shown in Figures 3.3 and 3.4, all the fibrous samples including the pure
PLGA fiber sample showed exothermic peaks at approximately 50
°
C, which is the glass
transition temperature of PLGA. The glass transition temperature of PLGA obtained in
this experiment is approximately consistent with the glass transition temperature for
PLGA microspheres of about 50
°
C obtained by Xie et al. and about 40 ± 4
°
C obtained
by Calis et al. (Xie and Wang, 2006; Calis et al., 2002).
Chapter 3 46
Figure 3.3 A comparison of the DSC thermogram for all fibrous samples F1-F4, pure
PLGA fiber and HAp nanoparticles from 30-400
°
C. F1-BMP-2 loaded, no HAp; F2-
BMP-2 loaded, 5% HAp; F3-BMP-2 loaded, 10% HAp; F4-BMP-2 loaded outside, 5%
HAp.
A closer examination at the larger exothermic peaks of the fibrous samples F1-F4 in
Figure 3.4 showed that the temperature in which the peaks occurred generally increased
with the content of HAp nanoparticles. For F1, where no HAp is added, the exothermic
peak occurred at around 350
°
C, while for F3, where the weight/weight ratio of HAp to
PLGA is 10%, the peak occurred at around 375
°
C. This is because like PLGA, HAp
nanoparticles will also absorb heat during the heating process. Therefore, more time is
required for the PLGA in the fibers to absorb enough heat to reach the decomposition
point. Recalling that the temperature varies linearly with time, it is logical that as HAp
content in the fibers increases, the exothermic peak of the fibers will occur at a higher
temperature. Overall, the DSC plots show that HAp nanoparticles were incorporated into
the fibers. Otherwise, all the exothermic peaks would have occurred at around the same
temperature.
Chapter 3 47
Figure 3.4 A comparison of the DSC thermogram for all fibrous samples, pure PLGA
fiber and HAp nanoparticles from 30-200
°
C. F1-BMP-2 loaded, no HAp; F2-BMP-2
loaded, 5% HAp; F3-BMP-2 loaded, 10% HAp; F4-BMP-2 loaded outside, 5% HAp.
Figure 3.4 gives a clearer comparison of the DSC curves of the fibrous scaffolds F1-F4
together with pure HAp nanoparticles. An exothermic peak at approximately 115-120
°
C
reveals the glass transition temperature of HAp nanoparticles, but the exothermic peak is
absent in all the DSC curves of fibrous samples. The lack of the exothermic peak
suggests the lack of HAp clusters in all the fibrous samples and this shows that the HAp
nanoparticles were well distributed and poorly crystallized in all samples. This is
consistent with the result from Kim and colleagues (Kim et al., 2005), who find that HAp
particles are poorly crystallized as long as HAp concentration (to polymer) is below 15%.
Figure 3.5 shows the XRD results of the protein loaded fibrous scaffolds F1-F4 as well as
the XRD results of pure PLGA fibers and pure HAp nanoparticles. The purpose of the
XRD characterization is to verify the hypothesis from the DSC thermogram that the HAp
nanoparticles encapsulated are evenly dispersed on scaffold surfaces. Overall, the shapes
of the XRD curves obtained from all fibrous scaffolds were similar to the PLGA fiber
Chapter 3 48
curve, and all revealed small broad peaks at approximately 22-23
°
(2θ). However, the
XRD curves of all the fibrous scaffolds did not reveal any peaks at around 28
°
or 32
°
(2θ),
which are the characteristic peaks in the HAp nanoparticle curve as shown in XRD
results. The absence of 28
°
and 32
°
(2θ) peaks shows that the HAp nanoparticles were
well dispersed within the fibrous scaffolds, not just appearing on the surface.
Figure 3.5 A comparison of the XRD patterns of the protein loaded scaffolds F1-F4.
From the results tabulated in Table 3.2, the encapsulation efficiency of F4 is the highest
because the protein is directly loaded into the scaffold after its fabrication; therefore it
can be considered that full amount of protein is adsorbed and the encapsulation efficiency
(EE) is recorded as 100%. As for scaffolds F1-F3, where the protein is loaded into the
emulsion before the fabrication of fibers, the encapsulation efficiency in all scaffolds
tested lie in moderate values between 40-70%. Such values of encapsulation efficiency is
reasonable considering the fact that the emulsion was made up of organic and aqueous
components that are barely miscible, and it is difficult to obtain a high encapsulation
efficiency without adding a surfactant to stabilise the emulsion.
Chapter 3 49
Table 3.2 BMP-2 encapsulation efficiency in the 4 groups of fibrous scaffolds (F1-F4)
F1 F2 F3 F4
Encapsulation
Efficiency
(%)
49.39±5.70
44.03±5.90
65.89±7.43
100
*
*For the EE of F4, the BMP-2 was added into scaffolds directly after the fabrication of scaffold,
so its EE can be considered to be 100%.
3.4.2 In vitro release results
The shape of the release curve (Figure 3.6) obtained from this experiment is consistent
with the in vitro release profiles of many studies of bone engineering (Jansen et al., 2005;
Ruhe et al., 2004; Hedberg et al., 2002; Luginbuehl et al., 2005), but some differences
should be emphasized after introducing HAp. Generally, there is a higher percentage of
BMP-2 released when more HAp nanoparticles were added. The percentage of BMP-2
released in F1 was slightly less than 25% after more than 360 hours (15 days) of in vitro
release study, and the percentages were much higher, of about 30% and 45% for F2 and
F3 respectively, but the percentage is more than 96% for F4. The profile for F4 is
consistent with which has been observed in the BMP-2 release from microspheres (Woo
et al., 2001). A logical reason could be the morphology change rate during the release
course due to adding of HAp nanoparticles. What is the most important is that adding the
hydrophilic HAp increased the hydrophilicity of the scaffolds; therefore F2, F3 and F4
are much easier to disassemble than F1. In this process of degradation, BMP-2 in F2, F3
and F4 will diffuse out much faster than in F1.
Chapter 3 50
Figure 3.6 The cumulative in vitro release curves of the scaffolds over a period of 60
days. The plot was presented in terms of the percentage mass released over the original
mass of protein present.
The percentage release rate of BMP-2 is the highest for scaffold F4 at the early stage,
with more than 96% of the protein released after 15 days of in vitro release study. With
the protein loaded after the fibrous scaffolds were fabricated, the protein molecules were
essentially located outside the fibers and stayed in the interstitial spaces within the 3D
network. Hence, it is easier for the protein molecules to diffuse into the release medium
without requiring the fibers to undergo biodegradation before they can be released.
Another reason maybe that BMP-2 was added into F4 as aqueous solution, which means
the hydrophilicity of F4 was increased slightly although most of the water evaporated
already before F4 was used in release test.
Chapter 3 51
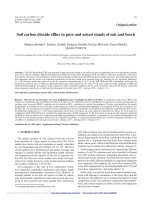
Figure 3.7 A comparison of morphology of F1-F4 after 30 days of in vitro release.
The morphology change was also checked after 30 days of release, which is shown in
Figure 3.7. The result shows clearly the effects of HAp content and protein encapsulation
method on the morphology. After 30 days, many HAp particles appeared on the surface
of F2 and compared with F1, the surface of F2 are much weaker with fractures and many
holes on its surface. It is interesting that F3 and F4 can not maintain their complete
morphologies after 30 days and broke into an amorphous mass. Although F2 and F4 have
the same content of HAp nanoparticles, they showed different morphologies after 30 days
of release. F4 seems less integrated and this finding indirectly explains why BMP-2 in F4
was released much faster than all other fibers.
Chapter 3 52
Controlled and sustained release of protein is crucial for any protein drug delivery system,
so early burst and short-term release course should both be avoided. Furthermore, a very
low concentration of release is not wanted if it is below the effective (therapeutic)
concentration level. For F4, its release curve shows a large release at a very early stage
for bone regeneration because 15 days is far from the desired target. Normally, at least 30
days of sustained release is required. As for F1, its release maybe too slow if its
concentration on site is below the effective concentration. Results from Figure 3.7
illustrate the control of BMP-2 release rate from PLGA fibrous scaffolds by altering the
HAp content. From the trend shown, increasing HAp content can accelerate the release
rate of BMP-2 from fibrous scaffold.
3.4.3 Protein integrity and secondary structure testing results
In order to examine whether there is a loss in protein integrity through the loss of amino
acid groups or structural damage caused in the process of fabrication, SDS-PAGE was
carried out to check for losses in the molecular weight of the protein. In addition, FTIR
was executed to check for structural changes within the protein.
Figure 3.8 shows the Native-PAGE electrophoretic patterns of the BMP-2 released in
vitro from scaffolds F1-F4 after 3 days together with native BMP-2. The results
demonstrate that the released BMP-2 has retained its structural integrity and structural
conformation, as evident by the bands present on the gel. The BMP-2 in all the five wells
has about the same molecular weight of 28kDa, which is accorded with the specification
from the manufacturer. In other words, the released BMP-2 has survived potentially harsh
Chapter 3 53
processes (for instance emulsification and electrospinning as well as post-processing
conditions like scaffold handling and incubation) that may result in partial removal of
amino acid groups and conformation change in the protein.
Figure 3.8 Native PAGE results of BMP-2 released from four kinds of fibrous scaffolds
F1-F4 suspended in PBS after 3 day. Lane 1: Native BMP-2; Lane 2: BMP-2 released
from scaffold F1; Lane 3: BMP-2 released from scaffold F2; Lane 4: BMP-2 released
from scaffold F3; Lane 5: BMP-2 released from scaffold F4.
Chapter 3 54
Figure 3.9 A comparison of α-helix proportion of native BMP-2 ( ) and BMP-2
released from released from F1 ( ), F2 ( ), F3 ( ) and F4 ( ).
Values represent mean ± S.D., n=3.
From literature (Nahar and Tajmir-Riahi, 1996; Woo et al., 2001), the peak of α-helix
structure should lie within the range 1647-1660cm
-1
. For β-sheet, the peak should lie
within the range 1615-1636cm
-1
. For antiparallel β-sheet, the range should be within
1681-1692cm
-1
. As for turn and random structure, the range should lie within 1660-1680
and 1637-1647cm
-1
respectively. Finally, the proportion of each type of protein structure
was determined by evaluating the area of the peak under the curve. The result of the
deconvolution of the absorption curves are summarised at Table 3.3. Generally, the
proportion of all the protein conformations are well maintained for the BMP-2 loaded in
all the scaffolds, with the proportion of the α-helix structure at the Amid I band of the
protein most intact at around 12%. The wavenumber in which the peaks of the various
structures occurred also agrees well with the values obtained from literature. Overall, the
FTIR characterization gives a satisfactory result because the overall small changes in the
proportion of the protein structures in each scaffold showed that only a small proportion
Chapter 3 55
of the loaded protein was denatured, especially for the BMP-2 released from F2, F3 and
F4. This claim is supported by the data because the BMP-2 from these three scaffolds
showed very similar percentages of α-helix and β-sheet, while the BMP-2 protein from
F1 shows a much bigger error bar in terms of the percentage of α-helix and β-sheet,
hence it has demonstrated that the extent of BMP-2 denaturation maybe higher when the
HAp content is lower. This result shows that the BMP-2 in F1 was perhaps damaged in
the electrospinning process, which can be explained by the long time of contact of BMP-
2 with the hydrophobic organic solvent DCM. The BMP-2 in F2 and F3 escaped the
harsh environment because of the presence of HAp nanoparticles due to their similar
hydrophilicity. BMP-2 tried their best to attach to HAp nanoparticles to elude the contact
with DCM. For F4, the BMP-2 was dripped and coated after fiber fabrication, so the
BMP-2 did not experience the harsh process of electrospinning and kept its native
structure wonderfully, as shown in Table 3.3 and Figure 3.10.
Figure 3.10 A comparison of the relative cell attachment ability of F1 ( ), F2 (
), F3 ( ) and F4 ( ) compared with TCPS well control ( ). Values
represent means ± S.D., n=3 (*p<0.05 as compared to F1,
+
p<0.05 by t-test comparison
between the samples).
Chapter 3 56
Table 3.3 A comparison of structural proportions of BMP-2 loaded in each scaffold with
the structural proportions of native BMP-2
α-helix percentage is the most important criterion in judging the denaturation of protein.
In Figure 3.9, the α-helix percentages of BMP-2 released from F1, F2, F3, F4 and native
one are all shown together. From the figure, we can say that BMP-2 released from F4
keep the best structure, while the one from F1 maybe denatured.
3.4.4 Cell attachment and cytotoxicity studies
Figure 3.10 shows the relative cell attachment results on each fibrous scaffold of F1-F4,
using TCPS well without scaffold as a control. The results were obtained by rinsing and
removing the scaffolds from their respective plate wells 4 hours after seeding, and by
counting the cells remaining inside the plate well, the attachment ability of each scaffold
could be determined by the following,
Amide I
components
(cm
-1
)
conformations
native
BMP-2
BMP-2
released
from
F1
BMP-2
released
from
F2
BMP-2
released
from
F3
BMP-2
released
from
F4
1647-1660
α-Helix 12±1 9±2 11±2 11±2 12±1
1615-1636
β- sheet 26±4 19±7 24±6 26±2 25±2
1637-1646
random 10±1 10±3 10±1 10±2 11±1
1660-1680
Turn 26±2 38±18 30±2 29±1 26±2
1681-1692
β- Antiparallel 26±3 24±4 25±2 24±1 26±2