Applications of electrospinning and supercritical carbon dioxide foaming techniques in controlled release and bone regeneration 4
Bạn đang xem bản rút gọn của tài liệu. Xem và tải ngay bản đầy đủ của tài liệu tại đây (1.03 MB, 29 trang )
Chapter 5 82
CHAPTER 5
Fabrication and Characterization of PLGA/HAp Composite
Scaffolds for Delivery of BMP-2 Plasmid DNA
†
5.1 Introduction
Bone defects and fracture are common problems that affect as many as thousand patients
around the world every year, and are difficult to heal using current therapies. It has been
reported that bone morphogenetic protein-2 (BMP-2) has a very strong osteoinductive
activity observed in many animal studies on the induction of bone formation by
implantation of recombinant human BMP-2 (Fujimura et al., 1995; Kusumoto et al., 1998;
Okubo et al., 2000; Boyne, 2001). However, the use of BMP-2 alone requires large
amounts of protein because of its short half-life. Gene transfection is a powerful and
promising alternative that involves the in vitro or in vivo incorporation of exogenous
genes into cells for experimental and therapeutic purposes. Bone regeneration by gene
transfer into human MSC has also been reported (Turgeman et al., 2001; Lieberman et al.,
1999; Lou et al., 1999). These reports have mainly used a retrovirus, or adenovirus vector
carrying human BMP-2, -4, or -7 as the therapeutic gene and these were effective in the
formation of new bone. However, considering the immunological and safety issues of
†
This chapter highlights the work published in H. Nie and C.H. Wang. Fabrication and Characterization of
PLGA/HAp Composite Scaffolds for Delivery of BMP-2 Plasmid DNA. J. Control. Release 120, 111-121.
2007.
Chapter 5 83
viral vectors, necessity in the development of non-viral vector systems has been
increasingly important (Hosseinkhani et al., 2006).
In recent years, the potential of chitosan as a polycationic gene carrier has been explored
in several research groups (Roy et al., 1999; Leong et al., 1998; MacLaughlin et al., 1998;
Mao et al., 2001; Roy et al., 1997; Mao et al., 1996; Saito et al., 2005). Chitosan can
condense DNA, which can ensure smaller diameter and easier entry into cells and nucleus.
Moreover DNA/chitosan nanoparticles could partially protect the encapsulated DNA
from nualease degradation. Hydroxylapatite (HAp), which is a major component of the
bone, can be used as a subsidiary in the bone generation. HAp implants exhibit high
mechanical strength and good biocompatibility. In addition, HAp has the added
advantage of being able to bind directly to the bone since both of them have similar
chemical structures.
Over past years, many release dosage forms have been developed for drug and protein
delivery, like nanoparticle and microparticle. However, one common problem with them
is the burst release at very early stages together with a very short release course.
Especially as for bone regeneration, a new kind of scaffold is needed because
nanoparticles and microparticles are not suitable in view of their fluidity, and hence can’t
be localized themselves and give new born bone enough support. Electrospun fibers are
chosen in the present work as the release dosage form because of their release properties
and morphology. We further explored the in vitro study of plasmid DNA by investigating
the effects of HAp content and the different methods of DNA loading on the physical and
Chapter 5 84
biological characteristics of the micro-fibers fabricated using the electrospinning method
to explore an optimal DNA release system for bone regeneration.
5.2 Materials and methods
5.2.1 Materials
Poly (
DL
-lactide-co-glycolide) (PLGA) (Lot Number W3066-603 with L/G ratio 50:50,
IV 0.57 and MW 51000) used in the experiment was manufactured by Alkermes
Controlled Therapeutics II, (OH, US) and purchased from Lakeshore Biomaterials
(Birmingham, England). Chitosan (medium molecular weight and 75-85% deacetylated),
chitosanase from Streptomyces griseus (lyophilized powder) and phosphate-buffered
saline (PBS) containing 0.1 M sodium phosphate and 0.15 M sodium chloride, pH 7.4,
used for in vitro release study were purchased from Sigma Aldrich (St. Louis, MO, US).
HAp nanocrystals with average diameter 100nm were purchased from Berkeley
Advanced biomaterials Inc. (Berkeley, CA, US). DCM (Cat. No. DR-0440) was
purchased from Tedia Company Inc. (Fairfield, OH, U.S.A.). Human MSCs were
purchased from Cambrex Bio Science (MN, US). PicoGreen dsDNA Quantitation kit was
purchased from Invitrogen Corporation (MN, US) and PreMix WST-1 Cell Proliferation
Assay System was purchased from Takara Bio Inc. (Otsu, Shiga, Japan).
5.2.2 Preparation of plasmid DNA
A pT7T3D-PacI encoding BMP-2, purchased from ResGen, Invitrogen Corporation
(clone identification number UI-R-E1-fb-c-11-0-UI; Ampicillin resistant, 50-200 µg/mL;
RE_5': EcoRI and Re_3': NotI) was used in this study. The plasmid DNA was amplified
Chapter 5 85
in a transformant of Escherichia coli bacteria and isolated from the bacteria by
PureLink
TM
HiPure Plasmid DNA Purification Kit-Maxiprep K2100-07 (Invitrogen
Corporation, MN, US). The DNA concentration was identified by using a PicoGreen
dsDNA Quantitation kit.
5.2.3 Preparation of DNA/chitosan nanoparticles
In the present work, the DNA/chitosan nanoparticles were formed as a result of static
attraction between DNA and chitosan. The size of DNA encapsulated particles is mainly
determined by N/P ratio. From the previous works by Mao and coworkers (Mao et al.,
2001; Roy et al., 1997; Mao et al., 1996), large aggregates formed at N/P ratios around 1
and an N/P ratio below 0.75 and above 2 yielded submicron size particles. Nanoparticles
prepared with an N/P ratio between 3 and 8 tended to have higher thermal dynamic
stability with an average size between 100 and 250 nm according to literature (Mao et al.,
2001). A chitosan solution (0.02% in 5 mM sodium acetate buffer, pH 5.0) and a DNA
solution in 5-50 mM of sodium sulfate solution (100 µg/mL) were preheated to 50-55
°
C
separately. An equal volume of both solutions were quickly mixed together and vortexed
for 15-30s. The final volume of the mixture in each preparation was limited to below 500
µl in order to yield uniform nanoparticles. In this way, nanoparticles with amino group to
phosphate group ratio (N/P ratio) of 4 were obtained.
5.2.4 Fibers fabrication methods
Biodegradable fibrous scaffolds fabricated using an electrospinning method can create a
large surface area (Saito et al., 2005; Li et al., 2006; Gupta et al., 2005; Bottaro et al.,
Chapter 5 86
2002; Lazzeri et al., 2005). Another major advantage of using the electrospinning method
is that the physical properties of fabricated fibers can be easily controlled by parameters
like the composition of the emulsion and the voltage differences (Li et al., 2006). In all
the experiments, the fibers were essentially fabricated from homogeneous emulsions
formed from the sonication of organic and aqueous mixture. Table 5.1 summarizes the
composition of the emulsion of the 3 groups (A, B and C) and 9 samples (A1-A3, B1-B3
and C1-C3) of scaffolds.
Preparation of organic phase
In each experimental case, a 30% wt/vol PLGA polymer solution using DCM as the
solvent was prepared by dissolving 3g PLGA into 10 mL of DCM. The resultant mixture
was agitated by applying vortex until a clear and homogeneous organic phase was formed.
Preparation of aqueous phase
In all experimental cases, the same weight of plasmid DNA was used, but using different
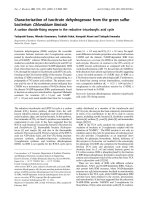
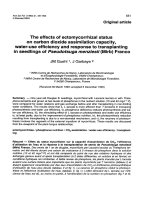
loading methods for different groups. For groups A and B, as specified in Figure 5.1,
DNA was not added into fabrication solution. Instead naked DNA (for group A) or
DNA/chitosan nanoparticles (for group B) were added into scaffolds after the fabrication
of scaffolds. Therefore, while preparing aqueous phase, only the specified weight of HAp
was suspended in DI water and mixed well to form a homogeneous aqueous phase. For
group C, after the fabrication of DNA/chitosan nanoparticles as specified in Section 5.2.3,
the specified weight of HAp was added into DNA/chitosan nanoparticles suspension and
mixed well to form a homogeneous aqueous phase.
Chapter 5 87
Fabrication of fibrous scaffolds
After adding the aqueous and organic phases together, the mixture was sonicated for
about 60 seconds and the resultant emulsion was transferred to a 10mL glass syringe
(MICRO-MATE interchangeable 10cc hypodermic syringe, Popper & Sons, Inc., New
Hyde Park, NY. US) fitted with a 29-g needle and set up in the elecontrospinning
apparatus. The flow rate of polymer solution from the syringe into the spinneret (diameter
340 mm) was controlled by a programmable syringe pump (KD Scientific, Holliston, MA,
US). Scaffolds were electrospun at about a voltage difference of 10 kV with a solution
flow rate of 5 mL/h. The spinneret (anode) was fixed at about 15 cm above the
aluminum-covered rotating collection drum (cathode).
Table 5.1 Compositions and characteristics of different scaffold samples examined in the
present work
Group A
Group B
Group C
0%HAp
5%HAp
10%HAp
0%HAp
5%HAp
10%HAp
0%HAp
5%HAp
10%HAp
Sample
compositions
A1
A2
A3
B1
B2
B3
C1
C2
C3
T
g
(ºC)
48.50
49.83
50.50
48.50
49.83
50.50
49.33
48.67
46.17
T
d
(ºC)
344.33
367.33
375.83
344.33
367.33
375.83
355.83
373.50
375.83
DCM
residual content
(ppm)
365
±50
243
±38
277
±39
249
±29
195
±21
201
±16
297
±57
252
±28
133
±24
Encapsulation
Efficiency
(%)
100
100
100
100
100
100
65±5
78±9
87±4
Chapter 5 88
Mode A
Mode B
Mode C
Figure 5.1 Three DNA incorporation modes in the present work.
Chapter 5 89
5.3 Characterization of scaffolds
5.3.1 Physical characterization of fibrous scaffolds
Morphology and mechanical properties of fibrous scaffolds
Field emission scanning electron microscopy (FESEM, JSM-6700F, JEOL Technics Co.
Ltd, Tokyo, Japan) was employed to study the surface morphology of the fibers produced
in each experiment, while the mechanical quality of the fibers was determined by tensile
strength testing. The mechanical properties of all fibrous scaffolds (A1, A2, A3, B3, and
C3) prepared in a sheet form (15mm x 20mm x 150µm) were evaluated by applying a
tensile load and then observed the corresponding strain.
Differential scanning calorimetry (DSC)
Differential scanning calorimetry (DSC) can be employed to determine the amount of
crystalline structure within the microfibers as well as the effects of HAp concentration on
the glass transition temperature and the decomposition temperature of PLGA. The sample
was heated from 30
°
C to 400
°
C at a constant temperature increment of 10
°
C/minute and
purged with nitrogen gas at 30 mL/min.
X-ray diffractrometry (XRD)
The HAp nanoparticles or fiber sample were placed in a sample holder and the surface of
the sample was flattened. Next, the sample was placed in the XRD equipment
(SHIMADZU, Tokyo, Japan). A diffraction range of 10-35
°
(2θ) was selected and the
XRD analysis was carried out at 2
°
/min.
Chapter 5 90
Measurement of residual solvent content in scaffolds
Gas Chromatography was used to determine the residual amount of Dichloromethane
(DCM) remaining in the scaffolds. Standard solutions with the range of DCM
concentrations in N, N Dimethyl Formamide (DMF) from 0.5 to 10 x 10
-6
mL DCM per
mL DMF were prepared and placed in the refrigerator before analysis to prevent
evaporation of the volatile organic solvents.
5.3.2 In vitro release test and determination of encapsulation efficiency (EE)
In vitro release test of plasmid DNA
Approximately 25mg of microfiber samples made from each experiment were prepared
and each of them is added to 5 mL PBS, the release medium in the experiment. The
resultant mixture was placed in an orbital shaker bath (GFL® 1092) at 37
°
C, 120rpm. 1
mL of sample mixture was extracted at specific intervals (1h, 4h, 16h, day1, 2, 3, 5, 7, 10,
12, 14, 16, 19, 23, 27, 30, 33, 36, 39, 42, 45, 50, 53, 56, 60, 63 and 66) from each test
tube and the sample was stored at -20
°
C to inhibit all DNA denaturation activities. 1 mL
of fresh PBS solution was then added to each mixture to make up 5 mL again and all the
mixtures were incubated in the orbital shaker bath again before the next set of sample
mixtures were extracted. For the second and third DNA incorporation modes, the DNA
encapsulated in chitosan nanoparticles is difficult to be released from the complex by
common chemical methods. In this work, in order to quantify the concentration of
plasmid DNA in each sample, chitosanase was utilized to degrade chitosan shell to
release DNA for quantitative analysis. Briefly, chitosanase was dissolved in PBS to form
Chapter 5 91
a working solution of 1 mg/L. Subsequently, adequate chitosanase solution was applied
to each sample to degrade chitosan.
Encapsulation efficiency determination
5mg of each scaffold was dissolved in 1 mL of DCM and 5 mL of PBS (pH 7.4) then
introduced to extract DNA. The resultant emulsion was then centrifuged using a
centrifuge (Hettich Zentrifugen, Universal 32R, Andreas Hettich GmbH & Co KG,
Tuttlingen, Germany) at 9000rpm and 20
°
C for 20 min to separate the water and oil
phases. The water phase was then carefully collected and kept frozen at -20
°
C until it
was analyzed for DNA concentration using the PicoGreen dsDNA quantitation kit after
the addition of chitosanase to degrade chitosan shell. The encapsulation efficiency can be
obtained by the equation below:
%100
W
WWW
W
V C
EE
DNA plasmid
HApPLGADNA plasmid
sample
waterDNA plasmid
×
+
+
×
×
=
(5.1)
Where C
plasmid DNA
is the plasmid DNA concentration in the water phase of extraction;
V
water
is the volume of water phase of extraction; W
sample
is the weight of each scaffold
sample used for EE analysis; W
plasmid DNA
, W
PLGA
and W
HAp
are the weights of plasmid
DNA, PLGA and HAp used in the scaffold fabrication process, respectively.
5.3.3 DNA integrity check by agarose DNA gel electrophoresis
Agarose DNA gel electrophoresis was used to determine the integrity of plasmid DNA
released out from scaffolds in vitro after 3 day and 60 days. For groups B and C,
DNA/chitosan nanoparticles before and after chitosanse digestion are both checked. DNA
Chapter 5 92
samples were diluted sixfold in gel loading buffer [composition: 25mg bromophenol blue
+ 4g sucrose and with further addition of water to 10 mL]. A 6 μL volume of loading
buffer/sample was loaded into each well of a 0.7% agarose gel and electrophoresis was
conducted using a Bio-Rad Mini-PROTEAN III electrophoresis system (Cat No: 165-
3301 and 165-3302, Bio-Rad Laboratories, CA, US) at a constant voltage (100V) for 50
minutes with native plasmid DNA as control.
5.3.4 Culture of hMSC
Cell growth
Human MSCs were purchased from Cambrex Bio Science Walkersville, Inc. (East
Rutherford, NJ), cultured in DMEM supplemented with 4mM-glutamine, 4.5g/L glucose,
25mM HEPES buffer, 10% fetal bovine serum (Gibco), 10U/mL penicillin G sodium, 10
mg/mL streptomycin, and 25 mg/mL amphotericin B as Fungizone (Gibco), 100mg/mL
L-ascorbic acid (Sigma-Aldrich, Oakville, Ontario, Canada) and incubated at 37
°
C and
5% CO
2
humid atmosphere in 75cm
2
cell culture flasks. The cells were extracted with
PBS solution containing 0.25wt% trypsin and 0.02wt% ethylenediaminetetraacetic
(EDTA) acid. The cells were normally sub-cultured at a density of 2 x 10
4
cells/cm
2
.
Cell attachment and viability test
Before cell testing, all scaffolds were punched into round sections with diameter of 6mm,
sterilized using gamma radiation and placed in the wells of 96-well plates. About 200μL
of hMSC suspension was added into each well and the well plates were incubated in a
humid atmosphere at 37
°
C and 5% CO
2
(5.0 x 10
4
cells/well). For cell attachment test,
Chapter 5 93
after incubation for 4 hours, all scaffolds were rinsed and moved from wells and the cell
number inside wells was assessed and compared with control to get the number of cell
attached to each scaffolds within the first 4 hours. The cell number can be counted by
using a cell proliferation assay (PreMix WST-1 Cell Proliferation Assay System, Takara
Bio Inc, Shiga, Japan). A control without any scaffold was used in the cell culture
experiment. The process of assessing cell metabolic activity (cell number indirectly) was
repeated at first day, second day and third day for cell viability test. In this test, scaffolds
in wells were not removed before cells were treated by MTS. They were removed from
the wells just before the absorbance at 490 nm was determined in order to cover both the
cells in wells and scaffolds. The cell viability can be calculated by (Xie and Wang, 2005):
Cell viability (%) = (Abs test cells / Abs control cells) x 100% (5.2)
Where “Abs test cells” represents the amount of formazan determined for cells treated
with the different formulations and “Abs control cells” represents the amount of
formazan determined for untreated control cells.
In vitro experiment of hMSC transfection by different scaffolds
To measure the level of gene transfection of hMSC cultured, the scaffolds collected were
washed three times with PBS, cut up with a scissors, and homogenized in the lysis buffer
(0.1M Tris-HCl, 2mM EDTA, 0.1% Triton X-100). The sample lysate (2 mL) was
centrifuged at 12,000 rpm for 5 min at 4
°
C, and the supernatant was carefully collected
and kept in the ice. To measure the expression level of BMP-2 gene, 50 µl of the
supernatant was collected and the BMP-2 protein was determined by a human BMP-2
Chapter 5 94
ELISA Kit (R&D Systems). The total protein concentration of the lysate was also
assayed by the Micro BCA
TM
Protein Assay Reagent Kit (Lot. No.23235, Pierce
Chemical Company). Each experiment was carried out three times independently.
5.3.5 Statistical analysis
All the data were statistically analyzed to express the mean ± the standard deviation (S.D.)
of the mean and p<0.05 was accepted to be significant.
5.4 Results and discussion
5.4.1 pT7T3D-Pac purity and concentration
In order to ensure DNA purity isolated from Escherichia coli bacteria, the absorbance
ratio at the wavelength of 260-280nm has to be maintained between 1.8 and 2.0
(Hosseinkhani et al., 2006). The ratio for the pT7T3D-PacI after purification by
PureLink
TM
HiPure Plasmid DNA Purification Kit was determined to be 1.9, which
demonstrated that DNA purity was accorded with requirement. Using the PicoGreen
dsDNA quantitation kit, the DNA concentration was determined to be 400 µg/mL. It
should be diluted four times to 100µg/mL for fabrication of DNA/chitosan nanoparticles.
5.4.2 Preparation and characterization of the DNA/chitosan nanoparticles
Particles fabricated by using higher N/P ratios, like 5 or 6, are not much smaller than at
the N/P ratio of 4. However, too much chitosan can cause many problems in the analysis
of DNA concentration in the in vitro release tests. Therefore, the N/P ratio of 4 was used
Chapter 5 95
throughout the present work and the resultant DNA/chitosan particles are not exactly
spherical but all share about the same size of 100nm in diameter.
5.4.3 Fiber characteristics
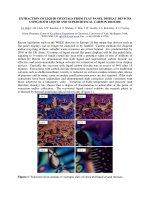
A1 (0% HAp) A2 (5% HAp) A3 (10% HAp)
B1 (0% HAp) B2 (5% HAp) B3 (10% HAp)
C1 (0% HAp) C2 (5% HAp) C3 (10% HAp)
Figure 5.2 Field emission scanning electron micrographs for representative samples of
groups A, B and C.
In order to characterize the effects of HAp contents and DNA loading methods on
scaffold characteristics more clearly, the scaffolds used in the present work are divided
Chapter 5 96
into nine types based on their different compositions as shown in Table 5.1. Each of the
subscript “1”, “2” and “3” for groups A, B, and C represents the different loadings of
HAp 0%, 5%, and 10%, respectively. Figure 5.2 shows the micrographs of groups A, B
and C fibers respectively with different contents of HAp nanoparticles (0%, 5% and 10%).
It is shown that the addition of HAp or/and chitosan significantly affects the morphology
of fiber. As specified in Section 5.2.4, HAp nanoparticles and DNA/chitosan
nanoparticles were all suspended in DI water before mixing with 30% PLGA/DCM
solution. The water/oil emulsion system is unstable especially at the later phase of
electrospinning, so the fibers (loaded with 5% and 10% of HAp or loaded with chitosan
nanoparticles) can not keep uniform diameter as fabricated in pure PLGA/DCM systems
(A1 and B1).
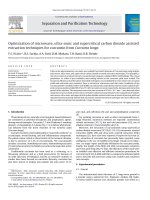
B1 C1
Figure 5.3 The morphology observed at the cross section of samples B1 and C1 [shown
by dashed line in Figure 5.2]. This enlarged diagram illustrates clearly the encapsulated
DNA/chitosan nanoparticles at the cut section of C1.
FESEM pictures illustrating the cross sections of samples B1 and C1 are shown and
compared in Figure 5.3. As indicated by white arrows, several particles with diameter of
about 100 nm are found to be entrapped within the cross section of sample C1, while they
Chapter 5 97
are absent in B1. No HAp nanoparticles were used in the samples for B1 and C1,
therefore the 100nm-diameter particles observed within the cross-section of sample C1
must be DNA/chitosan nanoparticles. This comparison shows that in the group C,
DNA/chitosan nanoparticles are encapsulated inside the fiber polymer matrix as designed.
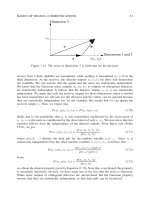
Mechanical strength testing was carried out to check the effect of the addition of HAp,
and chitosan on the mechanical property. The stress-strain (S-S) curve of the samples was
monitored, and representative examples were shown in Figure 5.4. All of the different
types of fibrous scaffolds showed a similar S-S pattern, with an initial linear elastic
regime, followed by subsequent failure. Compared to pure PLGA (A1), the HAp- PLGA
fibrous scaffolds exhibited a higher initial slope and lower strain at failure. It was noted
that, among A1, A2, and A3, A2 showed the highest tensile strength, suggesting that the
encapsulation of a suitable amount (5%) of HAp in PLGA contributed to the mechanical
strength. This was likely due to HAp nanoparticles integrating well with the PLGA,
adopting an efficient composite structure of inorganic-organic system as observed in
natural bone. The mechanical properties of the scaffolds fabricated using different
loading methods were also determined. As shown in Figure 5.4, on the condition of same
amount of HAp, C3 showed much higher tensile strength (more than 4 times) than A3
and B3, which showed that the high viscosity of chitosan contributed to the tensile
strength of fibrous scaffolds.
Chapter 5 98
012345678
0.0
0.4
0.8
1.2
1.6
2.0
2.4
2.8
Tensile stress (MPa)
C3
B3
A3
A2
A1
Tensile stress (MPa)
Strain (%)
0
1
2
3
4
5
6
7
8
Figure 5.4 Representative stress-strain curves of the fibrous scaffolds.
The XRD pattern shows that there is no peak at 2θ = 28
°
and 32
°
which are the
characteristic peaks of HAp nanoparticles (data not shown). Furthermore, no obvious
peak exists at about 2θ = 20
°
which is the characteristic peak of chitosan. This
observation shows that HAp nanoparticles and DNA loaded chitosan nanoparticles in
fibers are both poorly crystallized. From the DSC endothermgram (data not shown) we
reconfirm that HAp nanoparticles are poorly crystallized and the impregnation of HAp
nanoparticles increases the decomposition temperature of PLGA fiber from 344.33
°
C
(without adding DNA/chitosan nanoparticles) and 355.83
°
C (with adding DNA/chitosan
nanoparticles) respectively to 375.83
°
C. In contrast, the changes in glass transition are
not so straightforward because after the addition of DNA/chitosan nanoparticles, the glass
transition temperatures decrease from 49.33
°
C to 46.17
°
C with increasing HAp content
Chapter 5 99
from 0% to 10%. This illustrates a different tendency from those cases without the
addition of DNA/chitosan nanoparticles, as shown in Table 5.1.
5.4.4 Measurement of residual DCM content in scaffolds
As shown in Table 5.1, the residual DCM content of the scaffolds fabricated using the
electrospinning method was below the safety standards (600ppm) after freeze drying for
7 days. The residual content is not very ideal compared with other dosage forms like
nanoparticles or microparticles because fibers have very compacted network structure,
which hinders the evaporation of DCM from scaffolds.
5.4.5 Determination of DNA encapsulation efficiency (EE)
For groups A and B, the naked DNA solution or chitosan/DNA nanoparticles suspension
was dripped into scaffolds after the fabrication of scaffolds; therefore it can be considered
that full amount of DNA was adsorbed into scaffolds and the encapsulation efficiency
(EE) is recoded as 100%. For group C, the encapsulation efficiency is well below 100%
but with a very satisfactory EE value ranging between 65-87%, as shown in Table 5.1.
The relationship between EE and HAp content shown clearly in Table 5.1 is that the
incorporation of HAp can significantly enhance the encapsulation efficiency. This
phenomenon may be explained by the hydrophilicity of HAp nanoparticle. In the
emulsion solution of PLGA-DCM-HAp-DNA/nanoparticles, most of the DNA/chitosan
nanoparticles would try their best to attach each other together with HAp nanoparticles in
order to escape from the direct contact of DCM. As a result, in the process of
electrospinning, DNA/chitosan nanoparticles are incorporated into fibers together with
HAp nanoparticles. This means that more HAp nanoparticles enable higher encapsulation
Chapter 5 100
efficiency of DNA. In contrast, for the case without HAp (sample C1), DNA/chitosan
nanoparicles would try their best to be away from the emulsion solution of PLGA/DCM
and therefore in the process of electrospinning, DNA/chitosan nanoparticles in the water
phase go to the top layer of PLGA/DCM solution and phase separation occurs especially
in the later phase of electrospinning process. As pure aqueous phase can not be electro-
sprayed due to its low viscosity, phase separation of PLGA/DCM and water can lead to
the lower encapsulation efficiency of DNA.
5.4.6 In vitro release study of DNA from different scaffolds
Figure 5.5 shows the in vitro profiles of plasmid DNA release from different scaffolds in
PBS at 37 ºC. Irrespective of the release modes, the release rate of plasmid DNA
increases with increasing loading of HAp nanoparticles, but the whole release courses are
quite different for various release modes (groups A, B and C). For group A, an initial
burst shows up suddenly from the starting point till days 7-9 for samples A1, A2 and A3.
In contrast, when the cumulative DNA release reached 80-85%, the remaining 15-20% of
DNA could be released within the following 4-5 days. This time scale of release is
comparable to other dosage forms, like nanoparticles and microparticles. On the other
hand, the release curves for group B are quite different: There are no obvious bursts of
release and their release rates in the initial stage (cumulative release < 80%) are much
lower than those of group A. Furthermore, the release curve shows better sustained
release than group A. This may be explained by the flexibility of naked DNA molecules.
In the process of diffusion into PBS buffer, naked DNA molecules can change their
three-dimensional structure flexibly to avoid the obstruction of intercrossing fibers. In
contrast, DNA loaded chitosan nanoparticles are rigid such that they meet more difficulty
Chapter 5 101
for overcoming the hindrance of fibrous framework. For group C, their release curves are
more linear than groups A and B and their sustained release characteristics are more
obvious. This is because DNA/chitosan nanoparticles for group C face higher diffusion
resistance due to the presence of fiber matrix as a dominant barrier until a significant
proportion of PLGA has degraded. Compared with the release periods of groups A and B,
group C scaffolds shows much longer release course and 95% cumulative release of
DNA can be reached in 45-55 days, which is much longer than the 20-26 days for group
B and 5-10 days for group A, respectively. FESEM picture of the sample C1 cross
section (shown in Figure 5.3) proved that DNA/chitosan nanoparticles were encapsulated
inside fibers. Moreover, from the linear release profile observed from group C (shown in
Figure 5.5c), it could be deduced that DNA/chitosan nanoparticles were located
throughout the fibrous scaffold in a random (uniform) form. They could be located on the
surface of fibers, inside the fibers but near to the surface, or near the core of fibers. This
is similar to the distribution of HAp particles within the fibers; otherwise a biphasic
release of DNA/chitosan nanoparticles is expected.
Chapter 5 102
(a)
0 6 12 18 24 30 36 42 48 54 60 66
0
10
20
30
40
50
60
70
80
90
100
110
Cumulative Percentage (%)
Time (days)
A1
A2
A3
(b)
0 6 12 18 24 30 36 42 48 54 60 66
0
10
20
30
40
50
60
70
80
90
100
110
Cumulative Percentage (%)
Time (days)
B1
B2
B3
(c)
0 6 12 18 24 30 36 42 48 54 60 66
0
10
20
30
40
50
60
70
80
90
100
110
Cumulative Percantage (%)
Time (days)
C1
C2
C3
Figure 5.5 In vitro release curves of three groups of scaffolds (groups A, B and C).
Chapter 5 103
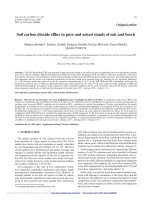
1 2 3 4 1 2 3 4 5 6 7
Group A Group B
1 2 3 4 5 6 7 1 2 3 4 5 6 7
Group C Group C
60
Figure 5.6 Electrophoretic mobility analysis of naked DNA (group A) and DNA/chitosan
nanoparticles (groups B, C and C
60
, here C
60
refers to group C in vitro sample released
after 60 days) following chitosanase digestion. All samples other than C
60
were taken
after 3 days of in vitro release and run on a 0.7% agarose gel and stained with ethidium
bromide. For group A, lane 1: native pT7T3D-PacI DNA; lane 2: DNA released from
scaffold A1; lane 3: DNA released from scaffold A2; lane 4: DNA released from scaffold
A3. For groups B and C, lane 1: native pT7T3D-PacI DNA; lane 2: DNA/chitosan
nanoparticles released from scaffold B1/C1; lane 3: DNA/chitosan nanoparticles released
from scaffold B1/C1 + chitosanase digestion; lane 4: DNA/chitosan nanoparticles
released from scaffold B2/C2; lane 5: DNA/chitosan nanoparticles released from scaffold
B2/C2 + chitosanase digestion; lane 6: DNA/chitosan nanoparticles released from
scaffold B3/C3; lane 7: DNA/chitosan nanoparticles released from scaffold B3/C3 +
chitosanase digestion.
Chapter 5 104
5.4.7 Integrity study of plasmid DNA released from scaffolds
Results from agarose gel electrophoresis demonstrate that the released DNA has retained
its structural integrity as evidenced by the distinct bands present on the gel (Figure 5.6).
In other words, the released DNA has survived both the electrospinning process and post-
processing conditions (handling of scaffold, incubations, and lyophilization). From the
electrophoretic patterns of groups B and C, we can see that the chitosan encapsulation of
DNA is very satisfactory because no free DNA is detected on lanes 2, 4 and 6 of group B
and C and only some small dots are found to stay on these lanes. These dots may be very
fine particles or just impurity. This phenomenon shows that “4” is a perfect N/P ratio,
which can ensure DNA/chitosan particles smaller than 100nm and close to hundred
percent encapsulation of plasmid DNA. Comparing the electrophoretic pattern of DNA
released from DNA/chitosan nanoparticle by chitosanase digestion and native DNA, one
can confirm that chitosan encapsulation posed no observable side effect on DNA integrity.
5.4.8 hMSC attachment ability and cell viability test on scaffolds
Figure 5.7 shows the cell attachment results on each fibrous scaffold, using the plate well
without scaffold as a control.
Number of cells on scaffold = Cell count in control experiment - Cell count in well after
the removal of scaffold (5.3)
Attachment ability = Number of cells on scaffold / Cell count in control experiment (5.4)
The results show that the relationship between the ability of scaffold adhering to cells and
HAp content is not very straightforward in each group, but the attachment ability
Chapter 5 105
difference among groups A, B and C is very clear. The attachment ability of group C is
the highest while that of group A is the lowest. Considering the morphologies of scaffold
groups A, B and C, the modified PLGA/HAp scaffolds (after adding naked DNA or
DNA/chitosan nanoparticle) show more compacted morphology even after the complete
water evaporation in freeze dryer. Group C scaffolds are porous after electrospinning and
drying and have more space to hold cells upon competing with TCPS wells to “arrest”
cells. Based on this explanation, it is not difficult to understand the highest normalized
attachment factor for group C scaffolds.
0.00
0.05
0.10
0.15
0.20
0.25
0.30
0.35
0.40
0.45
0.50
+
+
C3
C2
C1
B2
B3
B1
A2
A1
A3
CA
scaffold
/ CA
blank TCPS
Groups
Figure 5.7 Cell attachment (4h after cell seeding) of hMSCs on all nine types of
scaffolds (tissue culture polystyrene well as control) (
+
p<0.05 by t-test comparison
between the samples). In this figure CA refers to cell attachment.
Chapter 5 106
(a)
0123
0.60
0.65
0.70
0.75
0.80
0.85
0.90
0.95
1.00
1.05
TCPS well as control
Relative cell viability
Time after cell seeding (days)
Group A1
Group A2
Group A3
(b)
0123
0.60
0.65
0.70
0.75
0.80
0.85
0.90
0.95
1.00
1.05
TCPS well as control
Relative cell viability
Time after cell seeding (days)
Group B1
Group B2
Group B3
(c)
0123
0.60
0.65
0.70
0.75
0.80
0.85
0.90
0.95
1.00
1.05
TCPS well as control
Relative cell viability
Time after cell seeding (days)
Group C1
Group C2
Group C3
Figure 5.8 Cell viability test (1d, 2d and 3d after seeding) of hMSCs on all nine types of
scaffold (tissue culture polystyrene well as control).