Applications of electrospinning and supercritical carbon dioxide foaming techniques in controlled release and bone regeneration 5
Bạn đang xem bản rút gọn của tài liệu. Xem và tải ngay bản đầy đủ của tài liệu tại đây (4.74 MB, 19 trang )
Chapter 6 111
CHAPTER 6
BMP-2 Plasmid Loaded PLGA/HAp Composite Scaffolds for
Treatment of Bone Defects in Nude Mice
†
6.1 Introduction
Over past decades, varied controlled-release dosage forms have been developed for drug,
protein and DNA delivery, for instance, nanoparticles and microspheres. However, this
type of devices is known to exhibit a large burst during the early period of release. To
tackle this drawback, electrospun fiber is chosen in the present study as the release
dosage form because its moderate surface/volume ratio may produce a relatively constant
controlled release of DNA with inhibited initial burst as compared to that of nanoparticles
and microspheres (Wei et al., 2006; Wnek et al., 2003). Moreover, in comparison to
microspheres, compact fibrous scaffolds give cell stable three-dimensional growth
environments and may provide newly generated bone enough support. On the other hand,
hydroxyapatite (HAp), which is a major component of the bone, can be used as a
subsidiary in the bone generation. In addition, HAp has another advantage of being able
to bind directly to the bone since both of them have similar chemical structures (Li et al.,
2006). Therefore, polymer/HAp composite scaffolds are promising as a substitute for
†
This chapter highlights the work published in H. Nie, M.L. Ho, C.K Wang, C.H. Wang, and Y.C. Fu.
BMP-2 Plasmid Loaded PLGA/HAp Composite Scaffolds for Treatment of Bone Defects in Nude Mice
Biomaterials (in press).
Chapter 6 112
bone graft. In a previous study (Nie and Wang, 2007), PLGA/HAp composite scaffolds
with different HAp contents (0%, 5% and 10%) were fabricated by electrospinning
method and DNA was incorporated into the scaffolds in three ways (i.e. coating of naked
DNA or DNA/chitosan nanoparticles on scaffolds after fiber fabrication by dripping, and
encapsulation of DNA/chitosan nanoparticles into scaffold by mixing them with
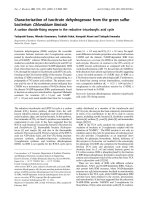
PLGA/HAp solution before fiber fabrication) (see Figure 6.1). The results showed that
BMP-2 plasmid loaded PLGA/HAp composite scaffolds could maintain the integrity of
encapsulated BMP-2 plasmid, enhance cell attachment with negligible cytotoxicity. In the
present study, the main objective was to investigate the bone regeneration capability of
these PLGA/HAp composite fibrous scaffolds in vivo. The hypothesis is that different
loading methods of BMP-2 plasmid and different HAp contents in scaffolds will alter the
release profiles of BMP-2 plasmid, and consequently influence its performance in bone
regeneration in vivo.
Figure 6.1 Illustration of three plasmid loading modes in the present work.
Chapter 6 113
6.2 Materials and methods
6.2.1 Materials
Poly(
D,L
-lactide-co-glycolide) (PLGA) (L/G ratio 50:50, MW 40,000-75,000) and
chitosan (medium molecular weight and 75-85% deacetylated), were procured from
Sigma Aldrich (St. Louis, MO, US). HAp nanocrystals with average diameter of 100nm,
dichloromethane (DCM), Ketamine Ketalar® and Xylocain® were purchased from
Berkeley Advanced biomaterials Inc. (Berkeley, CA, US), Tedia Company Inc. (Fairfield,
OH, US.), Parke-Davis Taiwan, and AstraZeneca PLC Taiwan, respectively.
6.2.2 Preparation of DNA/chitosan nanoparticles
As described in Chapter 5 (Section 5.2.3), a pT7T3D-PacI plasmid encoding BMP-2 was
used throughout the present study and DNA/chitosan nanoparticles were formed as a
result of static attraction between DNA and chitosan. Chitosan solution (0.02% in 5 mM
sodium acetate buffer, pH 5.0) and DNA solution of 100µg/mL in 5-50 mM of sodium
sulfate solution were preheated to 50-55
°
C separately. An equal volume of both solutions
were quickly mixed and vortexed for 15-30s. The final volume of the mixture in each
preparation was limited to below 500 µL in order to yield uniform nanoparticles. In this
way, nanoparticles with amino group to phosphate group ratio (N/P ratio) of 4 were
obtained.
6.2.3 Fibers fabrication methods
In all the experiments, fiber mats were essentially fabricated from homogeneous
emulsions formed from the sonication of organic and aqueous mixture. Table 6.1
Chapter 6 114
summarizes the composition of the emulsion of the 3 groups (A, B and C) and 9 samples
(A1-A3, B1-B3 and C1-C3). The detailed fabrication procedures have been illustrated in
Chapter 5 (Section 5.2.4).
Table 6.1 Compositions of different scaffold samples in the current study
Group A
HAp/PLGA (% w/w)
Group B
HAp/PLGA (% w/w)
Group C
HAp/PLGA (% w/w)
A1
A2
A3
B1
B2
B3
C1
C2
C3
0/100
5/95
10/90
0/100
5/95
10/90
0/100
5/95
10/90
6.2.4 In vivo experiments
All procedures were performed in accordance to specifications in the Guidelines for
Animal Experiments of Kaohsiung Medical University. The animal model has been
interpreted in our previous study (Fu et al., 2008). The detailed description of animal
model construction and subsequent characterizations can be found in Chapter 4 (Section
4.3.2).
6. 2.5 Statistical analysis
All the data were statistically analyzed to express the mean ± standard deviation (S.D.).
Student’s t-test was performed and p<0.05 was accepted to be significant.
Chapter 6 115
6.3 Results and discussion
6.3.1 Preparation and characterization of the DNA/chitosan nanoparticles
The N/P ratio of 4 was used throughout the present work and the resultant DNA/chitosan
particles were not exactly spherical but all share about the same size of about 100nm in
diameter.
6.3.2 Fiber characteristics
As previously shown in Figure 5.2 (Chapter 5), PLGA/HAp composite fibers (loaded
with 5 % or 10 % of HAp) or fibers loaded with chitosan nanoparticles could not
maintain uniform diameter as compared with pure PLGA/DCM systems (A1 and B1). In
addition, A1 and B1 have smaller diameters because a pure PLGA/DCM system has
higher viscosity than emulsion. Furthermore, the diameter of fibers becomes larger with
the addition of more HAp nanopaticles (Nie and Wang, 2007). FESEM pictures
illustrating the cross sections of samples B1 and C1 were compared (Nie and Wang,
2007). As displayed in Figure 5.3 (Chapter 5), particles with diameter of about 100 nm
were found to be entrapped within the cross section of sample C1, while they were absent
in B1. This confirms that, in group C, DNA/chitosan nanoparticles are incorporated
inside the fiber polymer matrix as intentionally designed.
6.3.4 Animal experiments
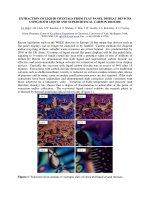
Soft X-ray photographs clearly demonstrate the outcome of the treatments with different
scaffolds. Figure 6.2 shows the soft X-ray photographs of mice tibia fractures two and
four weeks after implantation of scaffolds together with control.
Chapter 6 116
Figure 6.2 Radiographs of nude mice tibias after 2 and 4 weeks of implantation of
scaffolds. Bone fragment without implantation of any scaffold is denoted as control and
white arrows identify bone defects.
The bone ends of the control samples were sharp and there was no significant bone
regeneration after two and four weeks. The delayed union of bone fractures was clearly
shown by white arrows in micrographs. In contrast, those from A1 and B1 showed wide
and dull bone ends, indicating the new formation of bone after two and four weeks. This
was more evident due to the fact that the two disconnected sections on tibia formed new
Chapter 6 117
bridges after four weeks. These results demonstrate clearly that BMP-2 plasmid released
from A1 and B1 within the observation period of four weeks, with the expression of
BMP-2 proteins, helped the bone regeneration. Similarly, other samples, including A2,
A3, B2, B3, C1, C2 and C3, showed better treatments than control. Amongst them, A1
performed the best, in which after only two weeks the two disconnected ends were fully
joined. Comparing those samples with 0% of HAp concentration (A1, B1 and C1) but
different loading techniques of plasmid, A1 and B1 demonstrated the best performances
and displayed best joints of two bone ends after just two weeks. This observation
suggests the advantages of groups A and B over group C in the early stage of bone
healing (first two-week period).
0
500
1000
1500
2000
2500
3000
3500
4000
+
+
+
+
*
*
*
*
*
*
*
*
A1
C3
C1
B1
A3
B3
week 2
Serum BMP-2 concentration (pg/ml)
week 4
ctrl
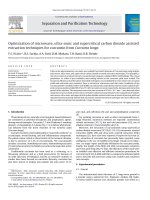
Figure 6.3 Comparison of serum BMP-2 concentrations in groups A1/A3, B1/B3 and
C1/C3 over the first 4 weeks along with control. Values represent means ± S.D., n=3
(*p<0.05 as compared to control and
+
p<0.05 compared between samples).
Chapter 6 118
Figure 6.3 shows the serum BMP-2 concentrations two and four weeks after the
implantation of A1/A3, B1/B3 and C1/C3 scaffolds. As bone healing is a spontaneous
process, it is not strange to detect BMP-2 in the serum of the control sample. An
unexpected phenomenon was that BMP-2 concentrations detected in group A samples
(A1 and A3) were lower than control over the testing period of four weeks. The most
important factor contributing to the phenomenon should be due to the serious cytotoxicity
of group A samples (Nie and Wang, 2007). The harsh environment due to cytotoxicity
may interfere with signal transductions between cells and hinder the spontaneous
secretion of BMP-2. As a result, lower serum BMP-2 concentration was detected in
group A samples than control. Another possible reason is the low transfection efficiency
of naked DNA, and thus the low expression of naked plasmid released from A1 and A3.
Consequently, the serum BMP-2 levels of A1 and A3 did not improve significantly after
four weeks, as compared to those levels after two weeks. Similar to group A samples,
group B samples also have cytotoxicity, but the much higher transfection efficiency of
DNA/chitosan nanoparticles might offset the effect of cytotoxicity posed by them.
Consequently, group B samples demonstrated much higher BMP-2 concentrations than
group A samples over the first four weeks. Particularly, B1 showed the highest BMP-2
concentration among all samples, and the BMP-2 level was sustainable over the testing
period. For group C samples, serum BMP-2 concentration experienced a significant
increase after four weeks, although the level after two weeks was lower than all other
samples. These in vivo observations of serum BMP-2 concentration demonstrate different
release properties of groups A, B and C, and are consistent with the in vitro release
profiles of BMP-2 plasmid from different scaffolds (Nie and Wang, 2007), As naked
Chapter 6 119
DNA and DNA/chitosan nanoparticles are coated on the surface of fiber mats in groups A
and B, respectively, they are more likely to detach from these scaffolds than those of
group C. Different transfection efficiency between naked plasmid and DNA/chitosan
nanoparticle explains the difference in the serum BMP-2 concentration between groups A
and B. Group B samples displayed a more sustained serum BMP-2 profile due to its
lower and more sustained release of DNA/chitosan nanoparticles from scaffolds, as
compared to naked plasmid from group A. On the other hand, in group C samples,
DNA/chitosan nanoparticles were incorporated inside fibrous scaffolds and therefore
their release were the lowest. As a result, the BMP-2 concentration of group C at the end
of the second week was the lowest. Interestingly, the concentration increased
significantly in the subsequent two weeks, suggesting that the expression of DNA from
group C samples was sustainable and lasting. Nonetheless, these observations clearly
show the advantages of groups B and C over group A for long-term performance. For
different samples in each group (A, B and C), the effects of HAp loading percentages on
serum BMP-2 concentration are not conclusive. As observed from in vitro study (Figure
5.5), the incorporation of HAp helps enhance the in vitro release of DNA or
DNA/chitosan nanoparticles from scaffolds. This in vitro observation is consistent with
the in vivo observation for groups A and C. As shown in Figure 6.3, A1 and C1 showed
BMP-2 concentrations that are lower than A3 and C3, respectively. However, over the
period of four weeks, B1 exhibited significantly higher BMP-2 concentration than B3.
Chapter 6 120
0
150000
300000
450000
600000
750000
900000
1050000
1200000
1350000
1500000
+
+
+
+
*
*
*
*
*
*
*
*
*
ALP activity level (Count/Sec)
A1
C3
C1
B1
A3
B3
week 2
week 4
ctrl
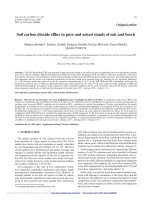
Figure 6.4 Comparison of serum ALP activity level in groups A1/A3, B1/B3 and C1/C3
over the first 4 weeks along with control. Values represent means ± S.D., n=3 (*p<0.05
as compared to control,
+
p<0.05 compared between samples).
Concurrently, ALP activity level in serum was investigated after two and four weeks after
the implantation. As shown in Figure 6.4, the control group showed a low level of ALP
activity but with a gradual increase over the period of four weeks, which was a sign of
spontaneous repair of bone defect. At the end of the second week, every sample
demonstrated significantly higher ALP level than control, in which B3 showed the
highest. This observation confirms that the healing rate of bone defects in group B is the
highest at the end of second week. However, the situation drastically changed in the
fourth week. The increase in ALP level for group A was not obvious, but significant
changes were observed for groups B and C, especially for the cases of B3 and C1. B3
showed the highest ALP level in the second week, but decreased significantly in the
Chapter 6 121
fourth week, although the level was still comparable to other samples. In contrast, C1
showed a steep increase before reaching a peak in the fourth week. ALP activity is a good
indicator for analyzing the activity of osteogenic differentiation of cytoclasts. High ALP
activity refers to high differentiation rate of cytoclasts and correspondingly high bone
healing rate. For example, B3 displayed the highest ALP level in the second week,
implying that the cytoclast differentiation rate and bone healing rate in B3 were both
higher than other samples. Consequently, good healing result for B3 was detected in the
fourth week. Similarly, C1 displayed the highest ALP activity level in the fourth week
and subsequently the fastest progress in bone healing was anticipated in the following
weeks. Similar to previous serum BMP-2 testing, the ALP results also suggest that
groups B and C offer better performances over group A on a longer term.
The X-ray micrographs of all samples after six weeks are not displayed in Figure 6.2 as
all the fractures were physically “united” then, even including the control group.
However, structural integrity is only a basic requirement for bone healing. More
importantly, the functions of regenerated bone should be verified before any conclusion
can be drawn. One can examine the callus formation by the observation of bone
fragments from H&E staining micrographs. As shown in Figure 6.5, the fragmental
defects of the control group at two and four weeks after implantation are circled in blue
for easier identification of the defects. From the micrographs, obvious callus formation
around bone defects can be seen in all samples other than control. After two weeks, some
lacunae were detected in all the samples, but only low percentages of the bone graft were
found. However, after four weeks, the percentages increased. Here, A1, B1 and C1
Chapter 6 122
obtained the highest percentages of lacunae and their defects have perfectly healed by
then. In Figure 6.6, the lacunae in A1, B1 and C1 were enlarged and compared.
Numerous osteoclast-like cells (identified by black circles) were observed to reabsorb the
trabecular bone throughout the defects at this time-point. More isolated lacunae were
observed in A1 and B1 than C1.
Figure 6.5 Histological specimens from nude mice tibias after 2 and 4 weeks of
implantation of different scaffolds (A1, A3, B1, B3, C1 and C3) along with control. Blue
arrows identify lacunae. Original magnification is 100X for all.
Chapter 6 123
Besides H&E staining, IHC staining was also performed to check the formation of blood
vessels in bone fractures. After treatment of bone fragments in liquid nitrogen for 5
minutes, both bone cells and blood vessels in fragments will be totally destructed.
Consequently, the inactive bone will only become a physical support. A successful
treatment will be marked when newly formed bone cells and blood vessels are formed in
bone fragments. Von Willebrand factor is a large multimeric glycoprotein and produced
constitutively in endothelium during blood vessel formation. The formation and growth
of new blood vessels in the bone is indicated by a brown color. Figure 6.7 shows that
minimal brown color is observed for control, while others (A1, A3, B1, B3, C1 and C3)
show non-trivial amount of the color and particularly significant for samples A1, B1, B3,
and C1. These results demonstrate that the cells in bone fragments treated by A1, B1, B3
and C1 experienced good and healthy neovascularization, allowing bone marrow stromal
cells and nutrition to facilitate the bone healing as well as to substitute the dead bone cells.
The brown-colored domains observed in samples A1, B1, B3 and C1 (see Figure 6.7)
demonstrate their ability to attract bone marrow stromal cells towards the defects and
help prepare the stromal cell differentiation. This is in concordance with the previous X-
ray and H&E staining results, in which significant bone healing is observed for samples
A1, B1, B3, and C1. Furthermore, this also confirms that during the progress of bone
healing, tissue reabsorbing/remodeling, and the in growth of blood vessel are
interactively together rather than being subsequent.
Chapter 6 124
Figure 6.6 Histological specimens from nude mice tibias after 2 and 4 weeks of
implantation of A1, B1 and C1. Black circles identify lacunae and original magnification
is 400X for all micrographs.
Chapter 6 125
Figure 6.7 Immunohistochemical specimens from nude mice tibias after 2 and 4 weeks
of implantation of different scaffolds (A1, A3, B1, B3, C1 and C3) along with control.
Original magnification is 100X for all and red arrows identify the incipient sites of blood
vessels.
Chapter 6 126
Osteoconduction refers to the ability of a material to serve as a scaffold on which bone
cells can attach, migrate, grow, and divide. In this way, the bone healing response is
"conducted" through the graft site. In this study, this function was served by the dead
bone segment fixed by intra-medullary wire. In contrast, osteoinduction refers to the
capacity of several chemicals in the body responsible to stimulate primitive "stem cells"
or immature bone cells to grow and mature, forming healthy bone tissue. HAp is an
osteoconductive material in nature. For this reason, variable HAp nanoparticle contents
are incorporated in the samples of each group (A, B, and C) to check their respective
effect on osteoconduction and osteoinduction. However, the scaffold was placed next to
the bone defect, instead of exactly in the matrix of bone defect. Furthermore, the
detachment of HAp from scaffolds and subsequent migration to bone defect may take a
long time. Due to the above two factors, the impact of osteoconduction can not be
significant. In this study, the more important role of HAp is for the controlled release of
BMP-2 plasmid. As higher content of HAp enables higher release rate of naked DNA or
DNA/chitosan nanoparticles from scaffolds, thus inducing higher tranfection and
subsequent expression of BMP-2. The results from animal experiments suggested that the
encapsulation of 10 % of HAp nanoparticles into group A and group C scaffolds did
boost up the serum BMP-2 concentrations (see Figure 6.3).
Ideally, BMP-2 plasmid/chitosan nanoparticles coated on the surface of group B scaffolds
should be more effective in transfecting cells due to their small size and positive surface
charge. However, as shown in our previous study (Nie and Wang, 2007), BMP-2
plasmid/chitosan nanoparticles tend to result in high cytotoxicity in vitro. If this
Chapter 6 127
phenomenon takes place similarly in vivo, this explains why the advantage of high
transfection efficiency was not shown over group A scaffolds during the first two weeks.
The scarce living cells were necessary and precious at the initial stage for DNA
transfection in the zone of bone defects, but high cytotoxicity of group B scaffolds
hindered the survival and proliferation of these cells. As a result, the high transfection
efficiency at the expense of cell growth could not sustain and consequently group B
scaffolds performed worse than group A scaffolds over the first two weeks. However,
with time, the migration and accumulation of osteoblast cells into the zone of defects
helped alleviate the effect of cytotoxicity and enabled high transfection and expression
level on site. As a result, group B scaffolds showed better performance (two ends of
defects were united well for samples B1, B2 and B3) after the period of four weeks, as
shown in Figure 6.2.
.
For group C, our previous study found that there was a good balance between high
transfection efficiency of DNA and acceptable cell viability (Nie and Wang, 2007). But,
as plasmid/chitosan nanoparticles were encapsulated inside the threads of fiber mats, the
plasmid was released much slower than the naked plasmid in group A scaffolds and the
nanoparticles in group B scaffolds. Consequently, the performance of group C scaffolds
was not satisfactory even after the treatment period of four weeks. In our current animal
model, the segmental defects can heal by itself in six weeks. Empirically, bone
morphogenetic protein-2 will only take its osteoinductive role in the first four weeks for
this tibia bone defect animal model (Nie and Wang, 2007, refer to Appendix A1), beyond
Chapter 6 128
which the segmental defects will gradually shift to a stage of bone remodeling. This
explains why the performance of group C scaffolds was below others.
During our observation over the period of four weeks, scaffolds of group A and B
performed relatively similar or better than group C scaffolds. In our previous study (Nie
and Wang, 2007), in vitro release (naked plasmid or plasmid/chitosan nanoparticles) of
groups A, B and C can last for 2, 4 and 8 weeks, respectively. The bone defects
investigated in the current study can heal spontaneously within six weeks, so effective
and sustained release of plasmid DNA lasting for the initial four-week period becomes
necessary for a successful treatment. In this sense, group B samples are the best
candidates to meet the essential time frame. However, if a larger critical-sized bone
defect is present, a longer release period (as in scaffolds of group C) might be more
beneficial. A follow-up study based on a critical-sized femur bone defect model is under
preparation to address this issue (refer to Appendix A2). Nonetheless, our study has
shown that the time frame of the plasmid release plays an important role for a successful
treatment of bone defects.
6.4. Conclusions
In this study, BMP-2 plasmid was successfully encapsulated into polymeric fibrous
matrices in three different ways, and their individual performance was tested in nude
mice. Residual solvent in the scaffolds was well below the safety standard requirements.
Animal experimental results indicate that the bioactivity of BMP-2 plasmid released from
Chapter 6 129
all the three kinds of scaffolds was well maintained, which helped improve the formation of
new bone and the healing of segmental defects in vivo. Groups A, B and C released DNA
or DNA nanoparticles in different ways and time frames, thus, their performances in bone
healing were not similar. Scaffolds of group A, releasing plasmid the fastest over the initial
two weeks, performed the best among all scaffolds over the first two weeks. Interestingly,
at four weeks of treatment, group B scaffolds performed better than those of group A as
DNA/chitosan nanoparticles could transfect cells more efficiently than naked DNA. The
conceptual advantages of scaffolds of group C, which releases plasmid for more than four
weeks, were not well demonstrated as the bone will heal by itself in a six-week period. To
explore this, a larger critical-sized defect will be required in the future study. Nevertheless,
our study has demonstrated that the in vivo performances of different scaffolds in bone
healing are well correlated with their in vitro release profiles of plasmid.