Applications of electrospinning and supercritical carbon dioxide foaming techniques in controlled release and bone regeneration 6
Bạn đang xem bản rút gọn của tài liệu. Xem và tải ngay bản đầy đủ của tài liệu tại đây (867.69 KB, 25 trang )
Chapter 7 130
CHAPTER 7
PLGA/Chitosan Composites from a Combination of Spray
Drying and Supercritical Fluid Foaming Techniques: New
carriers for DNA delivery
†
7.1 Introduction
In recent decades gene delivery research has grown very rapidly due to its huge potential
as a future therapeutic strategy for clinical applications. Non-viral delivery device
constructed from biodegradable polymer is preferred considering the associated safety
issues. Among the various non-viral dosage forms employed in gene delivery,
microspheres and nanoparticles are widely used because of their uniform morphology
and high transfection of cells. However, there has been growing interest recently in the
use of porous materials since they offer several attractive features, such as stable and
uniform porous structures, tunable pore size and well defined surface properties
(Thomson et al., 1996; Chen et al., 2001; Torres et al., 2007; Song et al., 2005). These
desired properties allow the encapsulation or adsorption of particular gene and releasing
it in a more reproducible and predictable manner. Moreover, porous structures can
support cells’ attachment and hold/release DNA to induce the formation of new tissue.
†
This chapter highlights the work published in H. Nie, S.T. Khew, L.Y. Lee, K.L. Poh, Y.W. Tong and
C.H. Wang. PLGA/Chitosan Composites from a Combination of Spray Drying and Supercritical Fluid
Foaming Techniques: New Carriers for Gene Delivery. J. Control. Release 129, 207-214. 2008.
Chapter 7 131
Consequently, it will degrade gradually and give 3-dimensional structural guide in the
formation and regeneration of tissue (Goldstein et al., 2001).
Therefore, combining the
concept of gene delivery and tissue engineering, porous foam has an obvious advantage
over microspheres and nanoparticles.
The potential of chitosan as a polycationic gene carrier has been explored widely in
recent years (Roy et al., 1999; Leong et al., 1998; MacLaughlin et al., 1998; Mao et al.,
2001; Roy et al., 1997; Mao et al., 1996; Richardson et al., 1999). Chitosan is a
biodegradable polysaccharide (Onishi and Machida, 1999) extracted from crustaceans
and has been shown to be non-toxic in animals (Rao and Sharma, 1997) and humans
(Aspden et al., 1997). Due to its good biocompatibility and cytotoxicity performance, it
has been widely used in pharmaceutical research and in industry as a carrier for drug
delivery. Previously, it was used as an encapsulation shell in most cases. In contrast, in
the present work, its polycationic property will be used as an additive for controlling
DNA release and adhering cells.
On the other hand, supercritical CO
2
technique is a versatile foaming tool to produce
micro-porous structures with particular pore sizes and shapes. Here, the morphology and
porosity of foams produced by supercritical CO
2
foaming can be easily altered by
changing operation parameters like pressure, temperature and gas release rate (Mikos and
Temenoff, 2000; Kim et al., 2006). In this study, the surface physical and chemical
properties of pure PLGA and PLGA/chitosan porous foams fabricated by supercritical
CO
2
foaming were investigated by SEM, XRD, FTIR, and XPS. A model DNA plasmid,
Chapter 7 132
encoding luciferase, was encapsulated into the foams and the in vitro release in
phosphate-buffered saline (PBS) medium was performed. Furthermore, the cell adhesion,
cytotoxicity and in vitro gene expression in different composition of foams were
investigated.
7.2 Materials and methods
7.2.1 Materials
Poly (
D,L
lactic-co-glycolic acid) (PLGA) containing a free carboxyl end group (uncapped)
with L/G molar ratio of 50:50 (PLGA 4A, MW=63k, IV=0.44) was purchased from
Lakeshore Biomaterials (Cat. W3066-603, AL, US). Chitosan (medium molecular weight
and 75-85% deacetylated), Phosphate-buffered saline (PBS) buffer containing 0.1 M
sodium phosphate and 0.15 M sodium chloride, pH 7.4, (used for in vitro study) were
purchased from Sigma Aldrich (St. Louis, MO, US). Dichloromethane (DCM) (Cat. No.
DR-0440) was purchased from Tedia Company Inc. (Fairfield, OH, US.). PreMix WST-1
cell proliferation assay system, PicoGreen dsDNA quantitation kit and Steady-Glo
TM
luciferase assay system were purchased from Takara Bio Inc. (Otsu, Shiga, Japan),
Invitrogen (Carlsbad, CA, US) and Promega (Madison, WI, US), respectively.
7.2.2 Plasmid preparation and loading procedure
The pIRES2-EGFP-hRluc vector expressing both enhanced green fluorescence protein
(EGFP) and Renilla luciferase reporter (hRluc) was constructed by grafting hRluc
sequence from a commercial pGL4.75[hRluc/CMV] vector (Promega, Madison, WI) onto
the backbone of a commercial pIRES2-EGFP vector with CMV promoter (BD
Chapter 7 133
Biosciences, San Jose, CA). The engineered plasmid was amplified in a transformant of
Escherichia coli and isolated from the bacteria by PureLink
TM
HiPure plasmid DNA
purification kit-Maxiprep K2100-07 (Invitrogen Corporation, US).
PLGA microparticles encapsulated with plasmid DNA were fabricated by a spray drying
method. A 10% wt/vol PLGA polymer solution using DCM as the solvent was prepared
by dissolving 1g PLGA into 10 mL of DCM. The resultant mixture was agitated by
applying vortex until a clear and homogeneous organic phase was formed. Meanwhile a
specified amount of plasmid was dissolved in DI water to form aqueous phase. After
adding the aqueous and organic phases together, the mixture was sonicated for about 10
seconds and the resultant emulsion was transferred to a Buchi 191 Mini Spray Drier
(Flawil, Switzerland). The temperature and air flow rate for spray drier were set to 70
°
C
and 700 L/h.
PLGA foams were obtained by a gas foaming method using supercritical CO
2
as the
blowing agent. A mold (interior dimensions 10mm diameter by 10mm height) were
designed, and Teflon gaskets and aluminum tape was used to seal the mold during the
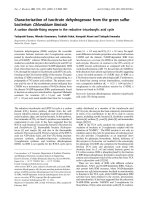
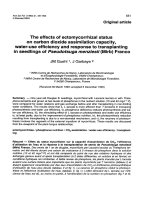
foaming process. The experimental setup is shown in Figure 7.1. Specified weight of
PLGA microparticles loaded with plasmid from the spray drier was first loaded into the
mold and sealed with aluminum tape. Several small holes were made on the top of the
mold to allow CO
2
to equilibrate with the PLGA during the foaming process. Pressure of
approximately 120 bars was used for all the experiments and the equilibrating time was 2
Chapter 7 134
hours. At the end of the experiment, the CO
2
pressure was reduced to ambient pressure at
a rate of approximately 0.05 MPa.s
-1
, and the foam was then removed from the mold.
For the PLGA/chitosan composite porous foams, the procedure is similar to the above-
mentioned PLGA foams, but with the addition of specified percentages of chitosan
crystals to plasmid loaded microparticles (pre-fabricated by spraying drying) to obtain a
uniform mixture before the foaming process. Throughout the present study, scaffolds F0,
F1 and F2 correspond to the foams with 0%, 5% and 10% of chitosan, respectively.
Figure 7.1 Schematic of experimental setup for the supercritical gas foaming system. (C1)
Refrigerating Circulator; (C2) Circulating water bath; (P1) High pressure liquid pump;
(HP) High pressure view cell; (V1) On/Off Ball Valve; (V2) Automatic back pressure
regulator with needle valve; (M) Custom-made mold inserted at the high pressure view
cell for holding the foaming samples.
7.2.3 Characterization methods
The morphology of pure PLGA foams and PLGA/chitosan composite foams was
analyzed by scanning electron microscopy (SEM) (JSM 5600LV, JEOL). The porosity of
the porous pure and modified PLGA foams was calculated by the liquid displacement
method (Zhang et al., 2008).
Briefly, the samples were cut into a disk shape (6mm
V
ent
CO
2
P1
V2
C1
C2
10mm
10mm
M
HP
V1
Chapter 7 135
diameter by 0.5mm height), and ethanol was used as a liquid medium. The foam sample
was submerged in a known volume (V
1
) of ethanol and a series of brief evacuation
repressurization cycles was conducted to force the liquid into the pores of the sample.
After these cycles the volume of the liquid and liquid-impregnated sample is V
2
. When
the liquid-impregnated sample was removed, the remaining liquid volume is V
3
. The
porosity was expressed as
Porosity = (V
1
– V
3
) / (V
2
- V
3
) x 100% (7.1)
The X-Ray Diffraction (XRD) patterns were recorded under ambient conditions on a
Shimadzu XRD-6000 with Cu Kα radiation. A diffraction range of 5-25
°
(2θ) was
selected and the XRD analysis was performed at 2
°
/min. Differential scanning
calorimetry (DSC) was employed to determine the effects of chitosan concentration on
the glass transition temperature and the decomposition temperature of PLGA. The sample
was heated from 30
°
C to 400
°
C at a constant temperature increment of 10
°
C/minute and
purged with nitrogen gas at 30 mL/min. X-ray photoelectron spectroscopy (XPS) was
performed on a Kratos Axis His instrument to characterize surface nitrogen and
phosphate species. A Mg Kα X-ray source (hv = 1253.6 eV) with an analyzer pass energy
of 40 eV was operated at 10 mA and 15 kV. All experiments presented here were
performed in an ultra-high-vacuum (UHV) chamber with a base pressure of less than 10
-9
Torr.
The encapsulation efficiency (EE) of plasmid DNA in scaffolds is defined as the
percentage of actual plasmid DNA loading to the theoretical plasmid DNA loading (Xie
and Wang, 2005) as shown in Equation (7.2):
Chapter 7 136
100
W
WWW
W
V C
EE
plasmid
chitosanPLGAplasmid
sample
waterplasmid
×
+
+
×
×
=
(7.2)
Where C
plasmid
is the plasmid concentration in the water phase of extraction; V
water
is the
volume of water phase of extraction; W
sample
is the weight of each foam sample used for
EE analysis; W
plasmid
, W
PLGA
and W
chitosan
are the weights of plasmid DNA, PLGA and
chitosan used in the foam fabrication process, respectively.
In the analysis for encapsulation efficiency, 5mg of each scaffold was dissolved in 1 mL
of DCM and 5 mL of PBS (pH 7.4) was then introduced to extract DNA. In the process
of foaming samples F1 and F2, DNA may be encapsulated into chitosan due to charge
interactions. To ensure all DNA was released from PLGA and chitosan, chitosanase from
Streptomyces griseus [lyophilized powder, Sigma Aldrich (St. Louis, MO, US)] was
utilized to degrade chitosan for the cases of scaffolds F1 and F2. The resultant emulsion
was then centrifuged at 9000rpm and 20
°
C for 20min (Hettich Zentrifugen, Universal
32R, Andreas Hettich GmbH & Co KG, Tuttlingen, Germany) to separate the water and
oil phases. The water phase was carefully collected and kept frozen at -20
°
C before the
analysis of DNA concentration using PicoGreen dsDNA quantitation kit.
7.2.4 In vitro gene release studies
The in vitro release of plasmid was carried out over a period of 65 days and the
cumulative release curve was plotted. The foams were cut into cylindrical sections (6mm
diameter by 0.5mm height), and each section was incubated at 37
°
C with 10 mL PBS
buffer in 15mL tubes. The resultant mixture was placed in an orbital shaker bath (GFL®
Chapter 7 137
1092) at 37
°
C, 120rpm. 1 mL of sample mixture was extracted at specific intervals and 1
mL of fresh media was replaced. Each sample group was tested with triplicate samples at
each interval and all the collected samples were stored at -20
°
C until the end of the
release assay. DNA concentrations in all samples were measured by PicoGreen dsDNA
quantitation kit. Similarly, to ensure that all DNA was released from PLGA and chitosan,
chitosanase from Streptomyces griseus was utilized to degrade chitosan for the cases of
scaffolds F1 and F2.
To evaluate the effects of the fabrication process (including spray drying, supercritical
CO
2
foaming, and handling of samples) on the molecular integrity of plasmid DNA,
agarose DNA gel electrophoresis was utilized to determine the integrity of plasmid DNA
released out from foams in vitro after 3 days and 30 days. DNA samples were diluted six-
fold in Blue/Orange loading dye (Promega, Madison, WI, US). An 24 μL volume of
loading buffer/sample was loaded into each well of a 1.0% agarose gel and
electrophoresis was conducted using a Bio-Rad Mini-PROTEAN III electrophoresis
system (Cat No: 165-3301 and 165-3302, Bio-Rad Laboratories, California, US) at a
constant voltage (60V) for 100 minutes with native plasmid DNA as control and high
DNA mass laddar (Invitrogen Corporation, Maryland, US) as marker. A Bio Imaging
system, Gene Genius (Syngene, UK) was used to image the gels.
7.2.5 Preparation and culture of fibroblast cells
Fibroblast cells were cultured using Dulbecco’s modified Eagle’s minimal essential
medium (DMEM) supplemented with 10% fetal bovine serum (Gibco) at 37
°
C in a 95%
Chapter 7 138
air-5% CO
2
atmosphere. The medium was changed on the 4th day of culture and every 3
days thereafter. When the cells of the first passage became sub-confluent (usually 7-10
days after seeding), cells were detached from the flask by treatment for 5 min at 37
°
C
with PBS solution of 0.25wt% trypsin and 0.02wt% ethylenediaminetetraacetic acid
(EDTA). Cells were normally sub-cultured at a density of 2 x 10
4
cells/cm
2
. Cells of the
second passage at sub-confluence were used for the subsequent experiments.
7.2.6 Cell adhesion to foams
Prior to cell seeding, all foams were sterilized by UV for 6 hours. Cells were seeded into
all the foams according to an agitated seeding method because the method was shown to
be effective in seeding cells homogenously into porous 3-D structures (Takahashi and
Tabata, 2003). Briefly, 0.5 mL of cell suspension (1 x 10
6
cells/mL) and the foam were
placed in 15mL tubes (Greiner Bio-one, Monroe, NC, US) on an orbital shaker (GFL®
1092) and agitated at 37
°
C at 300 rpm for 1-4 h. The cell-seeded foams were thoroughly
washed with PBS to exclude non-adherent cells and subjected to the subsequent
experiment.
To determine the number of cells seeded into each foam over the period of 4 hours, the
foam was washed three times with PBS, cut down with a scissors, and homogenized in
the lysis buffer (0.1M Tris-HCl, 2mM EDTA, 0.1% Triton X-100). The sample lysate (2
mL) was centrifuged at 12,000 rpm for 5 min at 4
°
C, and the supernatant was carefully
collected and kept in the ice. The total DNA intensities in all foams were determined by
Chapter 7 139
PicoGreen dsDNA quantitation kit and compared to get the relative adhesion ability of
cells to each type of foam.
7.2.7 Cytotoxicity assay of foams
Prior to carrying out any cell culture assay, foams were sterilized under UV light for 6 h
and then placed in 24-well plates (Nunclon
TM
, Roskilde, Denmark). One mL of fibroblast
cell suspension (1 x 10
4
cells/mL) was added into each well and incubated in a humid
atmosphere at 37
°
C and 5% CO
2
up to 7 days. A blank well culturing the same number
of cells under the same conditions (without foam) was denoted as a control. At specific
intervals (on the first, third, fifth and seventh day), cell viability was measured using a
standard cell proliferation assay (PreMix WST-1 cell proliferation assay system, Takara
Bio Inc, Shiga, Japan). The cell viability can be calculated by (Xie and Wang, 2006):
Cell viability (%) = (Abs test cells/Abs control cells) x 100% (7.3)
Where “Abs test cells” represents the amount of formazan determined for cells treated
with the different formulations and “Abs control cells” represents the amount of
formazan determined for untreated control cells.
7.2.8 In vitro experiment of cells transfection
The cells were seeded onto 24-well plate containing different foams at a density of 1 x
10
4
cells/well in 1 mL of culture medium. To measure the level of gene transfection of
fibroblast cells cultured at specific time after foam introduction, the cells were removed
from the incubator and treated with Steady-Glo
TM
luciferase assay system (Promega,
Madison, WI).
Assay of the luciferase
activity in the lysate of transfectants were
Chapter 7 140
performed by the
instructions of the manufacturer and the luciferase activity
was
measured with a spectrophotometer (Tecan Trading AG, Switzerland) (Li et al., 2003).
The protein concentration was determined by a Micro-BCA protein assay kit (Nie and
Wang, 2007). All transfection experiments were carried out over 7 days and performed in
triplicate.
7.2.9 Statistical analysis
All data are presented as mean ± S.D. throughout this study. Statistical analysis of the
experimental data was performed and α < 0.05 is considered as significantly different.
7.3 Results and discussion
7.3.1 DNA purity and concentration
To ensure DNA purity isolated from Escherichia coli, the absorbance ratio at the
wavelength of 260-280nm has to be maintained between 1.8 and 2.0 (Hosseinkhani et al.,
2006). The ratio for the DNA after purification by PureLink
TM
HiPure Plasmid DNA
Purification Kit was determined to be 1.9, which demonstrated that DNA purity agreed
with requirement.
7.3.2 Characterization of functionalized foams
As a dual system for tissue engineering and gene delivery, the porous structure can
provide both sufficient space for blood circulation and also large surface area for the
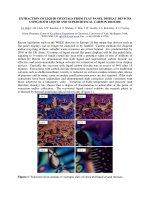
entrapment of large amount of gene. Figure 7.2 shows the typical SEM morphologies of
the sprayed PLGA powder, F0, F1 and F2. As shown in Figure 7.2a, sprayed particles
loaded with plasmid are round and smooth with a diameter of 2-10 µm. After the
Chapter 7 141
particles was sprayed through gas forming, they fused and formed a porous scaffold F0
and the corresponding 3D inter-connected porous structures were evident, but the pores
are not uniform and random in all directions (Figure 7.2b). After the incorporation of 5%
of chitosan, the pores were relatively more uniform and aligning in a particular direction
than F0 (Figure 7.2c). When the chitosan content was increased to 10%, the foam seemed
to be flower-like with all pores interconnected (Figure 7.2d). Triplicate samples for each
types of foam with a sampling size of 100 pores were measured and the average value
was used to indicate the diameter. The pore diameters of F0 and F1 fall in the range of
20.8-59.5 µm but the diameter of F2 is difficult to determine as the morphology is highly
different. Moreover, in F0 and F1, some pores are isolated from other pores. But in F2,
all pores are open and interconnected in structure. Table 7.1 shows the initial porosity of
F0 and also the foams after going through the modification of different percentages of
chitosan. The porosities of F1 and F2 are slightly higher than F0. The results confirmed
that the process of chitosan modifications on foams did slightly change the
interconnectivity of pores and create more channels in the 3-D structures. This
modification may be good for cell attachment as higher porosity may be capable of
producing larger surface area for cell adherence.
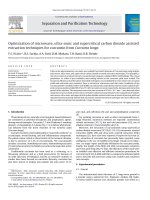
Figure 7.3a shows the DSC analysis performed for different composition of foams along
with pure chitosan powders. The DSC thermogram of pure chitosan powders exhibited an
exothermic peak centered at 300 °C. In contrast, pure PLGA foam F0 showed an obvious
endothermic decomposition peak centered at 345 ºC. F1 had a slight shift of lowered
decomposition temperature, and the decomposition peaks of F2 were obviously
Chapter 7 142
compensated by the exothermic peaks of chitosan powders. This finding proved that
chitosan powders were physically blended with PLGA in the micro-porous foam samples
after CO
2
foaming.
Figure 7.2 Morphology of plasmid loaded spray dried PLGA particles (a), pure PLGA
scaffold F0 (b), and PLGA/chitosan scaffolds F1 and F2 (c and d respectively).
Table 7.1 Elemental composition and DNA encapsulation efficiency of sprayed powders
and foams with different chitosan concentrations and porosities of foams
C
(%)
O
(%)
P
(%)
N
(%)
Encapsulation
Efficiency
(% ± SD)
Porosity
(% ± SD)
Sprayed
powders
44.91 55.09 0.00 0.00 75 ± 5 _
F0
44.91 55.09 0.00 0.00 70 ± 6 79.5 ± 2.3
F1
61.57 37.30 0.00 1.13 70 ± 4 82.0 ± 3.2
F2
60.59 37.78 0.00 1.63 71 ± 5 86.7 ± 3.1
Chapter 7 143
(a)
25 50 75 100 125 150 175 200 225 250 275 300 325 350 375 400
Temperature (
o
C )
F0
F1
F2
Chitosan crystals
(b)
5.0 7.5 10.0 12.5 15.0 17.5 20.0 22.5 25.0
Frequency ( cm
-1
)
F0
F1
F2
Chitosan crystals
Figure 7.3 DSC thermograms (a) and X-ray diffraction patterns (b) of chitosan crystals
and PLGA/chitosan scaffolds with different chitosan concentrations.
X-ray diffraction measurement was employed to examine the chitosan distribution on the
surface of foams. As shown in Figure 7.3b, the powder x-ray diffraction pattern of
Chapter 7 144
PLGA/chitosan scaffolds displayed peaks at ~10° (2θ) and 20° (2θ). The medium
molecular weight chitosan was in crystalline state and the intensity of the peak at ~20°
(2θ) was much higher than that at ~10° (2θ). When processing chitosan powder and
PLGA microparticles into foams, none of the two peaks at ~10° (2θ) and 20° (2θ) was
observed in F1 and F2. This result demonstrated that chitosan was poorly crystallized on
the surface of F1 and F2 after incorporation. Subsequent XPS study would confirm
whether chitosan was present on the surface of matrix.
Table 7.1 also shows the encapsulation efficiency results of DNA in sprayed particles and
three types of foams. It was found that supercritical CO
2
foaming and chitosan blending
had little influence on the encapsulation efficiency of DNA. This result also indicates that
in the process of foaming, the DNA pre-encapsulated inside sprayed PLGA particles can
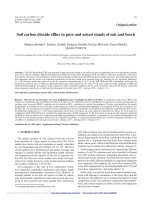
remain encapsulated in foams. As shown in Figure 7.4, significant differences in the
intensity of N1s signal were detected in sprayed particles and the 3 types of foams. No
nitrogen signals were obtained in sprayed particles and blank PLGA foam (F0). This is
reasonable as there is no nitrogen in the co-polymer of PLGA. Although there should be
nitrogen in DNA, its trace amount may not be detected by XPS. For the cases of scaffolds
F1 and F2, obvious N1s peaks were present at the binding energy of 298 eV, and the
intensity increased with increasing chitosan percentages. This observation further
confirmed that chitosan was coated on the surface of foam and this content could be
enhanced by simply increasing the weight percentage of chitosan crystals before the
foaming process.
Chapter 7 145
392 394 396 398 400 402 404 406 408
Intensity (OPS)
Binding Energy (eV) N-1s-3
Sprayed powder
F0
F1
F2
Figure 7.4 N1s high-resolution XPS spectra for chitosan crystals and PLGA/chitosan
scaffolds with different contents of chitosan.
7.3.3 In vitro release studies
Figure 7.5a shows the in-vitro DNA release profiles of the three types of scaffolds
samples F0, F1 and F2. It was observed that foam F0 released DNA plasmid faster than
the other two with a complete release in 40 days. The initial burst is attributed to the
following possible reasons: Firstly, a very small amount of DNA, adsorbed on the outer
surface of foams but undetectable by XPS, can be easily desorbed and released from the
surface; Secondly, at early times the driving force (concentration difference) of plasmid
DNA is high since its concentration in buffer solution is nearly zero at the early stage of
the release process. This leads to a fast release of plasmid DNA in the initial stage.
Lastly, some DNA loosely trapped in the mesopores could be easily released at the
beginning. The subsequent slow release following the initial burst till the end could be
Chapter 7 146
attributed to the gradual degradation of PLGA matrix. The remaining DNA entrapped
inside foams diffused out along with the degradation of PLGA matrix gradually. This
type of release profile is typical for PLGA-based delivery devices, such as microparticles
and microfibers (Xie and Wang, 2007; Nie and Wang, 2007). In contrast, the release
profiles of F1 and F2 are significantly different from that of F0. They released DNA at a
lower rate in the initial stage than F0, but a second release burst was observed at around
day 28, which could be sustained till the end of release. For the cases of F1, it released
about 60% and 30% of DNA during the first and second burst respectively. While for the
case of F2, it released about 30% and 50% of DNA during the first and second burst,
respectively. Interestingly, except the presence of the two-burst characteristic, the release
profile of F2 is relatively similar to a zero-order or linear release. This pseudo-zero-order
or linear release can’t be obtained by conventional surface modification methods (Nafee
et al., 2007; Petri et al., 2007; Kumar et al., 2004; Garcia-Fuentes et al., 2005), in which
polycationic agents are just utilized to modify pre-fabricated surface of particles, so the
polycationic agents can’t penetrate into the interior structure of matrix and consequently
the polycationic properties can’t sustain with the degradation of the matrix. As a result,
the DNA encapsulated inside particles is released as a burst. The present method ensures
that chitosan is uniformly dispersed inside the foams F1 and F2, therefore the foams can
release DNA in a controlled manner. This is advantageous over that of F0 since high
intrusion rate of plasmid DNA would not guarantee a high transfection efficiency or
expression due to the limitation of “copy number” of a particular cell line. Moreover, it
might also damage the cell membrane and thus results in a higher toxicity level.
Chapter 7 147
(a)
(b)
Figure 7.5 Accumulative in vitro release profiles of DNA from F0, F1 and F2 (a) and
electrophoretic mobility analysis of native DNA and in vitro samples released after 3
days and 30 days (b). All samples were performed on a 1.0% agarose gel and stained with
ethidium bromide. Lane 1: High DNA mass ladder; lane 2: Native plasmid DNA; lane 3:
DNA released from F0 after 3 days; lane 4: DNA released from F1 after 3 days; lane 5:
DNA released from F2 after 3 days; lane 6: DNA released from F0 after 30 days; lane 7:
DNA released from F1 after 30 days; lane 8: DNA released from F2 after 30 days.
Chapter 7 148
7.3.4 Plasmid integrity check
Following the characterization of release kinetics, it is also important to verify the
structural integrity of the released DNA. Results from agarose gel electrophoresis
demonstrated that the released DNA after 3 and 30 days retained its original structural
integrity as evidenced by the distinct bands present on the gel (Figure 7.5b). This shows
that the plasmid DNA integrity could be maintained in the course of the spray drying
process, high-pressure supercritical CO
2
foaming process, and post-processing conditions
(handling of scaffold, incubations, and lyophilization). Comparing the results for plasmid
DNA released from foams F0, F1, and F2 with the native plasmid DNA, it was also
confirmed that the addition of chitosan on PLGA matrix posed no observable side effect
on its structural integrity.
7.3.5 Cell attachment testing
Figure 7.6 demonstrates that cells prefer to attach to scaffolds F1 and F2 rather than F0.
After the first hour, number of cells in attached on F0 was comparable to those in F1 and
F2. At the following three hours, the number of cells attached on F0 did not show
significant increase. In contrast, those attached in F1 and F2 changed significantly in the
same three-hour period. The number of cells attached on F1 increased by 100%, 60%,
and 10% after 2, 3, and 4 hours of cell seeding, respectively as compared to that after just
one-hour incubation. Similarly, the number of cells attached on F2 increased by 56%,
60% and 12.5% after 2, 3, and 4 hours of cell seeding, respectively as compared to that
after just one-hour incubation. This suggests that chitosan coating on PLGA surface
Chapter 7 149
could enhance cell adherence dramatically, which is advantageous for cell growth, gene
expression, and subsequent tissue formation.
Figure 7.6 Comparison of cell attachment on F0, F1 and F2 over 4 hours (mean ± S.D.,
n=3). * Statistically different from F0 and § statistically different from F1 (α<0.05).
7.3.6 Cytotoxicity testing
Cell viability is crucial for cell growth and subsequent gene expression. As shown in
Figure 7.7a, F0 demonstrated immediate and higher cytotoxicity than F1 and F2. Blank
PLGA 4A foam F0, with -COOH group as a chain end, degrades readily with time and
causes an acidic environment around the foam, which is detrimental to the growth of
surrounding cells. This fast degradation rate demonstrated the negative effects after day 5
and they showed significant decrease of cell viability in day 5 and 7. In contrast, the high
viscosity and strength of chitosan coated on the surface of F1 and F2 might hinder and
slow down the degradation of -COOH groups. Therefore, the foam structure could be
maintained for a longer period of time and the corresponding toxic effect from
degradation products was also alleviated. As a result, the viability for F0 dropped to
Chapter 7 150
89.6% and 85.5% at day 5 and day 7, respectively. In contrast, the viability for F1 and F2
could be maintained at around 95% and 93% after 5 and 7 days, respectively.
(a)
(b)
Figure 7.7 Cytotoxicity analysis of F0, F1 and F2, with tissue culture plate as control (a)
and in vitro expression of DNA released from F0, F1 and F2 over 4 days period (b)
(mean ± S.D., n=3). + Statistically different from the TCP control, * statistically different
from F0 and § statistically different from F1 (α<0.05).
Chapter 7 151
7.3.7 In vitro transfection of fibroblast cells
After determining the DNA release profiles from different compositions of foams,
another important aspect to be investigated is the transfection to cells. As shown in
Figure 7.7b, all foams showed similar and high expression level in the first 2 days, but
the expression differentiated later. Since day 3, F0 showed significantly higher luciferase
activity than F1 and F2 (except for the case on day 4, when there was no significant
difference between F0 and F1) and the activity level increased with time till day 6. In
contrast, after 2 days of high expression, the activity in F1 and F2 decreased suddenly on
day 3, but bounced back to a higher and stable level after day 4. The similar activity level
among F0, F1 and F2 over the first 2 days should be due to the burst release of DNA
from the foams. As the amounts of DNA released from all foams are close in the very
beginning of the release, the similarity in DNA expression is expected. Similarly, it is
reasonable to obtain different expression levels among F0, F1 and F2 after day 5 because
the release rates of DNA from them are significantly different after 5 days as shown in
Figure 7.5a. The correlations between in vitro release profiles and in vitro expression data
demonstrate that the bioactivity, not just the integrity of the DNA (shown in Figure 7.5b)
released from all foams are maintained after going through the processes of spray drying,
supercritical CO
2
foaming and post-processing conditions (handling of scaffold,
incubations, and lyophilization).
As shown in Figure 7.7b, the expression level of F0 slightly decreased after day 6, while
the levels for F1 and F2 were kept constant. Meanwhile more DNA was released from F0
than F1/F2 (Figure 7.5a). This inconsistency may be due to the cytotoxicity difference
Chapter 7 152
among foams. Previously, the results of cytotoxicity study indicated that significant
cytotoxicity in F0 was demonstrated after 5 days of incubation, while F1 and F2 did not
show significant cytotoxicity. These observations may suggest that higher concentration
of DNA may help to enhance the transfection into cells, but the side-effect of cytotoxicity
may cause the death of some of these cells. Consequently, the final luciferase activity in
those cells was compromised. Henceforth, the final luciferase activity was determined by
the balance between DNA transfection intensity and cell viability. For the case of F0, a
high DNA concentration, and subsequent high transfection could not guarantee high cell
expression as it causes obvious cytotoxicity.
Another important point to note from the in vitro release testing is that approximately
99%, 70% and 50% of the DNA is released after 30 days for the foams F0, F1, and F2,
respectively. This implied that the transfection of the scaffolds F0 could not be sustained
for a long period of time like F1 and F2. In this case, scaffolds F1 and F2 were able to
release plasmid DNA until day 51 and day 60, respectively. The electrophoretic mobility
analysis of the DNA released from F0, F1 and F2 after 30 days (refer to Figure 7.5b)
showed that the DNA released from all foams could well retain their structure. Therefore,
it could be presumed that F1 and F2 would be able to maintain the structural integrity of
DNA plasmid and thus retain high transfection efficiency until the end of release.
Compared with some other surface modification methods, in which polycationic agents
are just utilized to modify pre-fabricated surface of particles, the present method can
produce positively charged surfaces, and the charge properties are obtained with the
Chapter 7 153
degradation of the matrix due to the dispersed existence of chitosan. Moreover, with the
degradation of PLGA matrix and chitosan additive, the release of DNA are controlled and
sustainable. Consequently, PLGA foams coated with chitosan showed advantages over
blank foam on cell attachment and cell viability and the in vitro expression of F1 and F2
are comparable to the blank foam F0, which may demonstrate significant potential for
clinical applications.
7.4 Conclusions
In this study, PLGA/chitosan composite porous foams were fabricated by the
combination of spray drying and supercritical CO
2
foaming techniques and the effects of
chitosan incorporation on the following factors was investigated: in vitro release of DNA,
cell attachment, cell viability and in vitro expression. The results may suggest that
PLGA/chitosan composites fabricated in this study are promising for gene delivery. The
chitosan incorporated was coated on the surface of PLGA matrix in an amorphous form.
This could help to slow down the disintegration of PLGA matrix, consequently retarding
the release of DNA from the polymer matrix. Although the release of DNA from chitosan
modified scaffold (F1 or F2) is slower than F0 significantly, its in vitro expression
(luciferase activity) is comparable to control group (F0). In addition, cell attachment and
cell viability are enhanced in the aid of chitosan coating on the PLGA matrix.
The surface of pure PLGA scaffold (F0) is negatively charged after hydrolysis. Therefore
it is difficult for negative-charge carrying cells to attach onto the surface of scaffolds. In
contrast, the incorporation of chitosan on the surface changes the charge properties, i.e.
Chapter 7 154
from negatively charged to less negatively or even positively charged. This change may
contribute to the enhanced cell attachment and subsequent cell viability.
The sustained release of DNA from F1 or F2 led to lower cytotoxicity and more sustained
expression of gene than F0. This property is favorable for gene delivery and tissue
engineering. In brief, although this type of devices require further improvement on their
standardization of pore structures and release profile, their easy fabrication and
modification process facilitate them as promising gene delivery devices.