Applications of electrospinning and supercritical carbon dioxide foaming techniques in controlled release and bone regeneration 7
Bạn đang xem bản rút gọn của tài liệu. Xem và tải ngay bản đầy đủ của tài liệu tại đây (689.76 KB, 24 trang )
Chapter 8 155
CHAPTER 8
Lysine-Based Peptide Functionalized PLGA Foams for
Controlled DNA Delivery
†
8.1 Introduction
Over recent years, DNA delivery research has become increasingly popular due to its
potential therapeutic and medicinal applications. Among various delivery devices,
microspheres and nanoparticles are the most widely used carriers in DNA delivery due to
their uniform morphology and efficacy in cell transfection (Leong et al., 1998;
MacLaughlin et al., 1998; Mao et al., 2001; Roy et al., 1997; Mao et al., 1996). There is
also growing interest in the use of porous materials as DNA delivery matrices. The stable
and uniform porous structures, tunable pore size and well-defined surface properties of
these materials allows the incorporation and release of a diversity of proteins and DNAs
in a more reproducible and predictable manner (Thomson et al., 1998; Chen et al., 2001;
Torres et al., 2006; Song et al., 2005).
Furthermore, the three-dimensional porous
structures can be easily molded into a desired shape, which can hold both DNA and cells
simultaneously, and provide an appropriate platform for the formation and remodeling of
new tissue with the degradation of the mold (Goldstein et al., 2001). Thus, porous foams
appear to have significant advantages over microspheres and nanoparticles towards
†
This chapter highlights the work published in H. Nie, L.Y. Lee, H. Tong and C.H. Wang. Lysine-Based
Peptide Functionalized PLGA Foams for Controlled Gene Delivery. J. Control. Release 2009.
Chapter 8 156
creating a DNA delivery and tissue engineering dual system. Micro-porous PLGA foams
engineered by supercritical carbon dioxide foaming technique with large, controlled pore
size and highly ordered morphology offer an intriguing channel structure for DNA
delivery and cell adhesion (Mikos et al., 1994). Furthermore, the sorption capacity and
characteristics of micro-porous PLGA foam could be substantially altered by anchoring a
variety of functional groups onto the external and internal pore surfaces. Porous PLGA
foam has been frequently used in drug and protein delivery (Hsu et al., 1996; Kim et al.,
2006). However, its application in DNA delivery has been limited, mainly due to its
negative surface charges, resulting in a strong charge repulsion that hinders the
adsorption of DNA and attachment of normal cells onto the foams. Therefore, surface
functionalization of the PLGA foam is essential to convert it to an effective DNA carrier
to hold DNA and subsequently release it in a sustained manner. PLGA/chitosan
composite foams developed in Chapter 7 show promising results in controlled release of
DNA, but the release rate of DNA and subsequent expression of target protein is too low,
especially in the initial stage (Figures 7.5a and 7.7b). Therefore, an initial and significant
release of DNA is demanded in order to optimize this kind of devices.
Lysine, an α-amino acid of chemical formula HO
2
CCH(NH
2
)(CH
2
)
4
NH
2
, pKa 10.54 and
hydrophobility of -3.9 (Civitelli et al., 1992), is a potentially good candidate as
supplement for PLGA to fine-tune its charge property and hydrophilicity for DNA
delivery purposes. The primary amine side groups of lysine can interact and form
complexes with DNA molecules. In this study, the functionalization of PLGA porous
foam matrix was accomplished using Lysine-based peptides. It was speculated that the
Chapter 8 157
functionalized foams may have different DNA loading and release profiles and thus cell
transfection level, depending on the molecular properties of the peptides being used.
Particularly in this study, PLGA porous foams were functionalized using K4 and K20
peptides and the surface physical properties of the foams were investigated using a series
of state-of-the-art techniques, such as SEM and XPS. BMP-2 plasmid was used as a
model DNA and loaded onto foams with and without surface modification. The
adsorption capacities of the foams and in vitro release of the model DNA in phosphate-
buffered saline (PBS) were studied. In addition, cell proliferation on the foams and in
vitro DNA expression were also investigated.
8.2 Materials and methods
8.2.1 Materials
Poly (
D,L
lactic-co-glycolic acid) (PLGA) containing a free carboxyl end group (uncapped)
with L/G molar ratio of 50:50 (PLGA 4A, MW=63k, IV=0.44) was purchased from
Lakeshore Biomaterials (Cat. W3066-603, AL, USA). Dichloromethane (DCM) (Cat. No.
DR-0440) was purchased from Tedia Company Inc. (Fairfield, OH, US.). Fmoc-Lys
(Boc)-OH and phosphate-buffered saline (PBS) buffer containing 0.1 M sodium
phosphate and 0.15 M sodium chloride, pH 7.4., used for in-vitro study were purchased
from Sigma Aldrich (St. Louis, MO, US). PreMix WST-1 cell proliferation assay system,
Thermo Scientific NanoDrop
TM
1000 Spectrophotometer and BMP-2 ELISA Kit were
procured from Takara Bio Inc. (Otsu, Shiga, Japan), Thermo Fisher Scientific Inc.
(Wilmington, DE, US) and R&D Systems (Minneapolis, MN, US), respectively.
Chapter 8 158
8.2.2 Preparation of foams and Lysine peptides
Blank PLGA foams were engineered based on a gas foaming method using supercritical
CO
2
as the blowing agent. All the procedures are the same as explained in Chapter 7 (see
Figure 7.1). Both peptides K-K-K-K-G (K4) and K-K-K-K-K-K-K-K-K-K-K-K-K-K-K-
K-K-K-K-K-G (K20) (where K and G represents Lysine and glycine residue, respectively)
were synthesized in-house on an automated Multipep peptide synthesizer (Intavis,
Germany). All peptides were assembled on Fmoc-Glycine resin (substitution level = 0.66
mmole/g resin) at 50 μmole scale. Stepwise couplings of amino acids were accomplished
using double coupling method with 5-fold excesses of amino acids, equivalent activator
reagents, 2-(1H-Benzotriazole-1-yl)-1,1,3,3-tetramethyluronium hexafluorophosphate
and N-Hydroxybenzotriazole, and two equivalents of base, N-methylmorpholine. The
removal of Fmoc was completed using 20% piperidine in dimethylformamide (DMF).
Cycles of deprotection, washings, double couplings, and washings were repeated until the
desired chain length was achieved. The dried peptidyl-resin was cleaved by a cocktail
solution composed of 95% trifluoroacetic acid (TFA), 2.5% deionized water, and 2.5%
triethylsilane (v/v). The crude peptide was purified using an Agilent 1100 semi-
preparative high performance liquid chromatography (HPLC) (Santa Clara, CA). The
purification was performed on an Agilent Zorbax 300SB-C18 reverse phase (RP) column
(5 μm particle size, 300Ǻ pore size, 25 x 1.0 cm) with a linear gradient of buffer A (0.1%
TFA in water) and buffer B (0.1% TFA in acentonitrile) from 10% B to 45% B in 30 min
at a flow rate of 4 mL/min. The purity of all peptides was greater than 95% by analytical
RP-HPLC and matrix-assisted laser desorption/ionization-time of flight mass
Chapter 8 159
spectroscopy (MALDI-TOF MS) on a Bruker AutoFlex II MALDI-TOF MS (Bruker,
Bremen, Germany) (data not shown).
8.2.3 Peptides conjugation
K4 and K20 were employed to study the effects of chain length and surface charges on
the adsorption and release patterns of plasmid DNA. Blank PLGA foams were sterilized
with 70% ethanol and washed thrice with excess sterilized water. To functionalize the
PLGA foams, the peptides (K4 or K20) were incorporated covalently onto the surface of
the PLGA foams using a condensation coupling method (Li et al., 1998). Briefly, the
carboxyl groups on the foam surface were first activated by 10mM of N-Ethyl-N'-(3-
dimethylaminopropyl)carbodiimide hydrochloride (EDC hydrochloride, Sigma-Aldrich)/
N-Hydroxysulfosuccinimide (NHS, Aldrich) sterilized by filtering through 0.22 μm filter
for 5 h with occasional shaking at room temperature. The foams were then washed 3
times with sterilized water to eliminate excess EDC/NHS. The peptides (K4 or K20) were
covalently immobilized onto the activated foams by immersing the foams in the peptide
solutions (0.1mM) at room temperature overnight (Khew et al., 2007). After that, the
unbound K4 or K20 was desorbed in copious amounts of PBS for 1 h at room
temperature. The resultant foams were thoroughly washed with DI water and dried in air.
8.2.4 Characterization of morphology and porosity
The morphology of samples (blank foams, F0; K4-functionalized foams, F1; K20-
functionalized foams, F2) was examined using scanning electron microscopy (SEM)
(JSM 5600LV, JEOL). The porosity of the porous pure PLGA foam and the modified
Chapter 8 160
PLGA foams was measured using a mercury intrusion porosimeter AutoPore III 9420
(Micromeritics, Norcross, GA) (Zhang et al., 2009).
8.2.5 Atomic composition of foam surface
The chemical structure and atomic composition of the blank and surface-modified foams
were characterized using X-ray photoelectron spectroscopy (XPS) (VG ESCALAB 220I-
XL; Thermo VG Scientific, UK), with the data processing performed using XPSPEAK
(Version 4.1) software. Wide scan (0-1000 eV) and high-resolution (C1s, O1s, and N1s)
spectra were acquired, respectively.
8.2.6 Plasmid preparation and loading procedures
A pT7T3D-PacI encoding BMP-2 was used in this study. The plasmid DNA was
amplified in a transformant of Escherichia coli bacteria and isolated from the bacteria by
PureLink
TM
HiPure Plasmid DNA Purification Kit-Maxiprep K2100-07 (Invitrogen
Corporation, MD, USA). The DNA concentration was determined using a Thermo
Scientific NanoDrop
TM
1000 Spectrophotometer. For saturation loading of foams with
plasmid DNA, different kinds of foams (F0, F1 and F2) were introduced into 0.5 mL of
TE buffered solution of DNA (200 μg/mL) and soaked for 24 h under constant stirring.
The foams were then dried under vacuum after quick and through washes by DI water.
8.2.7 DNA adsorption capacity on foams
Besides the atomic composition analysis, the densities of DNA attracted on different
foams were quantified. Briefly, 15 mg of each scaffold was dissolved in 0.5 mL of DCM
Chapter 8 161
and 2 mL of PBS (pH 5.0) was introduced to scaffold/DCM solution, vortexed, and
centrifuged (Hettich Zentrifugen, Universal 32R, Andreas Hettich GmbH & Co KG,
Tuttlingen, Germany) at 14,000 rpm for 3 min. The aqueous layer was collected, and two
more extraction cycles were performed to maximize DNA recovery. The water phases
were kept frozen at -20 °C until they were analyzed for DNA concentrations using
Thermo Scientific NanoDrop
TM
1000 Spectrophotometer.
8.2.8 In vitro DNA release studies
Foams were sterilized using Co-60 gamma irradiation at a dose of 15 kGy before using
for DNA adsorption, and following DNA in vitro release and cell culture studies. The in
vitro release of plasmid DNA was carried out over a period of 20 days and the cumulative
release curve was plotted. Foams of 5 mg each loaded with plasmid was added to 1 mL of
PBS (pH=7.4) and the resultant solution was then placed in an orbital shaker bath (GFL®
1092) maintained at 37
°
C and 120 rpm. The sample (0.1 mL) was extracted from the
solution at specific intervals and then topped up with 0.1 mL of fresh media. Each study
group (F0, F1 and F2) was tested in triplicate and all the collected samples were stored at
-20
°
C until the release assay. The DNA concentration in each sample was determined by
Thermo Scientific NanoDrop
TM
1000 Spectrophotometer.
To evaluate the effects of charge interaction on the molecular integrity of plasmid DNA,
agarose DNA gel electrophoresis was used to determine the integrity of plasmid DNA
released from the foams in vitro after 5 days. Release samples were diluted six-fold in
Blue/Orange Loading Dye (Promega, Madison, WI, US). A 12 μL of loading
Chapter 8 162
buffer/sample was loaded into each well of 1% agarose gel. Electrophoresis was
conducted using a Bio-Rad Mini-PROTEAN III electrophoresis system (Bio-Rad
Laboratories, CA, US) at a constant voltage (60V) for 120 min with native plasmid DNA
as control. SYBR Gold staining (Molecular Probes, Invitrogen) was employed to stain
plasmid in samples/control and Gene Genius Bio Imaging system (Syngene, Cambridge,
UK) was used to image the gels.
8.2.9 Preparation and culture of rat marrow stromal cells
The seeds of rat marrow stromal cells (rMSCs) used in the current study were donated
from the orthopaedic research center, Kaohsiung Medical University as a gift. They were
cultured in DMEM supplemented with 4mM-glutamine (Biological Industries, Kibbutz
Beit Haemek, Israel)
, 25 mM HEPES buffer, 10% fetal bovine serum (Gibco), 10U/mL
penicillin G sodium and 10 mg/mL streptomycin as Fungizone (Gibco) and incubated at
37
°
C and 5% CO
2
humid atmosphere in 75cm
2
cell culture flasks. The cells were
extracted with PBS solution containing 0.25% trypsin-EDTA (Biological Industries,
Kibbutz Beit Haemek, Israel) and normally subcultured at a density of 2 x 10
4
cells/cm
2
.
8.2.10 Cell viability assay
100 μL of rMSCs suspension (1 x 10
5
cells/mL) along with different foams were added
into wells of 96-well plates (Nunclon
TM
, Roskilde, Denmark) and incubated at 37
°
C and
5% CO
2
humid atmosphere. Blank well culturing the same number of cells under the
same conditions (without foam) was denoted as a control. At specific intervals (on the
first, second and third day), cell viability was measured using a standard cell proliferation
Chapter 8 163
assay (PreMix WST-1 cell proliferation assay system, Takara Bio Inc, Shiga, Japan). The
cell viability was calculated as following (Takashima et al., 2007):
Cell viability (%) = (Abs test cells/Abs control cells) x 100% (8.1)
Where “Abs test cells” represents the amount of formazan produced by cells treated with
the different formulations and “Abs control cells” represents the amount of formazan
produced by cells in the control.
8.2.11 In vitro experiment of cells transfection
100 μL of rMSC suspension (1 x 10
5
cells/mL) was added into wells of 96-well plates
(Nunclon
TM
, Roskilde, Denmark) and incubated for 16 h for adherence. Afterwards, the
media was aspirated from the wells and the wells were washed once with DMEM before
100 μL of new DMEM was added to each well along with different foams as described in
the cytotoxicity experiment. To measure the level of gene transfection of rMSC cultured,
the cells were washed three times with PBS, and homogenized in the lysis buffer (0.1M
Tris-HCl, 2mM EDTA, 0.1% Triton X-100). After staying in ice for 10 mins, the sample
lysate (100 μL) was centrifuged at 12,000 rpm for 5 min at 4
°
C, and the supernatant was
carefully collected and kept in the ice. To measure the expression level of BMP-2 gene,
50 µl of the supernatant was collected and the BMP-2 protein was determined by a BMP-
2 ELISA Kit (R&D Systems, US). All transfection experiments were performed at pre-
determined intervals and assayed in triplicate (Nie and Wang, 2007; Li et al., 2003).
8.2.12 Statistic analysis
All data are presented as mean ± S.D. throughout this study. Statistical analysis of the
experimental data was performed and α < 0.05 is considered as significantly different.
Chapter 8 164
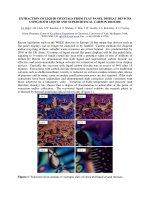
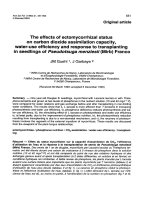
Figure 8.1 SEM images of blank foam (F0) and functionalized foams (F1 and F2).
Chapter 8 165
8.3 Results and discussion
8.3.1 Surface characterization and porosity measurement of foams
As a dual system for tissue engineering and DNA delivery, the porous structure can
provide both sufficient space for blood circulation and also extended surface area for the
entrapment of large amount of DNA. Figure 8.1 shows typical SEM morphologies of F0,
F1 and F2 and the 3D inter-connected porous structures are evident. Three foams from
the same batch were measured and the average value (with a sampling size of 100 pores)
was used to indicate the diameter. From the SEM images of F0, the pore diameters of the
foams are relatively uniform and they all fall within the range of 20.8-59.5 µm. After
conjugation of peptides, the pore shapes become irregular and the inter-connected porous
structures are modified as well. Some pores are isolated and not connected to other pores
in F0. In contrast, all pores in F1 and F2 are open and interconnected. The changes in
pore structures are ascribed to the activation of the carboxyl groups by EDC/NHS, as
similar changes in pore structures are also observed in foams treated by EDC/NHS alone,
prior to the incorporation of K4/K20. Actually the interconnectivity of blank foams is not
so good and many pores are blocked by thin membranes, as shown by the arrows in
Figure 8.1. However, the membranes are very weak and easy to be damaged by the harsh
environment imposed by EDC/NHS. The destruction of pores modifies the structures and
increases the interconnectivity of foams. Table 8.1 shows the initial porosity of F0 and
also the foams after going through the surface modifications by K4 or K20. As an
evidence of structural changes after the conjugations of peptides, the porosities of F1 and
F2 are slightly higher than F0. This result confirmed that the process of lysine
Chapter 8 166
modifications on foams did slightly change the interconnectivity of pores and create more
channels in the three-dimensional structure.
8.3.2 XPS spectra of modified surfaces
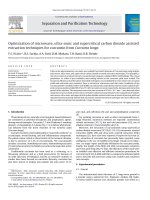
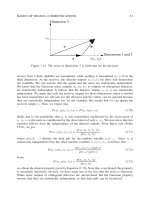
Figure 8.2a illustrates the C1s high-resolution XPS spectra of the foams before DNA
loading. The C1s spectrum of F0 shows the characteristic peak of C–C/C–H, C-O and
C=O bonds with binding energies of 284.8 eV, 287 eV and 289.1 eV respectively. In
contrast, the spectrum of F1 conjugated with K4 (Figure 8.2b) showed that the two C1s
peaks at around 284.8 eV and 287 eV were perturbed by other peaks. After peak-
deconvolution, one peak corresponding to C-N centered at 286.4 eV was observed. When
the conjugation peptide was changed from K4 to K20, significant increase of C-N peak
was detected (Figure 8.2c). The presence of C-N peak displays the successful conjugation
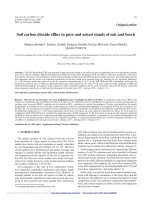
of peptides on both F1 and F2. Furthermore, the successful grafting of peptides on foam
surface was also verified by the presence of nitrogen (N1s) peaks at 397.9 eV from the
N1s high-resolution XPS spectra.
As shown in Figure 8.3a, significantly higher peaks of N1s were detected in F1 and F2
than that in F0. The N1s signal (before DNA adsorption) is directly associated with lysine
peptides, so the percentages of C-N peak areas were well correlated with the nitrogen
atomic concentration as indicated in Table 8.2. Similarly, the P2p signal is directly
corresponding to the DNA on foams (after DNA adsorption), so an additional element P
was detected on all foams after DNA loading process as shown in Figure 8.3b. The
atomic percentage of P in F0, F1 and F2 are 0.48, 2.23 and 1.89 respectively, which are
Chapter 8 167
consistent with the results of surface density analysis. As shown in Table 8.1, the most of
DNA was bound to F1 but the least of DNA was attracted onto F0.
Table 8.1 Porosity and DNA adsorption capacity of different foams
Samples Porosity
(% ± S.D., n=3)
DNA adsorption capacity
(µg DNA/mg foam)
F0: Blank PLGA 66.6 ± 3.1 1.03±0.17
F1: K4 conjugated PLGA 76.3 ± 2.9 4.32±0.13
F2: K20 conjugated PLGA 78.8 ± 2.5 3.81±0.12
Table 8.2 Atomic composition (C1s, O1s, N1s and P2p) and percentage of C1s in XPS
spectra of different foams before and after DNA adsorption
Atomic Conc. (%) Peak Ratio (%) of C1s
Samples
C1s
O1s
N1s
P2p
C-C at
284.8 ± 0.1
eV
C-N at
286.4 ± 0.1
eV
C-O at
287.0 ± 0.1
eV
O-C=O at
289.1 ± 0.1
eV
F0 66.19 33.62 0.19 46.67 27.27 26.06
F1 65.47 33.19 1.34 21.78 20.63 33.01 24.58
F2 60.54 37.56 1.90 27.42 27.38 26.88 18.32
F0/DNA 59.20 39.13 1.19 0.48 29.34 32.83 22.34 15.49
F1/DNA 59.85 32.93 4.99 2.23 49.60 13.48 23.03 13.89
F2/DNA 57.61 35.68 4.82 1.89 49.27 13.11 22.51 15.11
Chapter 8 168
(a)
292 290 288 286 284 282 280
F0
C 1s
O-C=O
C-O
C-C
Binding energy (eV)
(b)
292 290 288 286 284 282 280
C 1s
F1
C-N
O-C=O
C-O
C-C
Binding energy (eV)
(c)
292 290 288 286 284 282 280
F2
C 1s
C-N
C-C
C-O
O-C=O
Binding energy (eV)
Figure 8.2 C1s high-resolution XPS spectra for F0, F1 and F2 before DNA adsorption.
Chapter 8 169
(a)
408 406 404 402 400 398 396 394 392
N 1s
Binding energy (eV)
F0
F1
F2
(b)
140 138 136 134 132 130 128 126 124
P 2p
Binding energy (eV)
F0
F1
F2
Figure 8.3 (a) N1s high-resolution XPS spectra for F0, F1 and F2 before DNA
adsorption. (b) P2p high-resolution XPS spectra for F0, F1 and F2 after DNA adsorption.
Chapter 8 170
8.3.3 In vitro release studies
(a)
02468101214161820
0.0
0.1
0.2
0.3
0.4
0.5
0.6
0.7
0.8
0.9
1.0
1.1
Cumulative release percentage (100%)
Time (days)
F0
F1
F2
(b)
Figure 8.4 (a) DNA cumulative release curves for F0, F1 and F2 (mean ± S.D., n=3). (b)
Electrophoretic mobility analysis of naked DNA and in vitro samples released after 5
days. All samples were run on a 1% agarose gel and stained with SYBR
®
Gold nucleic
acid gel stain. Lane 1: native DNA; lane 2: DNA released from F0; lane 3: DNA released
from F1; lane 4: DNA released from F2.
Chapter 8 171
Figure 8.4a shows the in vitro DNA release profiles of different samples. It can be
observed that the release of DNA from F0 was the fastest which completed in only 7 days.
The initial burst release can be attributed to the following reasons: (1) DNA adsorbed on
the outer surface can be easily desorbed; (2) The large concentration gradient between
DNA in F1 or F2 and in buffer solution would prompt the fast release of DNA; (3) The
loosely trapped DNA in the micro pores could be easily released. As the channels in the
foam are interconnected, some interior structures within the foam could entrap and retain
DNA even after 3 times of washing. However, the release profiles of DNA from F1 and
F2 were evidently different from that of F0. While 60% of the DNA loaded on F0 was
released in a huge burst lasting for a period of two days, there were two small release
bursts observed for the case of F1 and F2, each burst release was followed by a period of
slow release profile. Compared with the release profile of F0, the release profiles of F1
and F2 are relatively linear and sustainable. The constant rate of the in vitro release
processes suggested that there exist some interactions between the entrapped DNA
molecules and the micro-porous PLGA matrix supplemented with -NH
2
functional
groups. Otherwise, the percentage release rates for F1 and F2 should be higher than F0 as
F1 and F2 have higher porosity and DNA from F1 and F2 would meet lower resistance to
diffuse due to higher interconnectivity as compared with F0.
Chapter 8 172
8.3.4 Plasmid integrity check
Following the characterization of release kinetics, the structural integrity of the released
DNA was examined. As shown from the agarose gel electrophoresis results, the released
DNA retained its structural integrity as evidenced by the distinct bands present on the gel
(Figure 8.4b). In summary, the released DNA survived both the adsorbing and releasing
processes. Moreover, it was shown that the plasmid DNA encapsulated in the different
foams was released in a supercoiled form within the time scale of 5 days,
and was independent of the types of foams (Figure 8.4b). This condensation of DNA in
size may trigger the interactions between DNA and peptides. Consequently, DNA
molecules may even penetrate into the deeper layer of K20 on foam F2 due to the long
chain of K20. For the DNA molecules penetrated into deep layer of K20, their release
was hindered by both structural entrapment and charge interactions, thus leading to the
observation of the most sustainable release of DNA for the case of F2.
8.3.5 Cell viability study
Figure 8.5 shows the cytotoxicity of different foams with the blank tissue culture plate
well as the blank and the well with free DNA as control. Generally, no significant change
was detected on all the three kinds of foams throughout the whole testing period of 3 days,
but an obvious reduction in cell viability was detected in the control group and F0 on day
2 and day 3. This finding is similar to the observation in other research group (Chun et al.,
2004). One of the reasons for the cytotoxicity in control and F0 may be attributed to the
high initial concentration in the control group and a burst release of DNA during the
initial hours from F0. Intense transfection of DNA may impose damage on cell
Chapter 8 173
membrane and lead to cell death in serious cases. As the amounts and released rates of
DNA from F1 and F2 are much lower than F0 during the first 3 days, no such kind of
negative effect on cell viability was observed. Indeed, it is reported in literature that Poly-
Lysine is toxic to cells (Fischer et al., 2003; Ahn et al., 2004). However, the lysine
peptides (K4 and K20) used in the current study are short in length and are covalently
immobilized to the foam matrix. Therefore, they are not easy to detach from the foam
surfaces. Furthermore, it is difficult to encapsulate DNA into particles and impose
obvious toxicity to cells. This statement is clearly supported by the toxicity data shown in
Figure 8.5. From all these results, it can be deduced that surface modification using
Lysine peptides does not impose significant cytotoxicity on cells.
123
0.0
0.2
0.4
0.6
0.8
1.0
1.2
1.4
1.6
Cell viability (100%)
Time (days)
blank
F0
F1
F2
Figure 8.5 Cytotoxicity analysis of pure and functionalized foams, with tissue culture
plate as control (mean ± S.D., n=3).
Chapter 8 174
8.3.7 In vitro cell transfection testing
The release device is considered ineffective if the released DNA fails to transfect the cells
or to be expressed. The foams were assessed for in vitro transfection in rMSCs and their
individual sustainability in expression of BMP-2 protein. It is shown in Figure 8.6 that
the cells cultured on all foams expressed BMP-2 in the period of 7 days. On day 1,
control and F0 demonstrated slightly higher BMP-2 concentrations than other groups, but
all the groups (control, F0, F1 and F2) showed comparable BMP-2 concentrations over
the first 2 days. This phenomenon indirectly demonstrates the existence of a saturation
state of DNA transfection. As a result, a high initial DNA concentration or a burst release
of DNA does not necessarily lead to high DNA transfection and expression. After 3 days,
the advantages of control group and F0 in BMP-2 expression vanished and the
corresponding concentration was even significantly lower than those of F1 and F2 on day
5. The decrease in BMP-2 expression for the case of the control group could be ascribed
to the cytotoxicity imposed by the high concentration of DNA as demonstrated in Fig. 8.5.
In contrast, the drop of BMP-2 expression in F0 samples should be attributed to the
synergic effects of cytotoxicity of F0 samples and their poor sustainability of DNA
release. Around 70% of the DNA entrapped in F0 is released within the first 3 days and
the following release after 3 days is negligible. Moreover, as similar to the case of control,
it might be hard for cells to survive in the environments with high concentration of DNA,
resulting in low viability and subsequent low expression efficiency. As a result, lower
BMP-2 concentrations were detected in F0 than F1 and F2 on day 5 and day 7,
respectively. Particularly, F2 presented a sustained expression of BMP-2 over the testing
period of 7 days. On day 7, the expression level in F2 was almost 1-fold higher than those
Chapter 8 175
displayed in F0 and F1. This significant enhancement and sustainability in expression
level should be attributed to the higher DNA adsorption capacity of F2 and its controlled
release lasting for longer than two weeks. The above-mentioned expression experiments
suggest that the peptide-functionalized PLGA foams could be used as a potential DNA
carrier in gene therapy, as the DNA released from the functionalized scaffolds appeared
to be stable and produced lasting gene expression in mammalian cells.
0
50
100
150
200
250
300
+
+
*
*
*
*
*
*
7
53
1
BMP-2 concentration (pg/mL)
Time (days)
F0
F1
F2
Figure 8.6 In vitro expression of DNA released from pure and functionalized foams over
7 days period (mean ± S.D., n=3). * Statistically different from F0 (α<0.05). +
Statistically different from F1 (α<0.05).
The objective of this study is to investigate some fundamental aspects of the behavior of
plasmid DNA on porous 3-D scaffolds. PLGA 4A used in this study is a hydrophobic
copolymer with carboxylic end groups, resulting in negatively charged surface after
hydrolysis. K4 and K20 were used to introduce amine groups onto the PLGA foam
surface. It was found from the study that K4- and K20-functionalized PLGA foams can
Chapter 8 176
attract more DNA than the unmodified polymer and subsequently release the loaded
DNA in a more sustained manner. The isoelectric point of DNA is approximately 5.0 and
it is negatively charged when the buffer pH is above the isoelectric point (Chargaff and
Davidson, 1955; Paget and Simonet, 1994; Khanna et al., 1998).
The electrostatic
repulsion may inhibit the adsorption of negatively charged DNA onto the blank PLGA
foam F0, which is also negatively charged. Conversely, the peptide-functionalized foams
F1 and F2 are positively charged (or less negatively charged) due to the conjugation of -
NH
2
groups. The electrostatic attraction between the negatively charged DNA and the
positively charged functionalized foam promoted the DNA-matrix interactions thus
leading to adsorption of more DNA molecules.
Although electrostatic attraction is believed to be the dominating reason for the high
uptake of DNA by F1 and F2, it may not be the only factor that influences the adsorption
of DNA. There are 4 more times of -NH or -NH
2
in K20 than in K4, but the N1s
concentrations on F1 and F2 are comparable (see Table 8.2). Moreover, the amount of
DNA attracted on F2 was lower than that loaded on F1. These observations suggest that
the molar amount of K20 conjugated on F2 was less than the molar amount of K4
conjugated on F1. This gap should be attributed to the different conformations of K4 and
K20 conjugated on foam surfaces. K4 is small in size and consequently can be closely
deployed on the foam surface. In contrast, K20 is much longer in chain length and may
therefore be conjugated onto the foam surface at a lower yield as a result of steric
hindrance and charge repulsion between chains. As less molar amounts of K20 was
conjugated on foam surfaces successfully, it is reasonable to detect lower DNA density
Chapter 8 177
on F2 than that on F1. As proved by Figure 8.4b, the plasmid DNA encapsulated in
foams was in a supercoiled form. This kind of DNA conformation may trigger the
penetration of DNA molecules into the deeper layer of K20 coating on foam F2 due to
the long chain of K20, instead of just being anchored on the top of K20 coating. This is
likely to be the reason for slower release of DNA in F2 compared with F1. In summary,
two main factors determine the adsorption efficacy of DNA onto PLGA foam surfaces:
charge interactions and conformational structure of the peptides. These two factors
determine the amount of DNA adsorbed and the subsequent release profiles.
Three-dimensional foams have been widely investigated regarding their applications in
tissue engineering and it has been proved that polymeric foams are promising candidates
for tissue engineering (Chun et al., 2004; Nie et al., 2008a; Takahashi and Tabata, 2003).
In order to optimize the surface properties, modification of polymers using a variety of
functional peptides or polymers have been extensively investigated for various
applications, such as promoting cell adhesion, creating anti-bacterial surfaces, and
modifying surface hydrophobicities (Chun et al., 2004; Yoon et al., 2002; Ernsting et al.,
2005; Yu and Shoichet, 2005; Swan et al., 2005; Lee et al., 2001; Csaba et al., 2005;
Schmieder et al., 2007). However, few have reported about Lysine-based peptides
modified foams for tissue engineering and DNA delivery. Toward realizing an effective
dual system for tissue engineering and DNA delivery, our work presents intriguing
findings which may have significant impact for tissue engineers and scientists for
improving the surface properties of PLGA, one of the most promising biomaterials, to
make it a suitable carrier for DNA.
Chapter 8 178
8.4 Conclusions
In this study, PLGA porous foams were functionalized with K4 and K20. The adsorption
capacity and release behavior of DNA were found to be highly dependent on the charge
properties of the foam surfaces. Because of the presence of ionic interaction between the
carboxyl groups of DNA and the amine groups added to the foams F1 and F2, the release
rates of DNA from the K4- and K20-functionalized foams are more sustained in
comparison to the blank foam F0. The positively charged surface of the functionalized
foams appeared to be favorable for loading DNA and displayed sustained release of DNA,
possibly due to a balance of electrostatic interaction and hydrophilic interaction between
DNA and the surface of F1 or F2. The sustained release of DNA from F1 and F2 led to
negligible cytotoxicity and sustained expression of DNA, which is favorable for DNA
delivery and tissue engineering applications. Furthermore, the fast release of DNA could
be a good supplement to the PLGA/chitosan foams developed in Chapter 7. In future
study, the two techniques investigated in Chapters 7 and 8 can be well coupled and
utilized to develop PLGA/chitosan/lysine composite foams in three steps (freeze drying,
supercritical CO
2
foaming, and lysine linkage). Certainly, more experiments on
PLGA/chitosan/lysine composite foams are demanded to verify our hypothesis.