High depth resolution rutherford backscattering spectrometry with a magnet spectrometer implementation and application to thin film analysis 4
Bạn đang xem bản rút gọn của tài liệu. Xem và tải ngay bản đầy đủ của tài liệu tại đây (2.72 MB, 89 trang )
Chapter 4 Analytical and Numerical studies of Spectrometer Ion Optics 48
_______________________________________________________________________________________________________
___________________________
Chapter 4
___________________________
Analytical and Numerical
studies of Spectrometer Ion
Optics
4.1 Introduction
In this chapter, the bending property of the spectrometer magnet is modeled with:
i. Simple analytical calculations developed using the Mathematica scientific
programming software [38] with ion trajectories within the magnet determined
using:
a. Direct construction of circular trajectories
b. Matrix-transport approach by Penner [39].
ii. Full numerical calculation of the magnetic field using SIMION software [40].
The above models adopted the actual HRBS scattering geometry and shapes of the
entrance and exit edges of the spectrometer in CIBA. The results from these models
are compared to the actual experimental data so as to ensure that the spectrometer
works as designed. All dimensions and distances in this chapter are measured in
metres.
48
Chapter 4 Analytical and Numerical studies of Spectrometer Ion Optics 49
_______________________________________________________________________________________________________
4.2 HRBS Spectrometer magnet
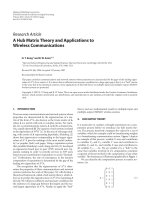
Fig. 4.1 Schematic of the HRBS spectrometer magnet.
The HRBS spectrometer magnet in CIBA is a 0.175 m double-focusing 90° sector
magnet with a straight entrance edge rotated by 26.6° and a circular exit edge of
radius 0.12569 m. The schematic is shown in Fig. 4.1. Let the origin O be the centre
of the trajectory with radius
0
ρ
= OP = OQ = 0.175 m (blue). The circular exit edge
has centre at point M with coordinates (−0.23128, −0.11239) relative to the origin.
The trajectory cuts the exit edge at Q where its tangent (dotted red) meets horizontal
OQ at an angle of 26.6º. Assuming a static magnetic field, every ion energy E has a
unique “central trajectory” with radius
ρ
given by:
Bq
mE2
=
ρ
where m = Mass of the ion, B = Magnetic flux density and q = Ion charge. The central
trajectory will be used to determine the exit point Q in the analytical calculations in
the later sections in this chapter.
O
Q
P
0.11239
0.23128
0.12569
M
β
ββ
β
1
=
26.6
°
°°
°
26.6
°
°°
°
0.175
0.175
Chapter 4 Analytical and Numerical studies of Spectrometer Ion Optics 50
_______________________________________________________________________________________________________
4.3 Overall layout of the HRBS detection system
A 90º sector magnet of radius
0
ρ
with flat entrance and exit edges that are both
rotated at 26.6º is expected to produce a stigmatic image of a point source at both
object and image distances of
0
2
ρ
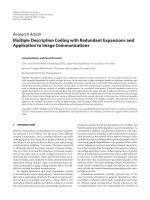
. The HRBS spectrometer and detection setup is
designed to produce a stigmatic image according to this principle. The incident beam
backscatters from the sample at S enters the magnet at P, after passing through a 2
mm collimator which defines the backscattered beam divergence. Ions following a
trajectory with a radius of
0
ρ
= 0.175 m will exit the magnet at Q and impact at the
midpoint along the MCP-FPD assembly at R, assuming that no fringe fields were
present. The target (object) distance
SP
and the MCP-FPD (image) distance
QR
are
both set at
0
2 0.350
ρ
= m to obtain a stigmatic image on the MCP.
0.100 m
0.350 m
MCP-FPD
R
O
P
0
x
0.175 m
β
ββ
β
1
β
ββ
β
2
Q
0
θ
0.350 m
S
2 mm
Collimator
0.165 m
Sample
Fig. 4.2
Overall Layout of the HRBS detection system
Chapter 4 Analytical and Numerical studies of Spectrometer Ion Optics 51
_______________________________________________________________________________________________________
4.4 Effect of curvature of spectrometer exit edge
The focal plane of the spectrometer is determined by the shape of the exit edge. Here
the effect of the curvature of the exit edge of the spectrometer on its focal plane is
investigated using a simple program written using the Mathematica software. Two
magnets, one with a flat exit edge and another with a circular exit edge, were
simulated using the actual scattering layout (Fig. 4.3).
Fig. 4.3 Focal point calculations for magnet with (a) Flat exit edge (b) Circular exit edge.
The focal points are calculated by varying the beam energy in steps of 1.4% about a central
beam energy (blue trajectory) of 475 keV through a spectrometer field of 1.0 T. The scales of
the axes are in metres.
Focal points
(b)
Entrance
edge
Exit
edge
MCP
O
O
Focal points
(a)
Entrance
edge
Exit
edge
MCP
Chapter 4 Analytical and Numerical studies of Spectrometer Ion Optics 52
_______________________________________________________________________________________________________
The origin O of the x-y axes is set at the centre of the trajectory with radius of
0
ρ
, and
a point source of ions is assumed to be at an object distance of
0
2
ρ
. Lines are drawn
to simulate the envelope of a beam with the maximum angular divergence allowed by
the 2 mm collimator between the target and the magnet entrance. The circular
trajectories within the magnet with radii
ρ
corresponding to ion energy E as given by
the relationship in section 4.2 are then drawn so that the incident beam envelopes are
tangential to the trajectories at the magnet entrance edge. Similarly, exit beam
envelopes outside the magnet are drawn as straight lines that are tangential to their
respective circular trajectories at the exit edge. The details of the trajectory
constructions are given in the description of Direct analytical calculations in section
4.5.3. The intersections between the exit beam envelopes are then assumed to be the
focal point for that particular energy. Focal points for varying ion energy E are then
plotted out at a fixed field strength B.
Fig. 4.3(a) and (b) show the focal point plots for magnets with flat and circular exit
edges respectively. The focal points for the flat exit edge lies along a line with a
significant slope relative to the x-axis, while the focal points for the circular exit edge
follow a line that is essentially parallel to the x-axis at a distance of
0
2
ρ
, where the
plane of the MCP is located. In effect, the curvature of the exit edge tilts the focal
plane of the flat edge so that it becomes parallel to the x-axis and the design of the
detection setup places the MCP along that plane. To conclude, this simple study has
shown that both the curvature of the HRBS spectrometer exit edge and the placement
of the MCP are correct: the circular exit edge of the spectrometer creates a focal plane
parallel to the x-axis where MCP is placed.
Chapter 4 Analytical and Numerical studies of Spectrometer Ion Optics 53
_______________________________________________________________________________________________________
4.5 Analytical studies of spectrometer ion optics
Introduction
In the last section, focal points are calculated at the intersection of the beam envelopes
in order to plot out the focal plane. Here, we study the intersections of the exit beam
with the MCP at varying beam energy E. Since the FPD determines the energy of an
ion according to the ion’s position of incidence along its length after exiting the
magnet, all calculations are based on the projection of the ion beam onto the median
(x-y) plane. The calculations are performed for various E so as to sweep the ion
incidence position across the length of the MCP to study the behaviour of the position
of the beam incidence along the MCP as the beam energy is varied.
Analytical calculations using two different approaches were adopted for the
trajectories within the magnet: the Direct and the Matrix approach. Both of these
approaches calculate the ion trajectories before and after the magnet, as well as the
beam incidence position along the MCP, in the same manner. The only difference
between the approaches is the calculation of ion trajectories within the magnet. The
Direct approach constructs circles as the ion trajectories in the similar manner as
section 4.4, correcting for the rotated entrance edge and beam divergence. The Matrix
approach uses a matrix-transport theory developed by Penner [39] to calculate the exit
beam parameters, given the entrance parameters. The matrix was developed also by
considering circular trajectory construction, but with first-order approximations for
small-divergence beams in order to simplify the calculations. These two approaches
will be separately described in detail, and their results compared with the SIMION
numerical modeling and the experimental results.
Chapter 4 Analytical and Numerical studies of Spectrometer Ion Optics 54
_______________________________________________________________________________________________________
45
°
65
°
20
°
2w
0.5 mm
0.5 mm
4.5.1 Beam entry parameters
The backscattered ion beam entering the magnet is calculated in the same manner in
both Direct and Matrix calculations. The ion beam was assumed to have incident on a
target tilted at 45° with IBM geometry (Fig. 4.4), which conforms to the experimental
conditions of a HRBS calibration process. The incident beam spot size on the target is
1×1 mm as seen along the target normal. Particles backscattered at a scattering angle
of 65° will form a beam of half-width
3
0.5 10 sin20
w
−
= ×
(metres) that will
subsequently be collimated by a 2 mm collimator placed between the target in the
scattering chamber and the magnet entrance.
Fig 4.4 Schematic of the incident and backscattered beam profiles
Fig. 4.5 Finite backscattered beam profile and point source approximation
Non – Rotated
Magnet entrance
Incident Ion
Beam
0.185 m 0.165 m
2w
2 mm Collimator
S
′
′′
′
Sample
d
0
θ
0
x
45
°
Chapter 4 Analytical and Numerical studies of Spectrometer Ion Optics 55
_______________________________________________________________________________________________________
The total distance between the beam spot on the target and the magnet entrance is
0.350 m, and the collimator is 0.165 m from the magnet entrance, as shown in Fig. 4.5.
Due to the finite size of the incident beam, the outermost ions of the incident beam
form cone-shaped envelopes that represent the maximum possible divergence of the
backscattered beam (blue) through the collimator. The union of all such envelopes
therefore determines the overall entry beam envelopes of the backscattered ions into
the magnet, as shown in Fig. 4.5. It can be shown that a point source at point
S
′
at a
distance d from the magnet entrance will form maximum-divergence envelopes (red)
that exactly contain all envelopes formed by the finite incident beam. The point beam
at
S
′
was therefore used as an equivalent of the finite beam in both Direct and
Matrix calculations. By similar triangles, we have
(
)
(
)
0.350 0.001 0.165
0.001
0.165 0.350 0.001
w
w
d
d d w
+
= ⇒ =
− − +
4.5.2 Fringe field correction
The fringe fields cause additional bending of the ion trajectories before the entrance
edge and after exit edge. We can account for the bending properties of the fringe
fields along the median plane for our analytical calculations by assuming that the
fringe field extends outward equally at the entrance and exit edges. This can be
approximated to the first order by assuming that the magnet is physically larger by a
distance of f at both edges as shown in Fig. 4.6, while retaining the sharp drop-off
model for the static magnetic field between the magnet poles.
Chapter 4 Analytical and Numerical studies of Spectrometer Ion Optics 56
_______________________________________________________________________________________________________
The distance f was adjusted so that the analytical calculations agree with SIMION
results obtained for an ion of energy E
0
passing through the magnet of field strength
0
B
and hitting the MCP at point R at the exact midpoint of its length. This step
normalized both approaches to the single data point at R, and is justified since our
only interest is to know how all other ion trajectories behave relative to the beam that
hits the MCP at R. The size of the magnet increases and the origin is shifted from O to
O′. The equation of the exit edge is therefore:
( ) ( ) ( )
2 2 2
0.23128 0.11239 0.12569
x f y+ + + + =
The MCP-FPD plate is along the plane:
0.350
y f
= − +
The equivalent point source
S
′
is now closer to the entrance with coordinates:
( ) ( )
, , 0.175
S Sx Sy S d f f
′ ′
′ ′
= − +
Fig. 4.6
Layout of the fringe field correction
0.350 m
0.175 m
0
x
1
x
0
θ
O
′
d
MCP-FPD
S
′
′′
′
R
f
f
O
Chapter 4 Analytical and Numerical studies of Spectrometer Ion Optics 57
_______________________________________________________________________________________________________
4.5.3 Direct calculations
Entry parameters
A point source at
( )
,
S Sx Sy
′
′ ′
produces two lines which are the “top” and “bottom”
beam envelopes that define a beam divergence of
2
θ
, as shown in Fig. 4.7.
Fig. 4.7 Schematic of backscattered beam envelopes from point source
The top and bottom envelopes have equations
[
]
tan tan
y x Sy Sx
θ θ
′ ′
= − + +
and
[
]
tan tan
y x Sy Sx
θ θ
′ ′
= + −
respectively, while the equation of the entrance edge is given by
(
)
( )
cot 26.6 0.175
y x f
= − + +
Solving these equations yields respectively the points of intersection
(
)
,
t t t
P Px Py
and
(
)
,
b b b
P Px Py
of the top and bottom envelopes with the entrance edge.
Trajectories within magnet
Circles are drawn within the magnet as trajectories for the top and bottom envelopes
so that each envelope is a tangent to its respective circle. Since the envelopes are fixed,
the circles have to be shifted to account for the tilt in entrance edge, as well as the
gradient of the envelopes. We start with a central trajectory (red) in Fig 4.8 with
S
′
26.6
°
θ
(
)
,
P Px Py
(
)
,
b b b
P Px Py
(
)
,
t t t
P Px Py
Bottom envelope
Top envelope
Entrance
edge
Chapter 4 Analytical and Numerical studies of Spectrometer Ion Optics
58
_______________________________________________________________________________________________________
radius
ρ
and centre at
(
)
0 , 0.175 f
ρ
+ −
where a horizontal beam with zero
divergence forms a tangent at point
(
)
0
,
P Px Py
at the topmost point of the circle. The
central trajectory is then separately shifted to form the top (violet) and bottom (green)
trajectories such that their uppermost points are
(
)
,
t t t
P Px Py
and
(
)
,
b b b
P Px Py
respectively.
Fig. 4.8
Schematic of translations of central trajectory due to slanted entrance edge.
The translations for the top and bottom trajectories are therefore given by:
(
)
(
)
{
}
,
t t
x x Px Px y y Py Py
→ + − → − −
and
(
)
(
)
{
}
,
b b
x x Px Px y y Py Py
→ − − → + −
respectively. However, these translated circular trajectories have horizontal tangents
at
t
P
and
b
P
, and do not take into account the beam divergence angle. An additional
transformation is required on the trajectories so that the incident envelopes become
their respective tangents. This is accomplished by translating the circles yet again so
that the points
t
P
and
b
P
coincide with the specific parts of the circle with the same
gradients as the top and bottom envelopes respectively, as illustrated in Fig. 4.9.
Top envelope
Bottom
envelope
(
)
,
t t t
P Px Py
(
)
0
,
P Px Py
(
)
,
b b b
P Px Py
Top
trajectory
Bottom
trajectory
Central
trajectory
Chapter 4 Analytical and Numerical studies of Spectrometer Ion Optics
59
_______________________________________________________________________________________________________
Fig. 4.9
Schematic of trajectory transformations due to beam divergence
The additional transformations required are:
Top:
(
)
{
}
sin , 1 cosx x y y
ρ θ ρ θ
→ + → − −
Bottom:
(
)
{
}
sin , 1 cosx x y y
ρ θ ρ θ
→ − → − −
Hence the final equations of the top and bottom circular trajectories constructed
within the magnet are:
( )
( )
( )
( )
2 2
2
sin 0.175 1 cos
t t
x Px Px y f Py Py
ρ θ ρ ρ θ ρ
+ − + + − + − − − − − =
and
( )
( )
( )
( )
2 2
2
sin 0.175 1 cos
b b
x Px Px y f Py Py
ρ θ ρ ρ θ ρ
− − − + − + − + − − − =
respectively.
ρ
ρρ
ρ
ρ
ρρ
ρ
θ
θ
Top
envelope
Bottom
envelope
sin
ρ θ
sin
ρ θ
(
)
1 cos
ρ θ
−
Chapter 4 Analytical and Numerical studies of Spectrometer Ion Optics 60
_______________________________________________________________________________________________________
Exit parameters and MCP incidence
The equation of the magnet exit edge is:
( ) ( )
2 2
2
0.23128 0.11238 0.12569
x f y+ + + + =
Solving the top and bottom trajectories with the above exit edge equation yields the
respective exit points
(
)
,
t t t
Q Qx Qy
and
(
)
,
b b b
Q Qx Qy
. The gradients
t
G
and
b
G
of
the top and bottom exit beams are determined from the gradient of the radius vector
joining the exit point and the centre of the trajectory:
( )
( )
( )
( )
1
0.175 1 cos
sin
t t
t
t t
f Py Py Qy
G
Px Px Qx
ρ ρ θ
ρ θ
−
+ − + − + − −
= −
− − − −
( )
( )
( )
( )
1
0.175 1 cos
sin
b b
b
b b
f Py Py Qy
G
Px Px Qx
ρ ρ θ
ρ θ
−
+ − − − + − −
= −
− + −
The equations of the exit beams are therefore:
(
)
t t t
y Qy G x Qx
= + −
and
(
)
b b b
y Qy G x Qx
= + −
for the top and bottom exit beams respectively. These are then solved with the MCP
equation given by
{
}
0.350 , 0.225 0.125
y f x= − + − ≤ ≤ −
The domain is limited to ± 50 mm from the centre of the MCP at
(
)
0.175, 0.350
− −
,
due to its finite physical length along that plane. The beam-incidence centroid is
assumed to be the midpoint between the intersection points along the MCP and are
plotted out and compared to results from the Matrix and Numerical calculations as
well as the experimental data at the end of this chapter. The layout of the Direct
calculations is shown in Fig 4.10.
Chapter 4 Analytical and Numerical studies of Spectrometer Ion Optics 61
_______________________________________________________________________________________________________
Fig. 4.10
Layout of the Direct calculations in Mathematica.
4.5.4 Matrix calculations
Introduction
First-order bending and focusing properties of magnetic deflection systems had been
extensively investigated in the 1950s and 1960s. Simplifications to calculations of ion
trajectories were beneficial in those days as personal computers were not readily
available for such analyses, and analytical equations with closed form were developed
so that analyses could be performed “by hand”. In particular, discussions had been
made on the conditions for double-focusing in sector-shaped magnetic spectrometers
with uniform fields [41 − 43]. Ion trajectories are constructed using the sharp drop-off
model of the field at the magnet edges, and the conditions for a stigmatic image in
Envelopes
Exit
beams
MCP
O
′
′′
′
S
′
′′
′
Trajectories
Chapter 4 Analytical and Numerical studies of Spectrometer Ion Optics 62
_______________________________________________________________________________________________________
β
ββ
β
2
0
θ
θθ
θ
θ
θθ
θ
β
ββ
β
1
Central
Trajectory
Calculated
Trajectory
0
x
x
α
αα
α
O
both the vertical and the median planes are determined from the geometry of the
trajectories. Properties of such magnetic systems are simplified using a matrix
approach as described by Penner [39], and this was adopted for our Matrix
calculations of ion trajectories in the HRBS spectrometer.
Fig. 4.11
Schematic of Matrix approach by Penner
In Penner’s approach, circular trajectories of ions were constructed within the median
plane of a bending magnet with a static, uniform field. The geometry of the setup is
shown in Fig. 4.11. The central trajectory is one that is perpendicular to both (non-
rotated) entrance and exit edges for a particular ion energy. An ion having momentum
p
travels along a circular trajectory of radius
ρ
with its entrance and exit points
subtending an angle
α
about the centre O. Another ion entering the magnet with
momentum
ppp
∆
+
=
' at a small angle
0
θ
and displacement
0
x
relative to the
central trajectory will exit the magnet at an angle
θ
and displacement
x
with its
momentum unchanged in magnitude. A matrix approach was then developed to obtain
the exit parameters
x
and
θ
for every set of entrance parameters
0
x
and
0
θ
. The
effects of rotated (flat) entrance and exit edges by angles
1
β
and
2
β
respectively were
incorporated into the matrix. Stable, well-collimated ion beams have small angular
and momentum spreads, as well as small cross-sectional dimensions as compared to
the bending radius of the spectrometer magnet. First order effects will dominate for
Chapter 4 Analytical and Numerical studies of Spectrometer Ion Optics 63
_______________________________________________________________________________________________________
such ion beams and higher-order effects may be ignored. By considering the geometry
of the setup with first-order small angle approximations, the exit parameters of the
calculated ion trajectory can be obtained by the relation:
( )
0
1 2 0
p
p
x x
M
ρ
ρ
θ α β β θ
∆
∆
=
, ,
where
(
)
( )
( ) ( )
( )
( )
( )
1
1
1 2 1 2 2
2
1 2 2
cos
sin 1 cos
cos
1 tan tan sin cos
sin 1 cos tan
cos cos
0 0 1
M
α β
ρ α ρ α
β
β β α β β α β
α α β
ρ β β β
−
−
− − − − −
= + −
+
The fractional change in momentum of the ion
pp
/
∆
is equal to the fractional change
in the ion trajectory radius in the magnet
ρ
ρ
/
∆
, and in our case, 0
=
∆
=
∆
ρ
p
. The
same layout as the Direct calculations (Fig. 4.10) is used here.
Entry parameters
The framework developed in 4.5.1 is adopted here in order to obtain the entry
parameters. From Fig. 4.5 we obtain:
0
165
d f
x
d
−
=
−
and
1
0
1
tan
165
d
θ
−
=
−
Determination of
α
αα
α
,
1
β
ββ
β
and
2
β
ββ
β
The matrix M requires the determination of three variables for every ion energy E:
α
,
1
β
and
2
β
. The angle
α
of an ion with energy E was calculated by finding the
Chapter 4 Analytical and Numerical studies of Spectrometer Ion Optics
64
_______________________________________________________________________________________________________
coordinates of the entrance and exit points of the central trajectory of radius
ρ
from a
horizontal beam of zero divergence. Consider the case of
0
ρρ
< in Fig. 4.12.
Fig. 4.12
Layout of the calculation for entrance parameter
α
Let O be the origin and
0 0
P Q
be the trajectory for an ion with radius
0
0.175
ρ
= . All
horizontal backscattered beams enter the magnet at the same point
(
)
0
0, 0.175
P f
+
regardless of the energy of the ion. An ion of energy E has a trajectory
0
P Q
of radius
ρ
and centre at
(
)
1
0, 0.175O f
ρ
+ −
. The tangent of the exit edge of the magnet
(red) at Q meets the y-axis at T. The equation of the trajectory
0
P Q
is:
( )
2
2 2
0.175x y f
ρ ρ
+ − + − =
while the equation of the circular exit edge of the magnet is as before:
( ) ( ) ( )
2 2 2
231.28 112.39 125.69
x f y+ + + + =
with the centre at
(
)
(
)
, 231.28 , 112.38
M Mx My M f= − − −
. The appropriate
solution of the above two equations gives us the exit point
(
)
,
Q Qx Qy
. The angle
α
was then calculated from the coordinates of
Q
and
0
P
with
β
2
(
)
0
0, 0.175
P f
+
Q
φ
O
0
Q
T
α
(
)
1
O 0, 0.175 f
ρ
+ −
ρ
M
0.12569
Chapter 4 Analytical and Numerical studies of Spectrometer Ion Optics
65
_______________________________________________________________________________________________________
0
1 1
O OP Q
ρ
= =
⇒
⇒⇒
⇒
0
2 sin
2
P Q
α
ρ
=
,
where
0
P Q
is the length of the chord joining
0
P
and Q
.
We therefore have
0
1
2sin
2
P Q
α
ρ
−
=
The magnet entrance edge is straight, and since all ions enter horizontally at
0
P
,
1
β
= 26.6°
The exit edge rotation angle
2
β
is defined as the angle between the actual exit edge
and the trajectory radius vector
1
O
Q
at the exit point Q. In this case
2
β
is given by
∠
1
O QT
, where
QT
is the tangent of the circular exit edge at the ion exit point
(
)
,
Q Qx Qy
. Using the gradient of the exit edge radius vector
M Q
, we have
0.11238
tan
0.23128
Qy My Qy
Qx Mx Qx f
φ
− +
= =
− + +
1
2
0.11238
tan
0.23128
Qy
Qx f
β α φ α
−
+
⇒ = − = −
+ +
Correction to exit parameters due to circular exit edge
Once the parameters
α
,
1
β
and
2
β
were established, the matrix M provides us with
the exit parameters x and
θ
given the entry parameters
0
x and
0
θ
. We note that all
entry and exit parameters are expressed relative to the unique central trajectory
0
P Q
for every ion energy E. However, the original matrix approach assumed that the
rotated exit edge is flat, not circular. Due to the small magnitudes of
0
θ
and
θ
, the
effect of the curvature of the real exit edge may be significant. Hence a correction is
developed here for the exit parameter
θ
due to the exit edge curvature.
Chapter 4 Analytical and Numerical studies of Spectrometer Ion Optics
66
_______________________________________________________________________________________________________
Fig 4.13
Schematic of the circular edge corrections to
θ
.
Schematically shown in Fig. 4.13, the original derivations assumed a straight rotated
exit edge at the point of exit Q for an ion of energy E and subtending an angle of
α
.
This edge is the tangent
tS bS
Q Q
of the exit edge at Q that makes an angle of
φ
with
the vertical at T. However, the true magnet edge
tC bC
Q Q
is circular, causing the beam
envelope to be bent more on either side of Q. The top and bottom beam envelopes on
each side of the central trajectory travel additional distances of
tS tC
Q Q
and
bS bC
Q Q
respectively, which are equal to the first order. The arc lengths
tC
Q Q
and
bC
Q Q
were
also assumed to be approximately equal in lengths as
tS
Q Q
and
bS
Q Q
respectively.
Since
θ
is small and the radius of the exit edge is 0.12569 m,
2
sec
bC bS
Q Q Q Q x
β
≈ = and
2
sec
0.12569 0.12569
bC
bC bS
Q Q
x
β
Q Q Q∠ = ≈
for the top envelope, which will then give us the angular correction factor to
θ
:
2 2
2 sec sec
2
sin sin
2 0.25138
bC bS bS bC bS
x x
Q Q Q Q Q QQ
β β
ϕ
ρ ρ ρ
∠
= = =
The adjusted
θ
for the top and bottom envelopes are therefore
t
θ θ ϕ
= +
and
b
θ θ ϕ
= −
φ
φφ
φ
T
1
O
α
αα
α
β
ββ
β
2
Q
x
x
tS
Q
tC
Q
bC
Q
bS
Q
θ
θθ
θ
Top
trajectory
Bottom
trajectory
Central
trajectory
θ
θθ
θ
Chapter 4 Analytical and Numerical studies of Spectrometer Ion Optics
67
_______________________________________________________________________________________________________
Position of ion incidence along MCP
Fig. 4.14
Schematic of exit beam calculations
The exit parameters x,
t
θ
and
b
θ
allow us to find the equations of the straight exit
beams of the trajectories outside the magnet. Consider the case where
0
ρ ρ
<
in Fig.
4.14. Since the exit point
(
)
,
Q Qx Qy
of the central trajectory has already been
determined, the exit points
(
)
,
t t t
Q Q x Q y
and
(
)
,
b b b
Q Q x Q y
of the top and bottom
trajectories are calculated in relation to Q:
(
)
(
)
sin
t
Q x Qx x
α
= −
,
(
)
(
)
cos
t
Q y Qy x
α
= +
(
)
(
)
sin
b
Q x Qx x
α
= +
,
(
)
(
)
cos
b
Q y Qy x
α
= −
Since the distances
tS tC
Q Q
and
bS bC
Q Q
are insignificant as compared to
sin
x
α
and
cos
x
α
, we can ignore the distinction between points on the circular or flat edge in
this case and assume for simplicity that all exit points are along the straight line
tangential to Q, dropping the subscripts S and C. The equations of the exit beams are:
Top:
(
)
(
)
(
)
(
)
tan tan
t t t t
y x Q y Q x
α θ α θ
= + + − +
Bottom:
(
)
(
)
(
)
(
)
tan tan
b b b b
y x Q y Q x
α θ α θ
= − + − −
b
θ
t
θ
α
α
b
α θ
−
t
α θ
+
Q
t
Q
b
Q
x
x
Central
trajectory
Bottom
trajectory
Top
trajectory
Chapter 4 Analytical and Numerical studies of Spectrometer Ion Optics
68
_______________________________________________________________________________________________________
In a similar manner to the Direct equations, the exit beam equations are then solved
with the MCP equation 0.350
y f
= − +
with
0.225 0.125
x
− ≤ ≤ −
and the beam-
incidence centroid is the midpoint between the intersection points along the MCP.
4.5.5 Comparison of results from Direct and Matrix calculations
The results of the Direct and Matrix calculation are shown in Fig 4.15.
Fig. 4.15
Plot of the distance from the centre of the MCP vs epsilon, defined as the ratio of
the ion energy E and the energy
0
E
of the ion which hits the midpoint along the MCP.
The results from the Direct and Matrix calculations show almost perfect agreement,
which is as expected as they have almost the same structure. Both calculations solve
for the entrance and exit points (P and Q) by using a circular trajectory of radius
ρ
for every ion energy E. The main difference between them is the first-order small
angle approximations made in matrix M by assuming that the beam divergence is
small, which is indeed the case in the HRBS detection setup.
-0.04
-0.03
-0.02
-0.01
0
0.01
0.02
0.03
0.04
0.05
0.9 0.95 1 1.05 1.1
Epsilon = E / E
0
Distance from centre of MCP (m)
Direct
Matrix
Chapter 4 Analytical and Numerical studies of Spectrometer Ion Optics
69
_______________________________________________________________________________________________________
4.6 Numerical simulation of ion trajectories using SIMION
Overview
SIMION 3D version 7.0 ion optics simulation program [40] had been used to perform
numerical simulation of the ion trajectories through the spectrometer magnet. The
program allows for exact shape of the magnetic pole pieces to be drawn within a
virtual 3-dimension grid-like universe. Due to the fact that both the divergence and
curl of static magnetic fields in vacuum are zero, the program was allowed to assign
magnetic scalar potentials to every non-pole grid point. Numerical solutions to
Maxwell’s equations were then obtained by computing potential gradients at every
point within the grid. Alpha particles were “created” at a particular starting point and
assigned a starting energy E. Their subsequent trajectory were determined by
calculating the potential gradients and hence the magnetic forces along the x,y and z
directions at the ion’s position at every time step. A fourth-order Runge-Kutta
algorithm was then used to perform numerical integration needed to obtain the ion’s
trajectories for various values of E, and the corresponding positions of ion incidence
onto the MCP are recorded and compared to the experimental data.
4.6.1 Drawing the magnet
The program simulates a 3-dimensional universe called workbench that is divided into
grids. The centre of each grid cube is known as a grid point, while the separation
between 2 adjacent grid points is known as a grid unit. Grid points are divided into 2
types: electrode points and non-electrode points. The size of the workbench was first
defined, followed by the drawing out of the exact shape of the magnetic pole pieces
(known as electrodes within SIMION). Drawing a pole piece is done by deciding the
Chapter 4 Analytical and Numerical studies of Spectrometer Ion Optics
70
_______________________________________________________________________________________________________
set of grid points to be defined as electrode points, while the rest of the grid points are
designated to be non-electrode points.
Fig. 4.16
3-dimensional isometric view of the workbench with a magnified view of the
spectrometer magnet. One of the pole pieces was cut to show the ion trajectory between the
pole pieces.
Fig. 4.17
Blown up view of the exit edge along the x-y plane. The black squares are
electrode points, while the green circles are non-electrode points. The intersection of the solid
lines is the exit point for ions following the trajectory with radius equal to the magnet bending
radius.
Straight
entrance edge
Circular
exit edge
x
y
z
Chapter 4 Analytical and Numerical studies of Spectrometer Ion Optics
71
_______________________________________________________________________________________________________
The exact shape of the HRBS spectrometer magnet was drawn using a geometry file
where exact geometrical shapes were drawn using its in-built definition language. The
pole pieces were separated by 18 mm, while their thicknesses were drawn out to be 40
mm. The exact thickness along the z-direction was not simulated because only the
shape and the magnetic potential at their boundaries define the magnetic field between
them. The inner boundary edges are filed at an angle of 45° at both the magnet
entrance and exit.
4.6.2 Maxwell’s and Laplace’s equations
The general Maxwell’s equations for electric and magnetic fields in vacuum are
e
ρ
=⋅∇ E
0
=
⋅
∇
B
t
∂
∂
−=×∇
Β
Ε
t
∂
∂
=×∇
E
B
00
εµ
For static fields in regions not containing any electrical charges, these equations
reduce to
0
=
⋅
∇
E
0
=
⋅
∇
B
0
=
×
∇
Ε
0
=
×
∇
B
Since both curls are zero, we can express both E and B in terms of scalar potentials:
E
V
−∇
=
E
B
V
−∇
=
B
Because both divergences are also zero, we arrive at the Laplace’s equations
0V
E
2
=∇ 0V
B
2
=∇
whose solutions are Harmonic functions. Since only magnetic fields were involved in
our case, the subscripts are dropped and V refers to the scalar magnetic potentials.
Gauss’s Mean Value Theorem for harmonic functions requires that the value V of a
Chapter 4 Analytical and Numerical studies of Spectrometer Ion Optics 72
_______________________________________________________________________________________________________
harmonic function at any point to be equal to the arithmetic mean of its values on the
surface of a closed region containing that point. There are no local maxima or
minima for the solutions, the magnetic potential gradients vary smoothly along all
directions at all points.
4.6.3 Refining the magnet array
All electrode points within a single magnetic pole piece share the same magnetic
potential. A non-zero potential was chosen for the north pole at the top while the
potential of the south pole at the bottom was set at zero. These electrode potentials
form the Dirchlet boundary condition which ensures the uniqueness of the harmonic
solutions to Laplace’s equation. All non-electrode points outside the poles begin with
their potentials set at zero.
The next step was to solve the Laplace’s equation numerically to determine the
magnetic potentials for all non-electrode points within the workbench that will reflect
the correct magnetic field (called “refining the array” in SIMION). Due to the mean
value property of harmonic functions, refining the array is essentially a process of
assigning a potential to each non-electrode point that is equal to the average value
among those of the neighbouring points. SIMION does this sequentially and over a
number of iterations. During each iteration, the program sequentially calculates for
every non-electrode point within the array the average potential of the 6 neighbouring
points in the 3-dimensional workbench (Fig 4.18). The program then assigns this
average value to that point.